

HBAR Price Lags the Market Bounce — Late to the Party or Not Joining at All?
HBAR price is up about 2.2% today while the broader crypto market gains more than 3.5%. 7-day performance is flat, and the token is still down 37% over the past three months.
That gap raises the core question behind the title: is HBAR simply late to the bounce (provided it holds), or is it showing signs it may not join at all?
Early Trend Signals Suggest a Late Entry, but Demand Signals Push the Other Way
The first hint that HBAR might be late rather than absent comes from the 4-hour chart. The 20-period Exponential Moving Average (EMA), which tracks short-term trend direction, has almost crossed above the 50-period EMA, a medium-term guide.
The last time this bullish crossover completed on November 10, HBAR climbed almost 10%. That same setup is flashing again, which usually marks the start of a catch-up move for lagging tokens. One similar bounce could give the HBAR price some strength. That could amplify if the price crosses above the 100-period EMA (sky blue line), a key historical resistance level.
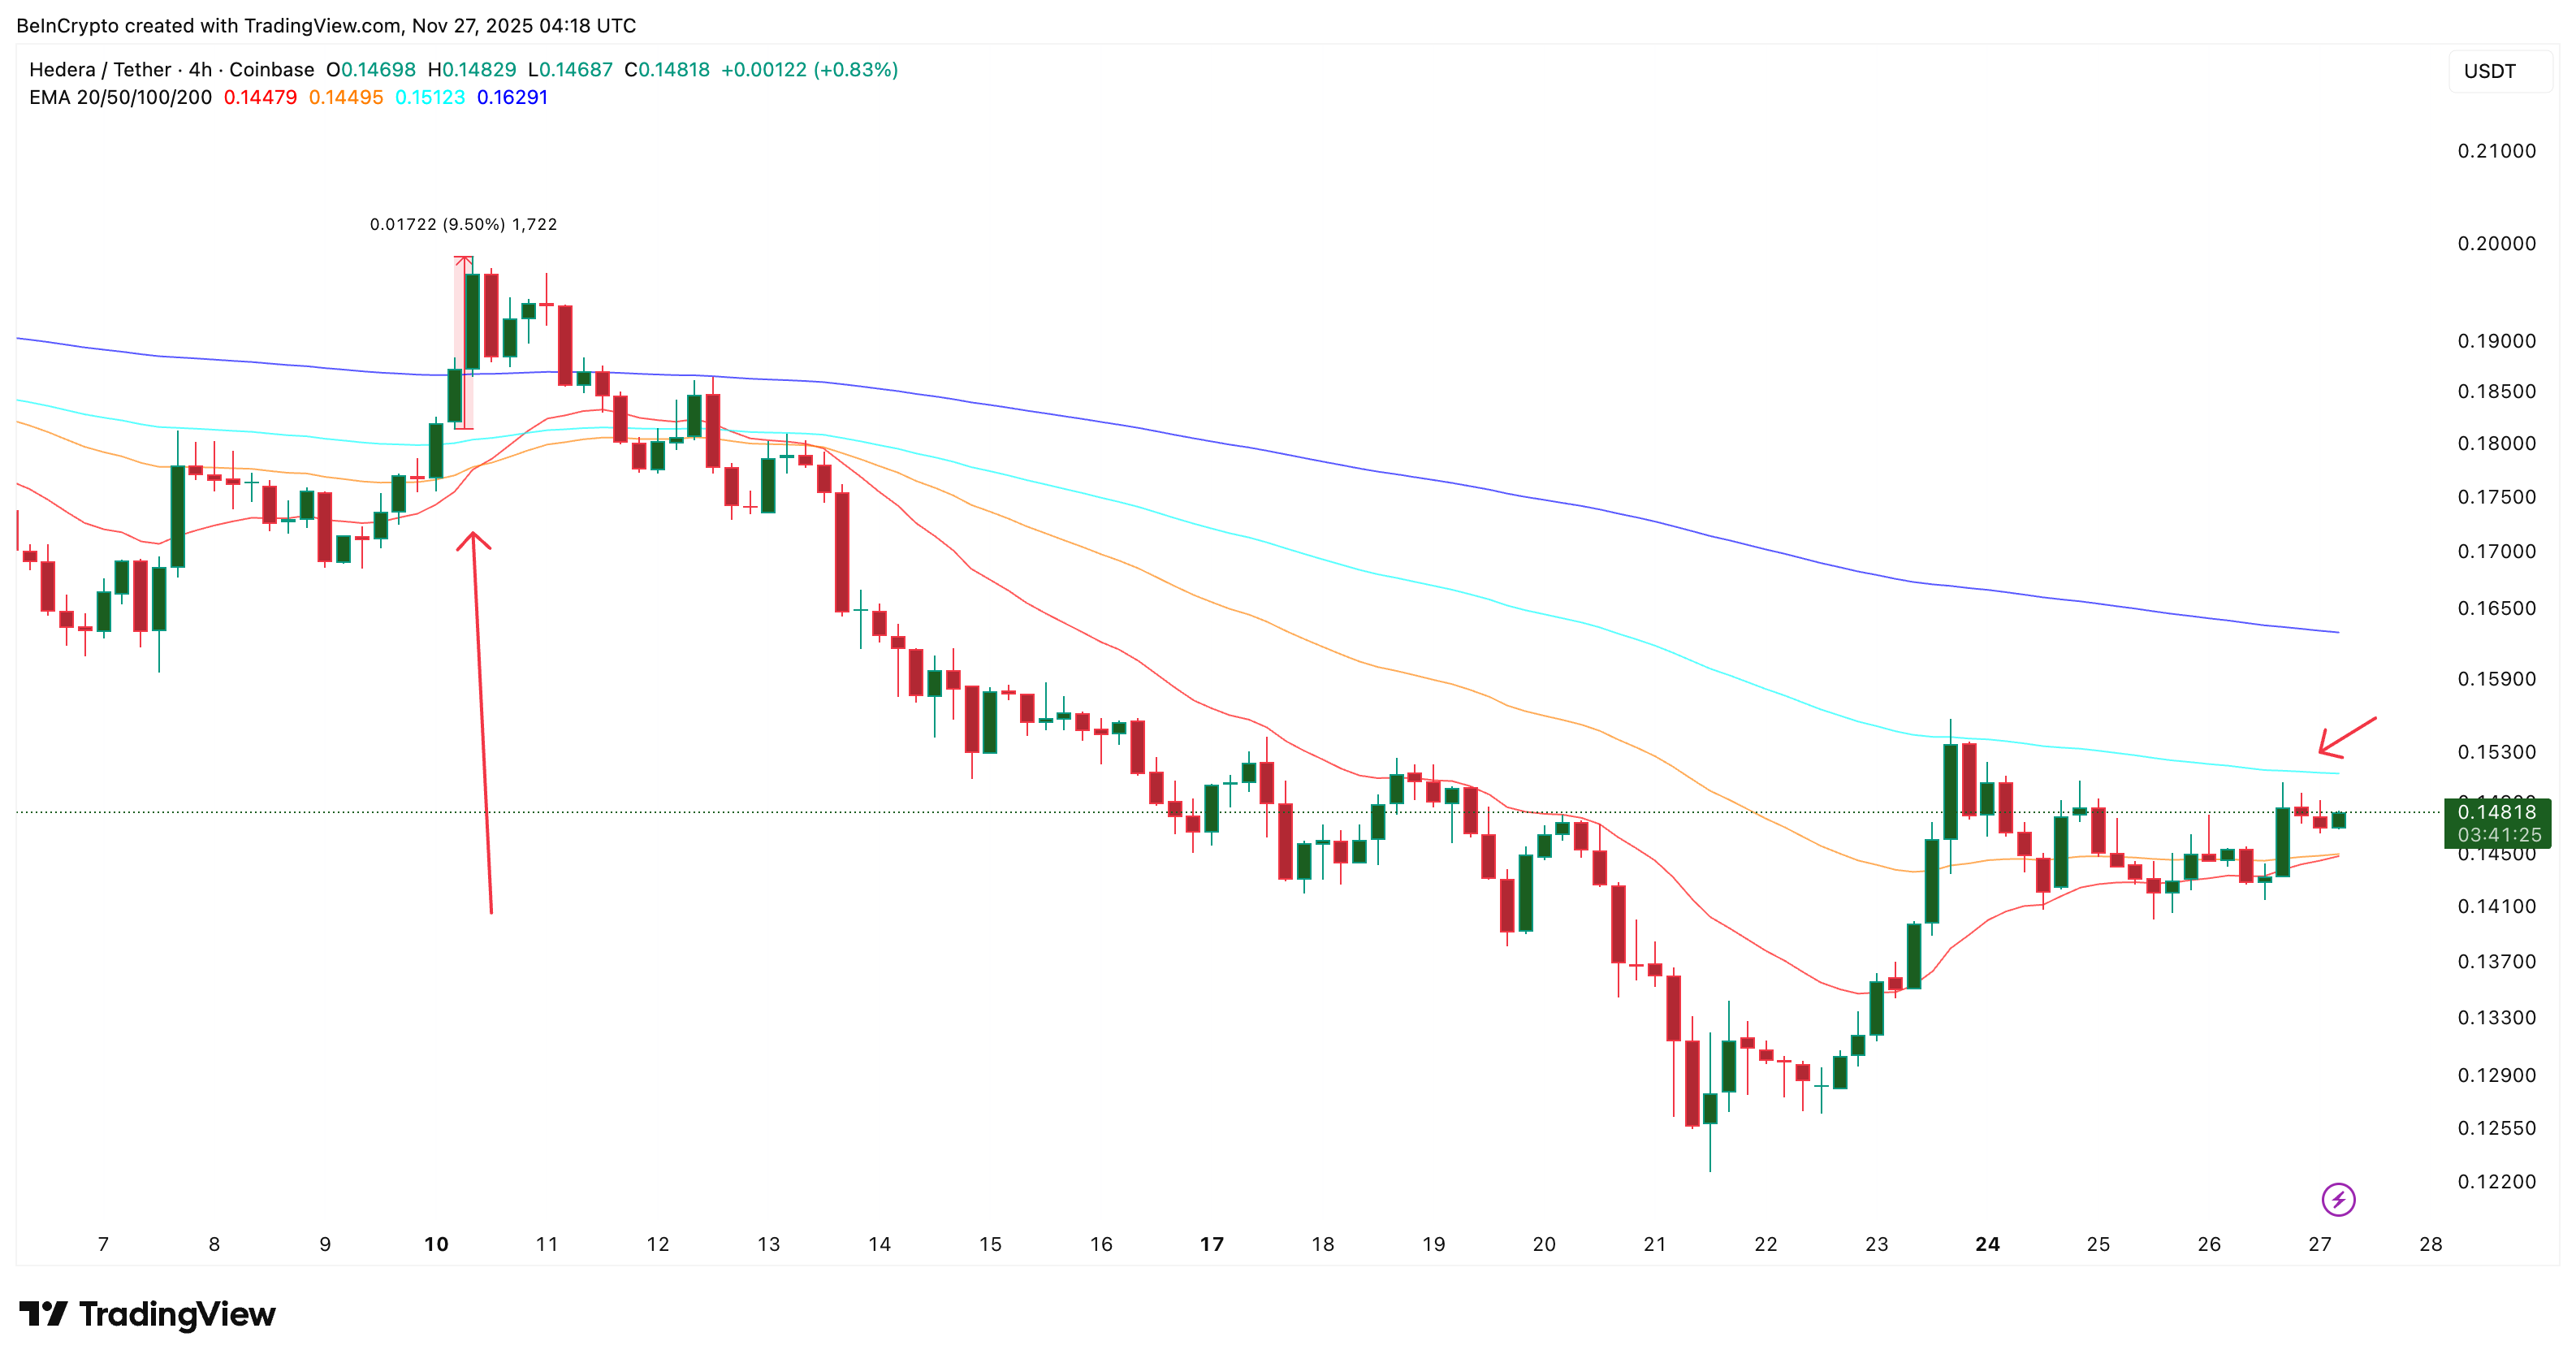 HBAR Price Action (4-Hour Chart): TradingView
Want more token insights like this? Sign up for Editor Harsh Notariya’s Daily Crypto Newsletter here.
But demand signals tell a different story. Spot flow has weakened sharply.
On November 24, netflows were close to -$5 million (net buying). Yet, today the netflow sits above +$102,000 (net selling). Even with price lifting, buyers are not stepping in. This shows traders are selling into strength, not positioning for a full recovery.
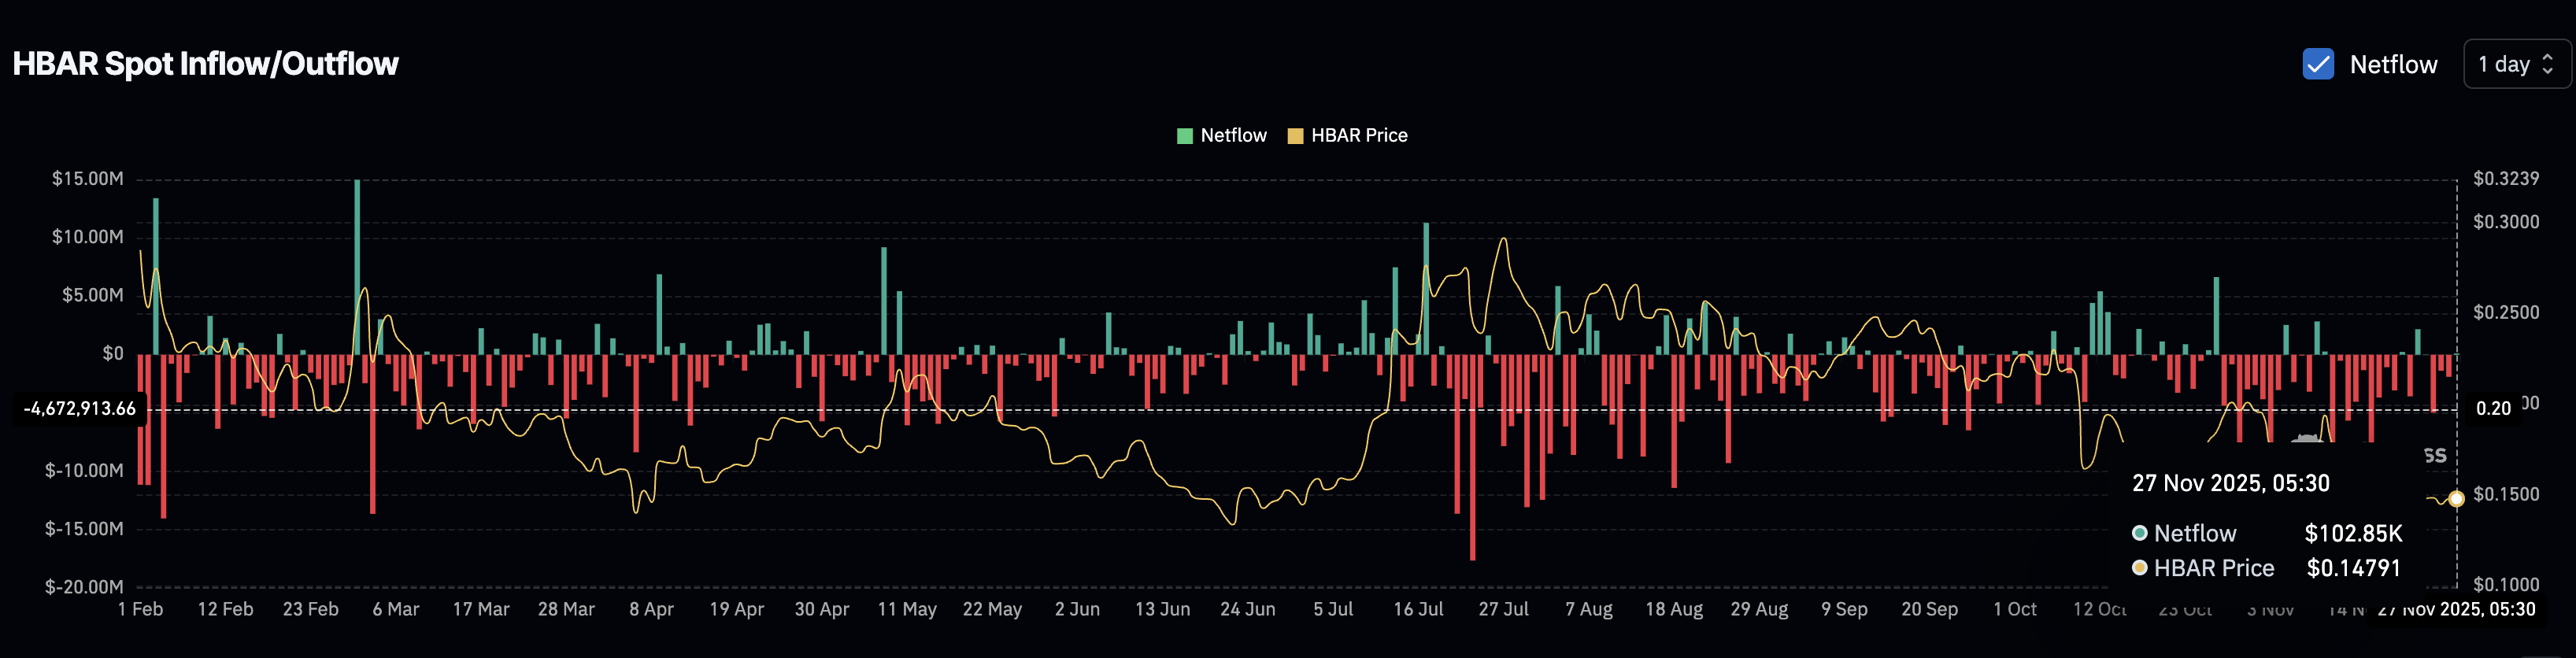 Buyers Slowing Down: Coinglass
A token that is “late to the party” usually attracts fresh demand. HBAR isn’t showing that yet. Volume confirms the hesitation.
On-Balance Volume (OBV), which tracks whether real buying volume supports a move, still shows a bearish divergence. Between October 10 and November 21, the HBAR price formed a higher low while OBV made a lower low.
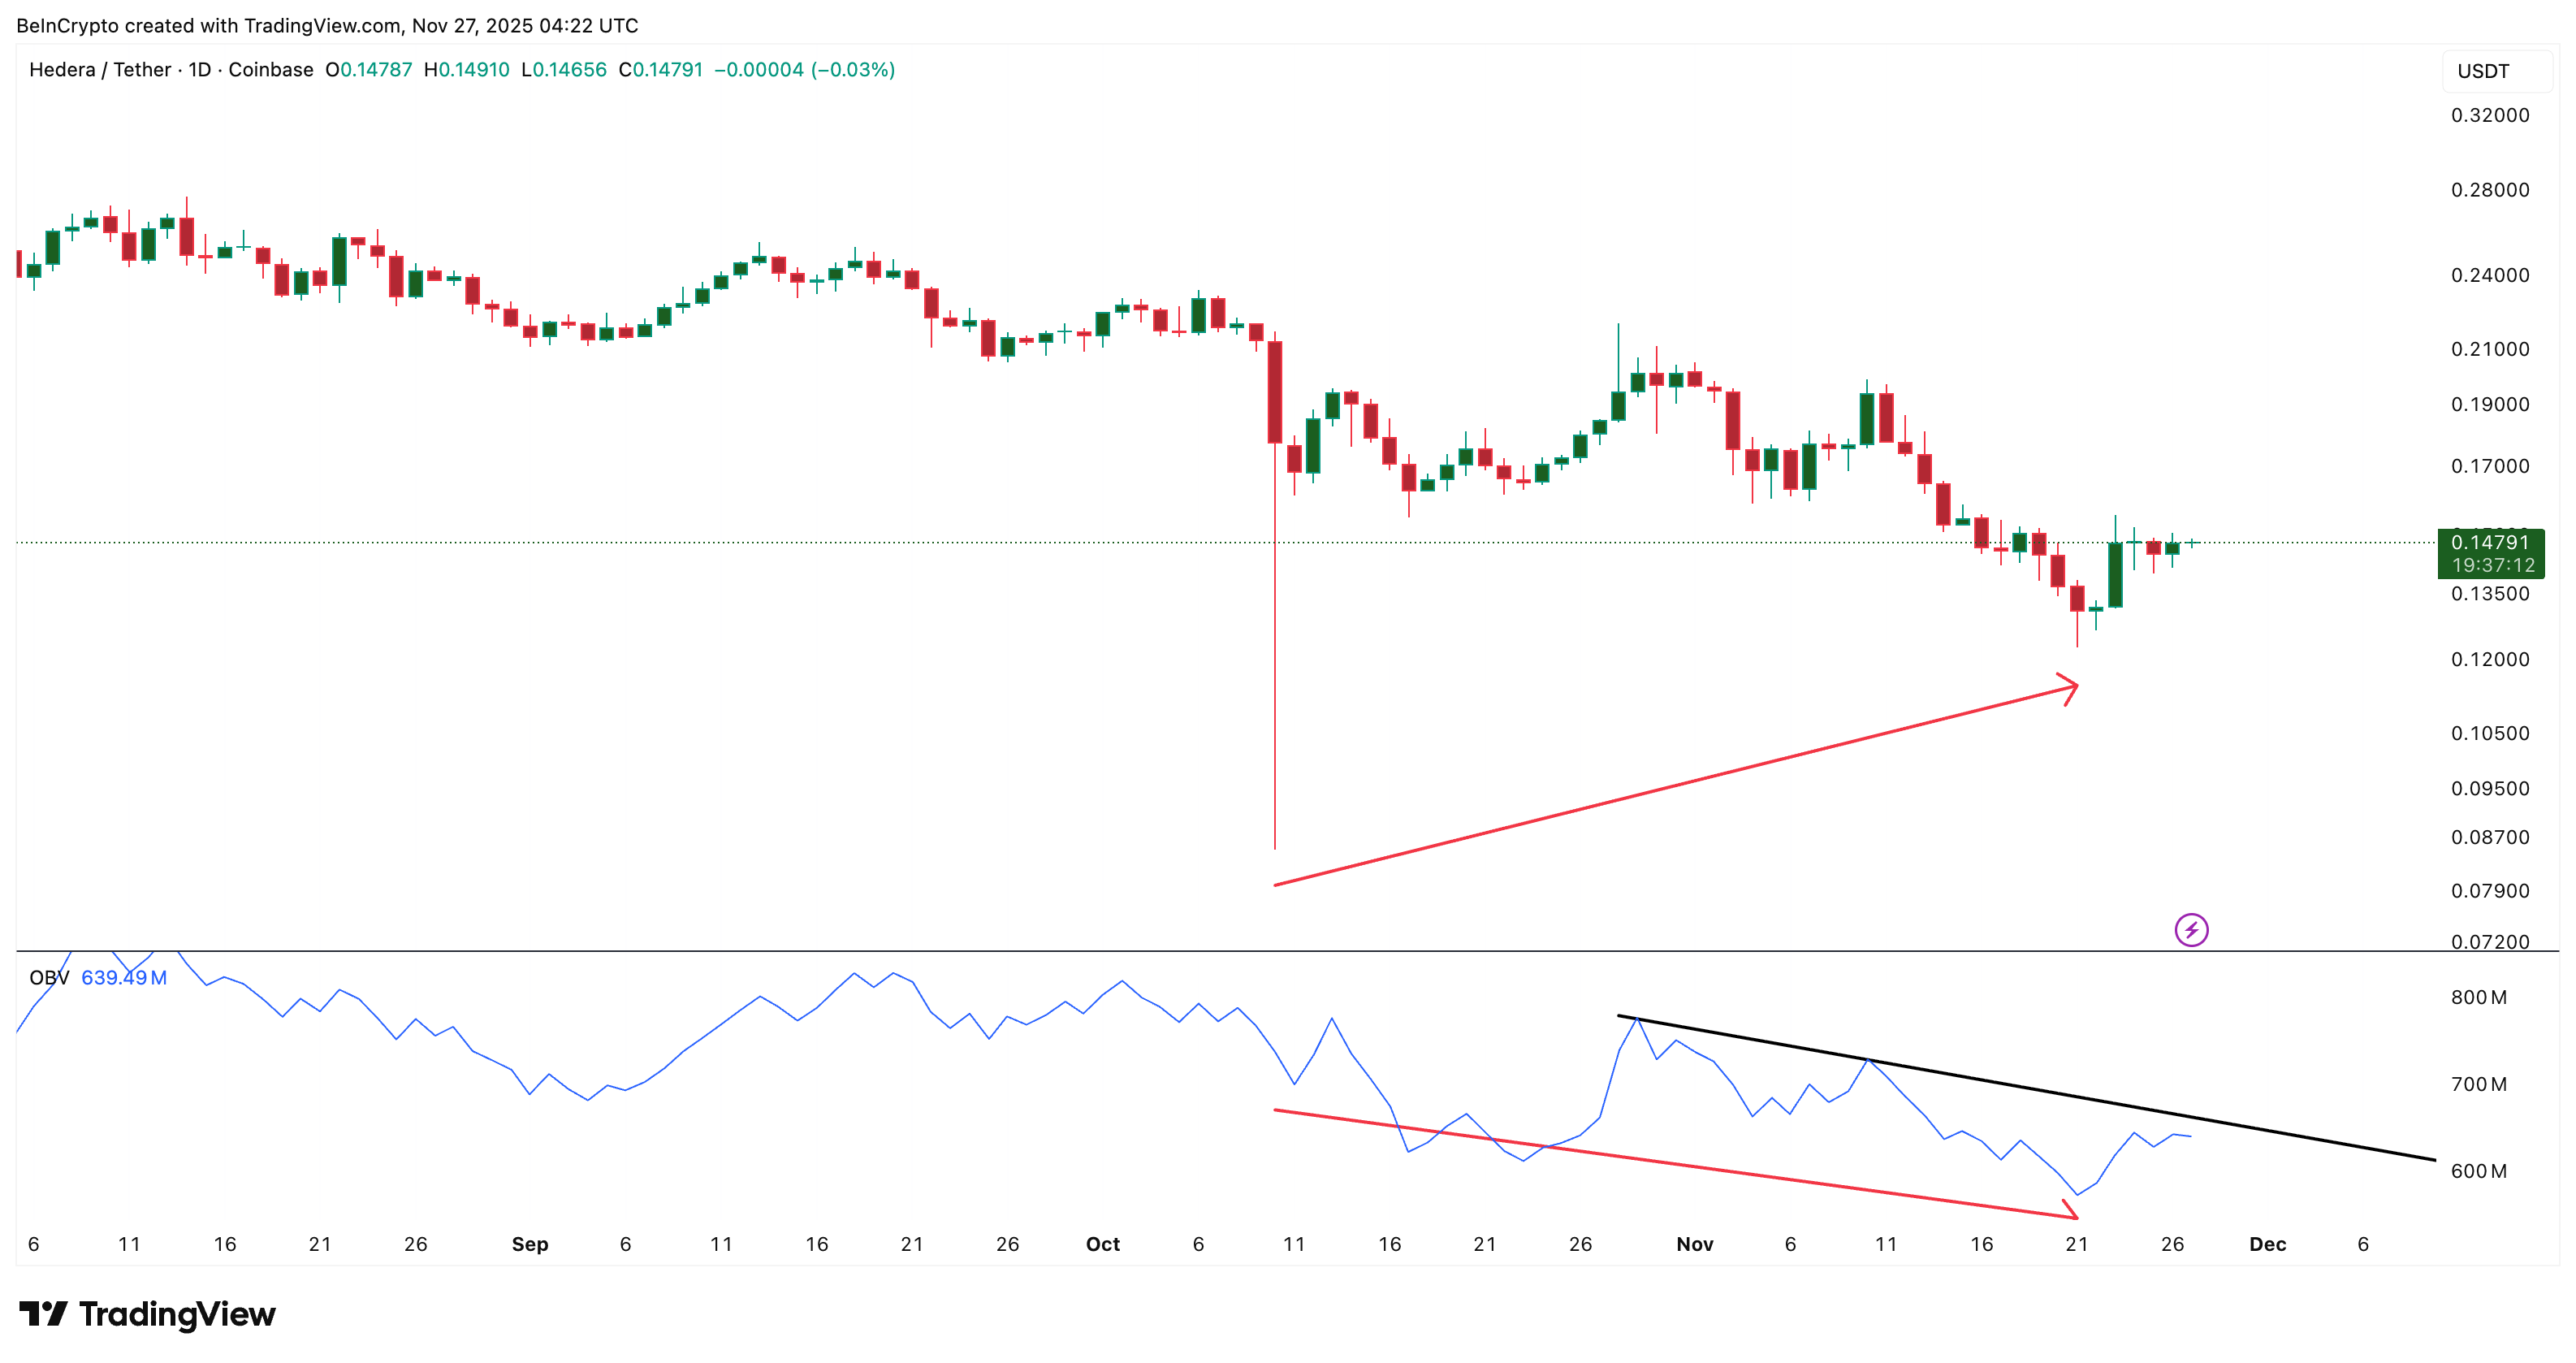 Volume Confirmation Needed: TradingView
That means the recent bounce isn’t backed by stronger volume. OBV is now closing in on its descending trendline.
A breakout above that line would show that buyers are finally returning. But as long as OBV stays below it, HBAR leans toward the “not joining at all” side of the title.
HBAR Price Levels Decide The Next Move?
All HBAR price signals converge on one key zone: $0.159.
The four-hour EMA setup can push HBAR price higher, but a daily close above $0.159 is the minimum proof that sellers are backing off. Only then can HBAR aim for $0.182 and $0.198, which would confirm it is starting to align with the wider crypto bounce, provided it lasts.
If HBAR fails to hold $0.145, the entire narrative shifts back to bearish.
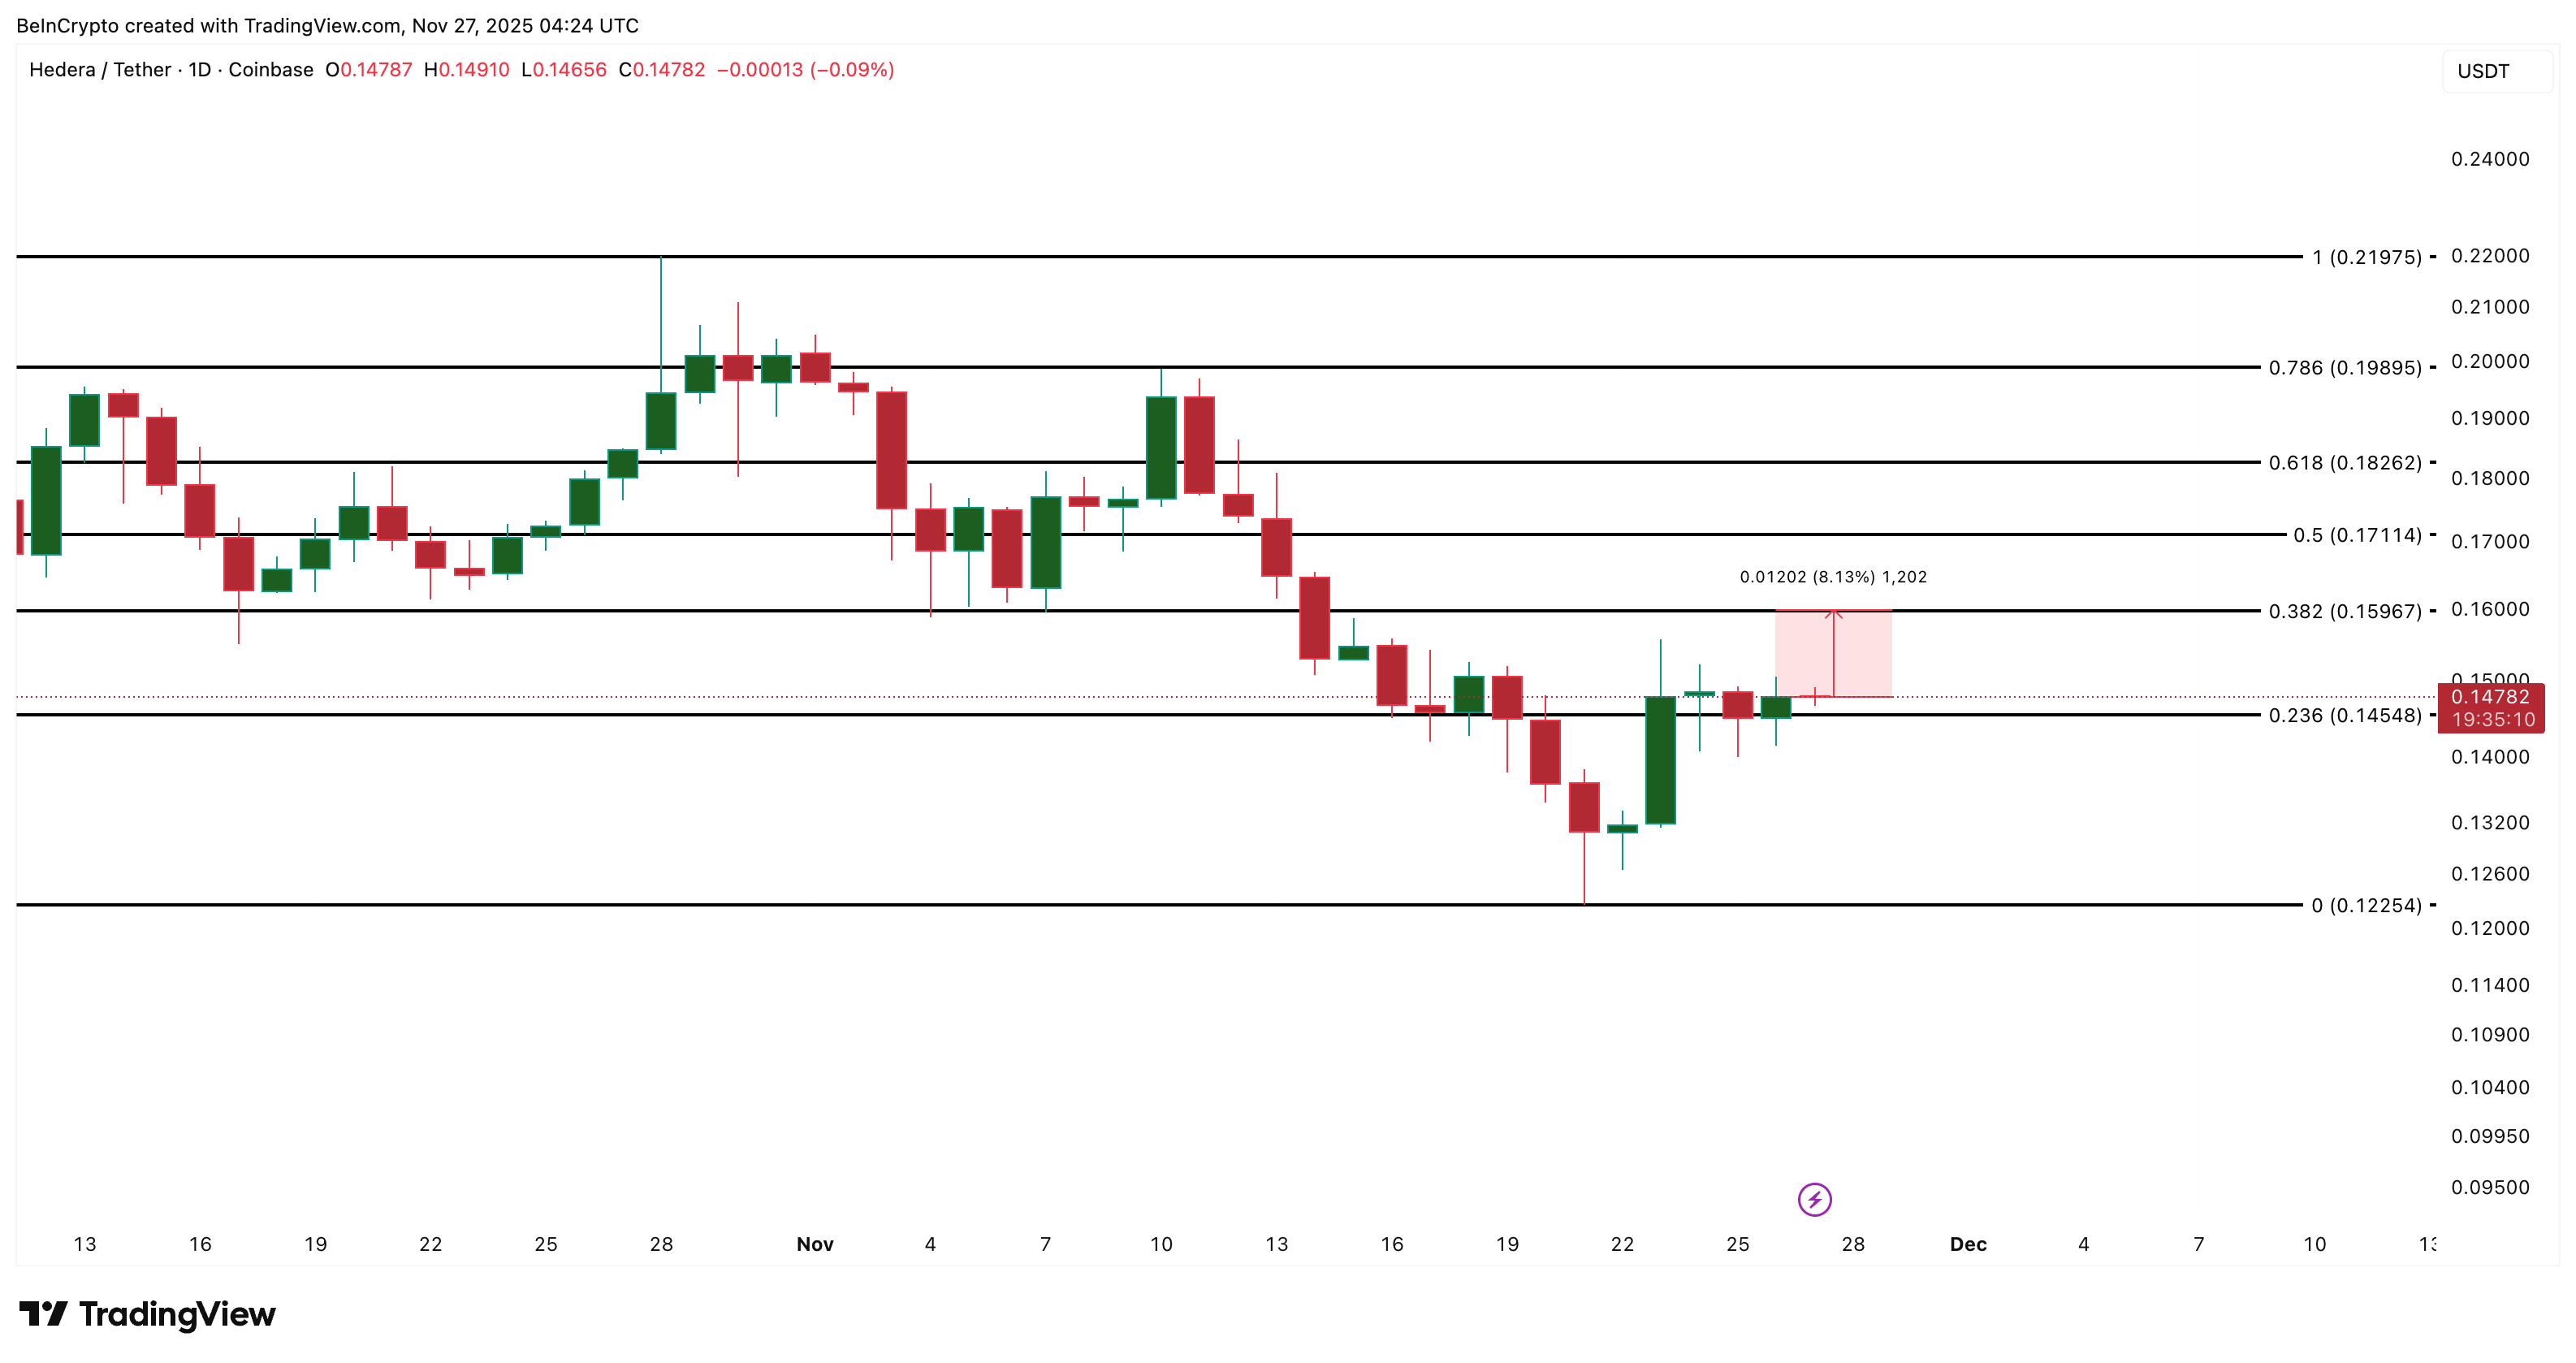 HBAR Price Analysis: TradingView
A drop below that level exposes $0.122, especially if spot selling persists and OBV fails to break its trendline. That would fit the “not joining at all” scenario — a token slipping even as the rest of the market recovers.
Right now, the short-term trend still says HBAR is just late to the party. But weak spot inflows, a bearish OBV structure, and hesitant buyers mean it could still end up not joining at all.
HBAR can catch up only if:
- OBV breaks its descending trendline,
- spot inflows strengthen, and
- price closes above $0.159.
Until these align, HBAR remains one of the few major tokens trailing the broader crypto rally instead of following it.
Recommended Articles


