XRP Rebounds From Channel Bottom, Analyst Says $2.60 Could Be Next

Source Newsbtc

A cryptocurrency analyst has pointed out how XRP has bounced off the bottom level of a Parallel Channel and could be headed toward its midway line.

XRP Recently Found Support At The Lower Line Of A Parallel Channel

In a new post on X, analyst Ali Martinez has discussed about a technical analysis (TA) pattern forming in the 3-day price of XRP. The pattern in question is a “Parallel Channel,” appearing whenever an asset’s price consolidates between two parallel trendlines.

The upper level of the channel provides resistance to the asset, making tops probable at it. Similarly, the lower line can facilitate bottom formations by acting as a source of support. A breakout of either of these bounds can imply a continuation of the trend in that direction.

There are a few different types of Parallel Channels, but the one of interest here is the most basic version: a channel that’s parallel to the time-axis. This type corresponds to a phase of true sideways movement in the price.

Now, here is the chart shared by Martinez that shows the Parallel Channel that the 3-day price of XRP has been stuck inside for the past year:

XRP Parallel Channel

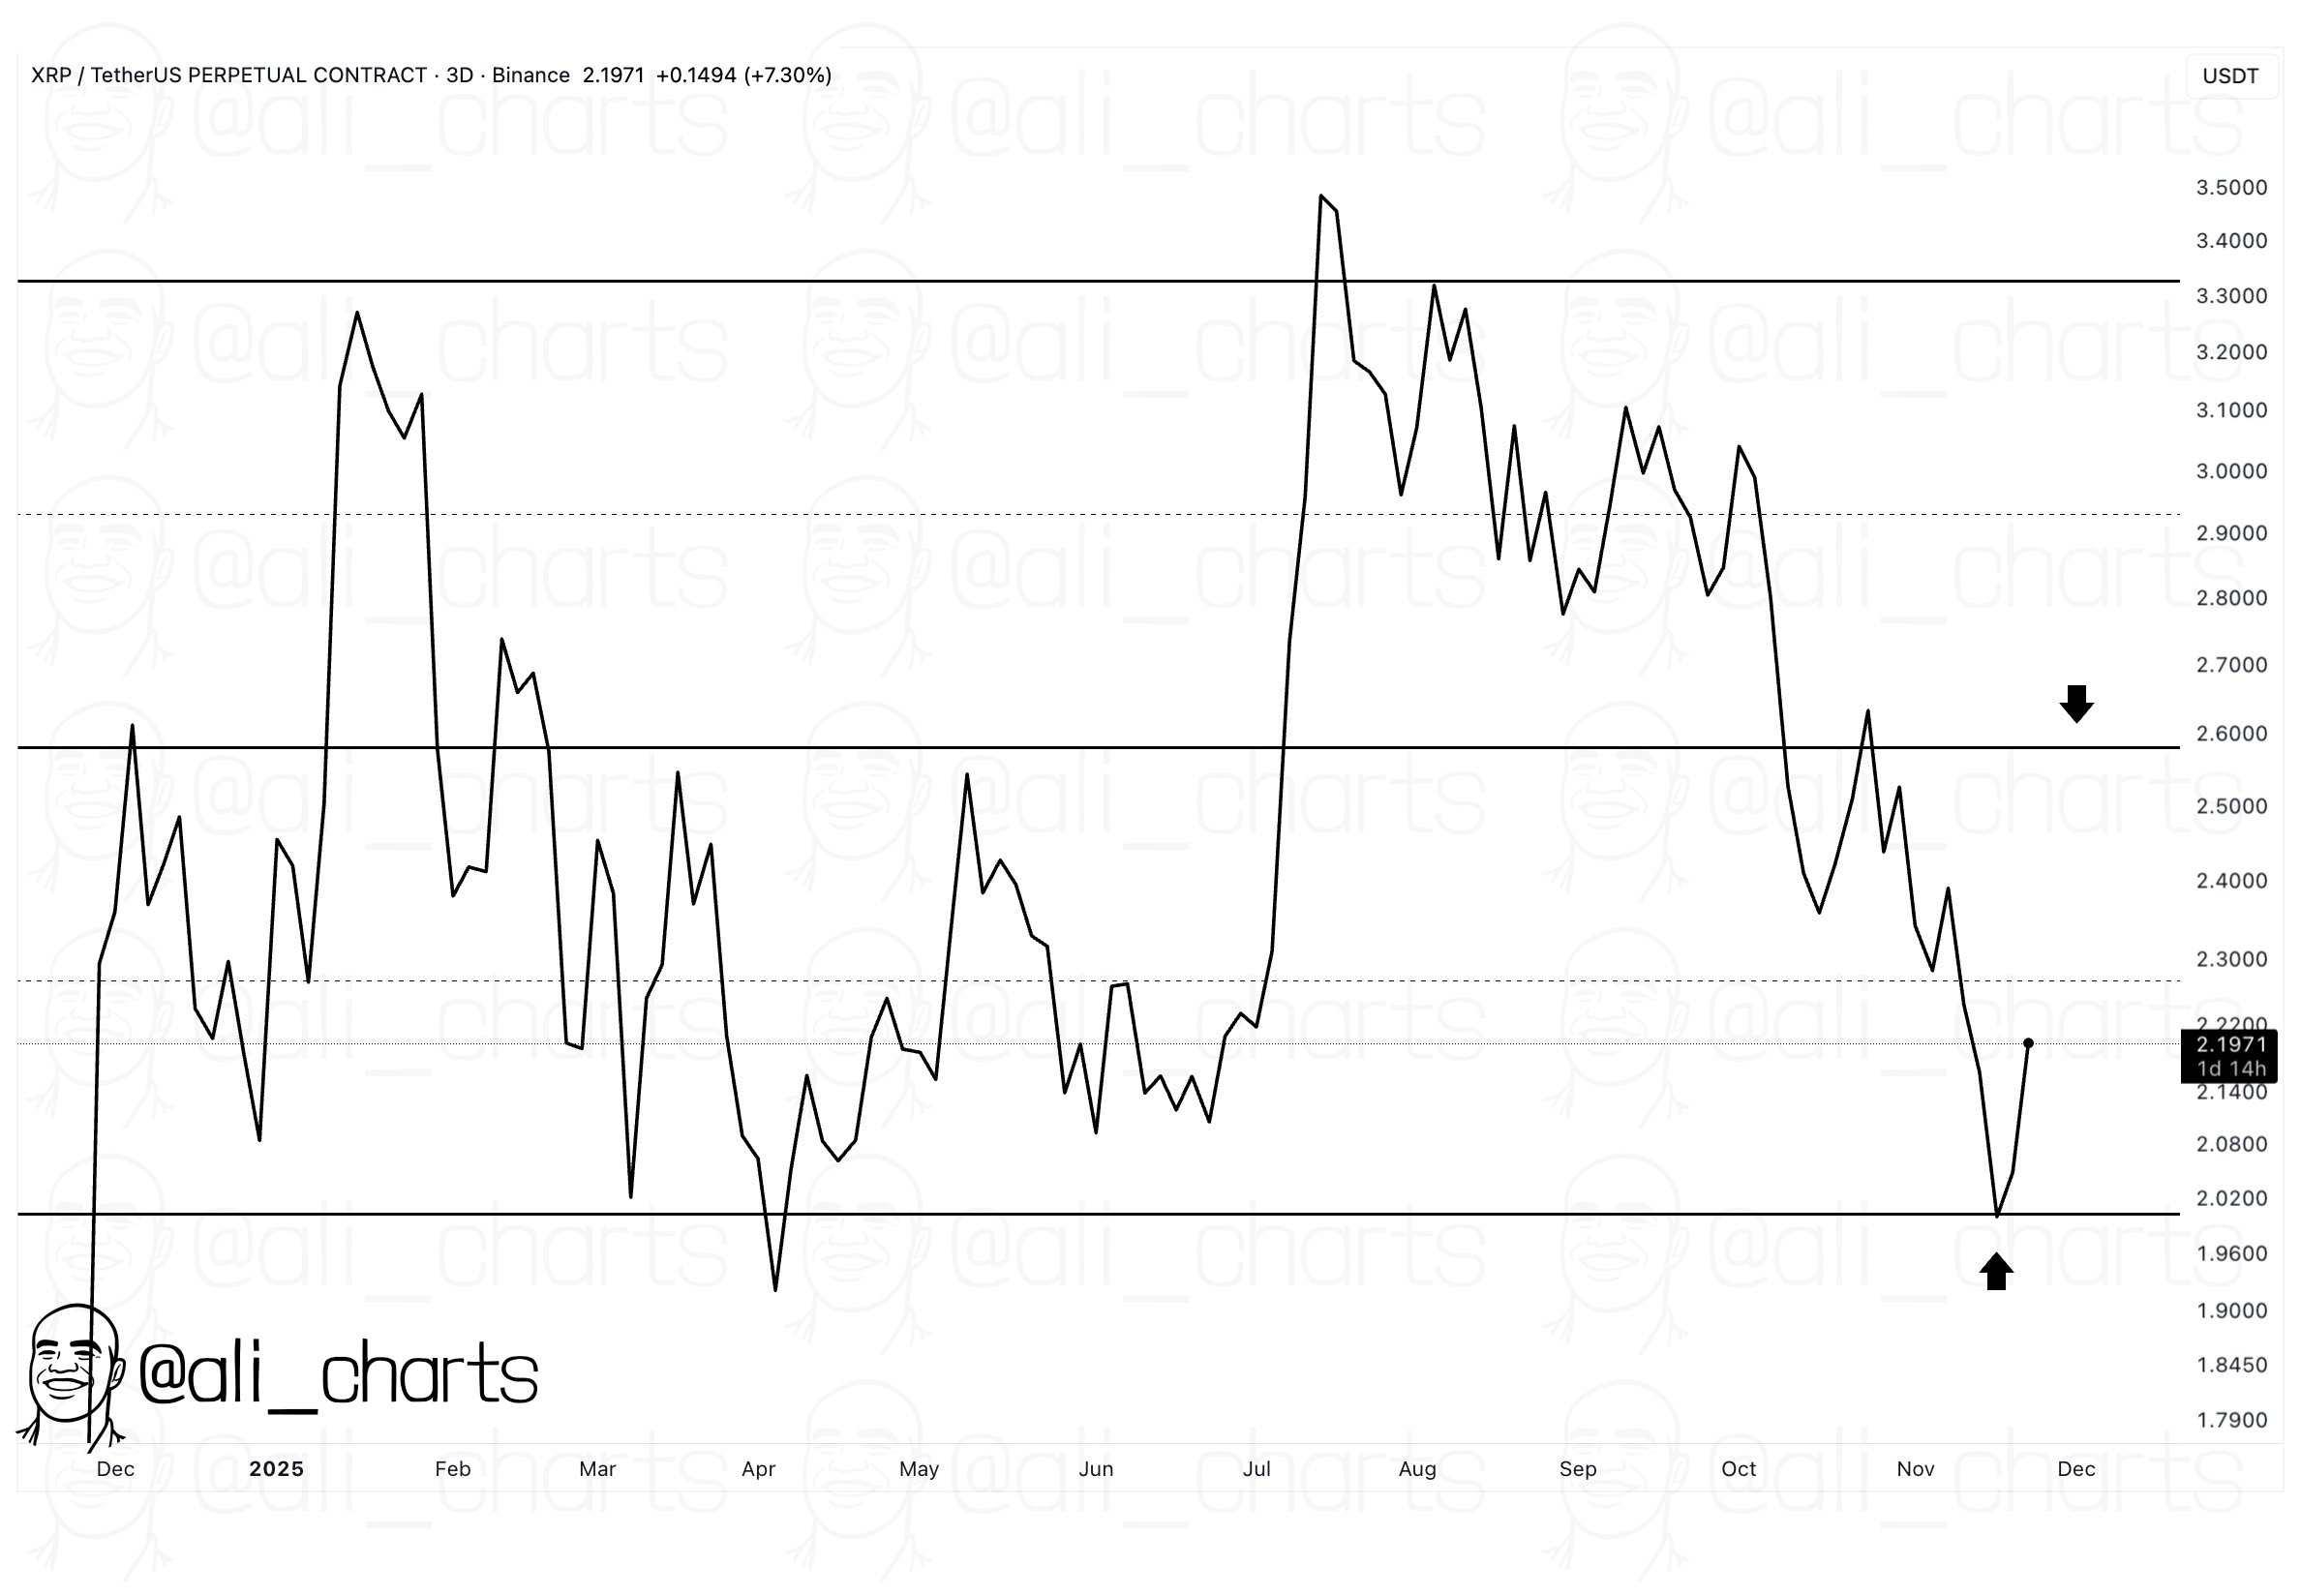
As is visible in the above graph, XRP witnessed a failed breakout beyond the upper line of the Parallel Channel back in July. This kicked off a phase of downtrend for the cryptocurrency, which culminated in a retest of the channel’s lower line earlier in November.

The coin has since observed a rebound, a potential sign that the support level of the Parallel Channel is holding up. The analyst thinks that the cryptocurrency may now be heading toward the midpoint of the pattern, located at $2.60.

From the current price of the asset, a rally to this level would mean an increase of almost 20%. It now remains to be seen whether the coin’s surge will continue, or if it will retrace back to the support line again.

Something that could make the latter scenario more likely is profit-taking from the whales. As Martinez has highlighted in another X post, the large XRP holders carrying between 1 million and 10 million tokens participated in distribution during the asset’s latest recovery surge.

XRP Whale Selling

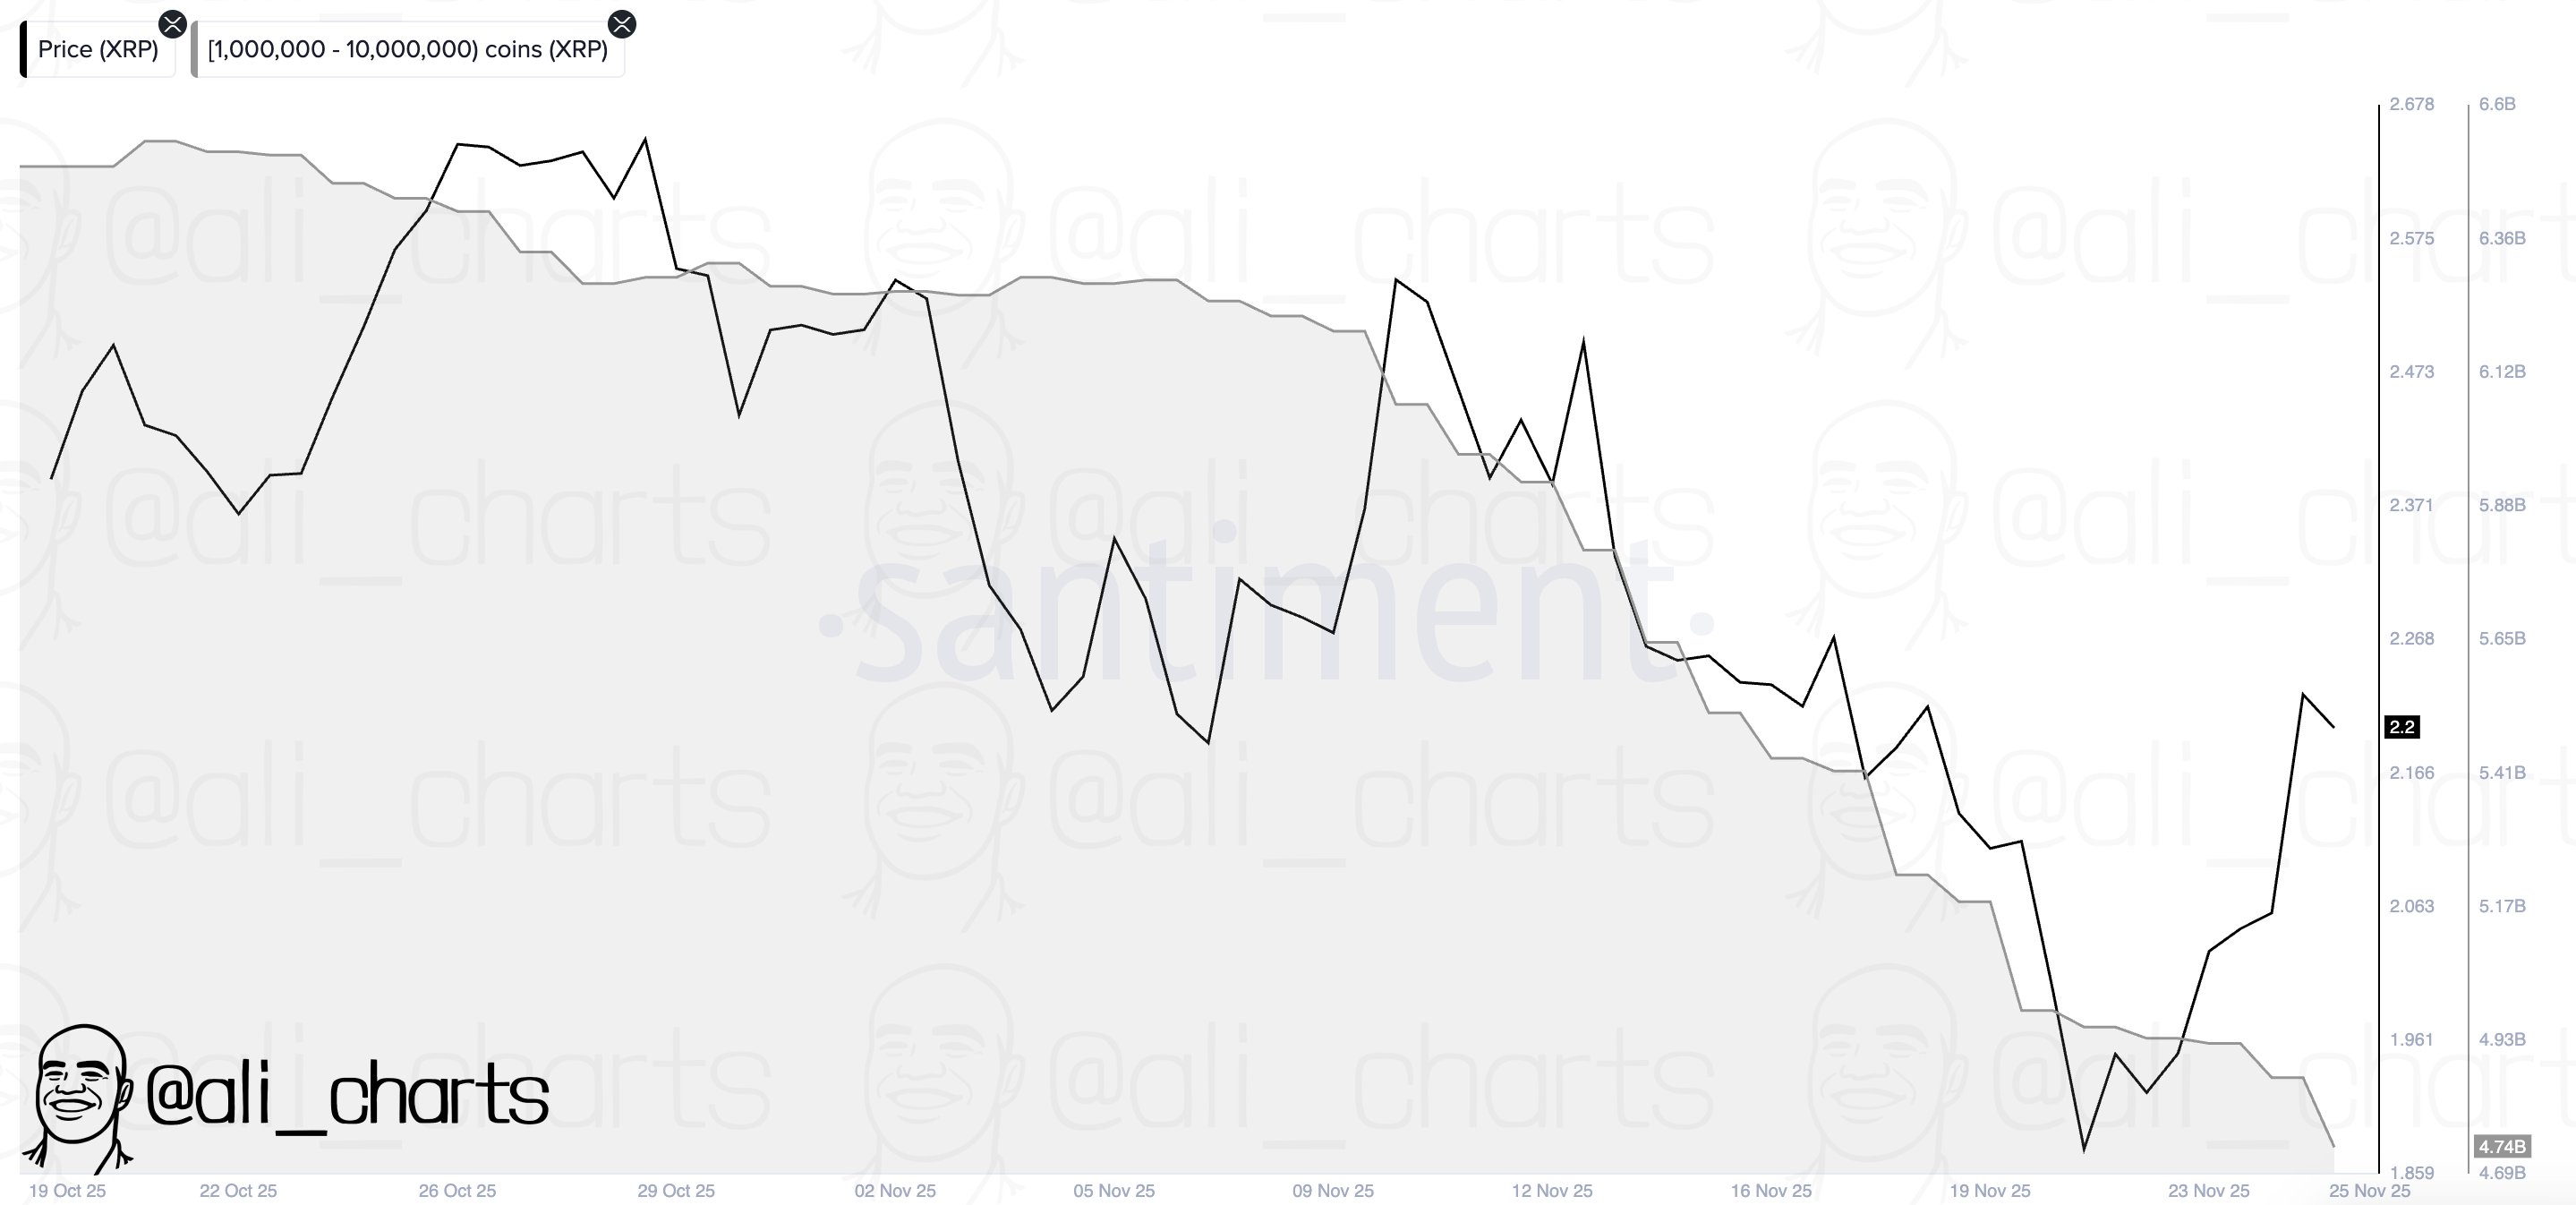
As displayed in the chart, XRP whales reduced their supply by more than 180 million tokens (worth $391 million at the latest exchange rate) alongside its 17% price rally. This selloff was only a continuation of the trend from earlier in the month, and could be a potential sign that the sentiment among big-money traders hasn’t changed despite the rebound.

XRP Price

At the time of writing, XRP is floating around $2.17, down 1.5% over the last 24 hours.

XRP Price Chart
Disclaimer: For information purposes only. Past performance is not indicative of future results.
placeholder
2025 Black Friday is coming! Which stocks may see volatility?Coming on the day right after Thanksgiving in the United States, Back Friday marks the start of the holiday shopping season. Sales data from this shopping frenzy day reflects investor confidence and consumer trends. The National Retail Federation (NRF) predicts that holiday season (Nov and Dec) retail sales in 2025 will likely exceed $1 trillion for the very first time, which represents a year-over-year increase of 3.7 to 4.2 percent. Historic data from the past decade show that the retail sector has generally outperformed the S&P 500 during the weeks before and after Black Friday. The following retailing companies are expected to be big winners:
Author  Insights
Nov 24, Mon
Coming on the day right after Thanksgiving in the United States, Back Friday marks the start of the holiday shopping season. Sales data from this shopping frenzy day reflects investor confidence and consumer trends. The National Retail Federation (NRF) predicts that holiday season (Nov and Dec) retail sales in 2025 will likely exceed $1 trillion for the very first time, which represents a year-over-year increase of 3.7 to 4.2 percent. Historic data from the past decade show that the retail sector has generally outperformed the S&P 500 during the weeks before and after Black Friday. The following retailing companies are expected to be big winners:
placeholder
Bitcoin Bleeds to $86K, But This Key Indicator Screams "The Top Isn't In"Bitcoin’s adjusted Spent Output Profit Ratio (aSOPR) has spent nearly two years coiling below the extremes seen at past bull-market peaks, even as BTC trades around $86,300 and down 9% on the week — a setup that leaves open the possibility that this cycle’s true top may still lie ahead.
Author  Mitrade
Nov 25, Tue
Bitcoin’s adjusted Spent Output Profit Ratio (aSOPR) has spent nearly two years coiling below the extremes seen at past bull-market peaks, even as BTC trades around $86,300 and down 9% on the week — a setup that leaves open the possibility that this cycle’s true top may still lie ahead.
placeholder
Bitcoin Price Rebound Gains Traction with $90K Break in SightBitcoin is trading above $87,000 and its 100-hour SMA after rebounding from $83,500, with a bearish trend line at $88,200 and resistance at $89,000–$90,000 now in focus as BTC either breaks higher toward $91,750–$94,000 or slips back toward $86,700, $85,000 and lower supports.
Author  Mitrade
Yesterday 02: 58
Bitcoin is trading above $87,000 and its 100-hour SMA after rebounding from $83,500, with a bearish trend line at $88,200 and resistance at $89,000–$90,000 now in focus as BTC either breaks higher toward $91,750–$94,000 or slips back toward $86,700, $85,000 and lower supports.
placeholder
Bitcoin Targets $89K Breakout as S&P 500 Nears ATH on Fed Rate Cut HopesBitcoin price action shows signs of a potential short squeeze as it hovers near $88,000, with analysts watching liquidity dynamics that could push it toward $89,000 or retrace to $85,000.
Author  Mitrade
2 hours ago
Bitcoin price action shows signs of a potential short squeeze as it hovers near $88,000, with analysts watching liquidity dynamics that could push it toward $89,000 or retrace to $85,000.
placeholder
Ethereum Reclaims $3K Handle—Is a Breakout Imminent?Ethereum has jumped back above $3,000 and reclaimed key Fib levels, with a bullish trend line at $2,880 and strong MACD/RSI readings putting a breakout above $3,120–$3,165 — and a possible run toward $3,320–$3,350 — on the table, as long as support around $2,980–$2,920 holds.
Author  Mitrade
2 hours ago
Ethereum has jumped back above $3,000 and reclaimed key Fib levels, with a bullish trend line at $2,880 and strong MACD/RSI readings putting a breakout above $3,120–$3,165 — and a possible run toward $3,320–$3,350 — on the table, as long as support around $2,980–$2,920 holds.
goTop
quote