


Copper Price Forecast: US Refined Copper Tariffs May Be Delayed, Copper Prices Plunge After Record High, Can They Still Rise?
TradingKey - On September 9, copper prices hit an all-time high of 14,854, but subsequent changes in U.S. refined copper tariff policy triggered a sharp drop on Thursday, with prices plunging 4.48% on the day to close at $14,169.
US Refined Copper Tariffs May Be Delayed as Copper Market Readjusts Prior Tariff Premium
The U.S. government had previously been evaluating new tariff measures on refined copper imports. The market once expected that the U.S. might impose a 15% tariff on refined copper starting in 2027 and raise rates further thereafter, prompting importers and traders to increase copper shipments to the U.S. in advance.
However, according to a Reuters report on September 10, the White House has not yet made a final decision on refined copper tariffs. The administration is weighing the support higher tariffs would provide to U.S. copper mining and smelting industries against the additional costs rising copper prices could impose on manufacturing and consumers. Consequently, refined copper tariffs, which the market previously expected to advance quickly, now face potential delays.
The U.S. currently relies on imports for about half of its copper demand, while operating only two domestic copper smelters. Raising import tariffs could boost the competitiveness of domestic mines and smelting projects. However, copper is also widely used in industries such as power equipment, automobiles, construction, air conditioning, and data centers, meaning further increases in copper prices would directly raise downstream manufacturing costs. White House concerns over "affordability" and manufacturing costs are among the key reasons why the policy decision has been delayed.
Tariff expectations had previously significantly altered global copper trade flows.
Driven by concerns over potential future increases in U.S. refined copper import costs, traders have continuously shipped copper to the U.S. in advance over past months. Data from Reuters showed that in the first half of 2026 alone, the U.S. imported approximately 885,000 metric tons of copper, and by the end of August, COMEX copper inventories once rose to a record high of about 675,000 metric tons. Meanwhile, the massive influx of copper into the U.S. tightened deliverable inventories in other markets such as the LME and drove U.S. copper prices to a noticeable premium over international markets.
If refined copper tariffs continue to be delayed or are ultimately not implemented, the necessity for U.S. importers to stockpile in advance will decrease, and the wide price spread between COMEX and the LME may also narrow. Whether the large volume of copper inventories already sitting in U.S. warehouses will flow back into other markets in the future will also impact the global spot supply structure.
For the market, the largest policy variable ahead remains how the White House will ultimately address refined copper imports. The U.S. Department of Commerce has submitted recommendations to the President, but a final decision has yet to be announced. If tariffs are reconfirmed in the future, traders may again have greater incentive to ship copper to the U.S. If tariffs are delayed for an extended period or canceled, the inventory stockpiling in the U.S. and regional price spreads formed under prior tariff expectations could undergo further correction.
Copper Price Technical Analysis
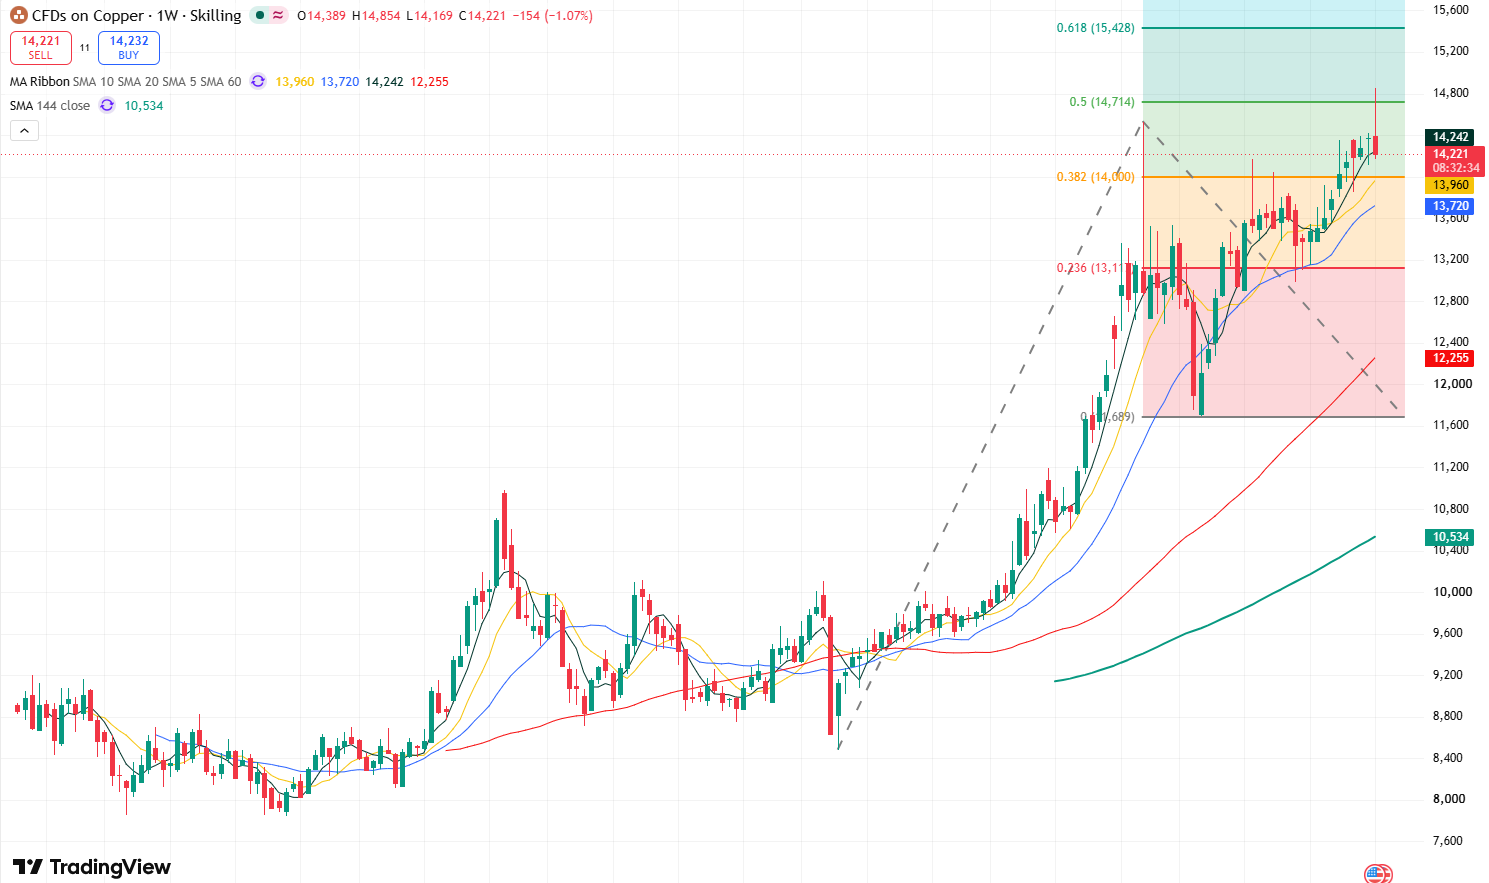
Copper Price Weekly Chart, Source: TradingView
Looking at the weekly chart of copper prices, the overall trend displays a clear upward movement. Furthermore, as the medium-to-long-term moving averages SMA60 and SMA144 maintain a bullish alignment, it further confirms that the medium-to-long-term trend remains bullish.
Currently, copper prices reached an all-time high of $14,854 this week, but the weekly closing price may settle below the Fibonacci 0.5 extension level at $14,700, forming a long upper shadow. This suggests that market bullish momentum may be weakening, and copper prices could enter a phase of range-bound consolidation in the short term.
On the upside, the primary resistance zone for copper prices to watch is $14,700–$14,854. If copper prices can effectively break above and hold firm over $14,700, they will further test $15,000 to the upside. If copper prices can hold above $15,000, it may open up upside space toward the Fibonacci 0.618 extension level at $15,400.
On the downside, the primary support zone to watch below copper prices is $14,100–$14,000, followed by $13,800 further down. If the decline continues, copper prices could test the $13,350 support level.
Recommended Articles


