

USD/CHF Price Forecast: Buyers struggle to clear the 21-day SMA

Source Fxstreet
  • USD/CHF maintains a mildly bullish bias, holding above the 50-day SMA.
  • Momentum remains mixed, with the RSI near neutral and the MACD below zero.
  • Buyers need to clear the 21-day SMA to strengthen the near-term recovery.

USD/CHF trades with a positive bias on Tuesday as the US Dollar (USD) consolidates its recent gains ahead of Wednesday’s US Consumer Price Index (CPI) data. Price action has stabilized above the 50-day Simple Moving Average (SMA) following a sharp pullback from above 0.8200 in late July.

At the time of writing, the pair trades around 0.8113, extending gains for a second consecutive day. Meanwhile, the US Dollar Index (DXY), which tracks the Greenback’s value against a basket of six major currencies, hovers around 99.85 following repeated rebounds from 99.50 in recent days.
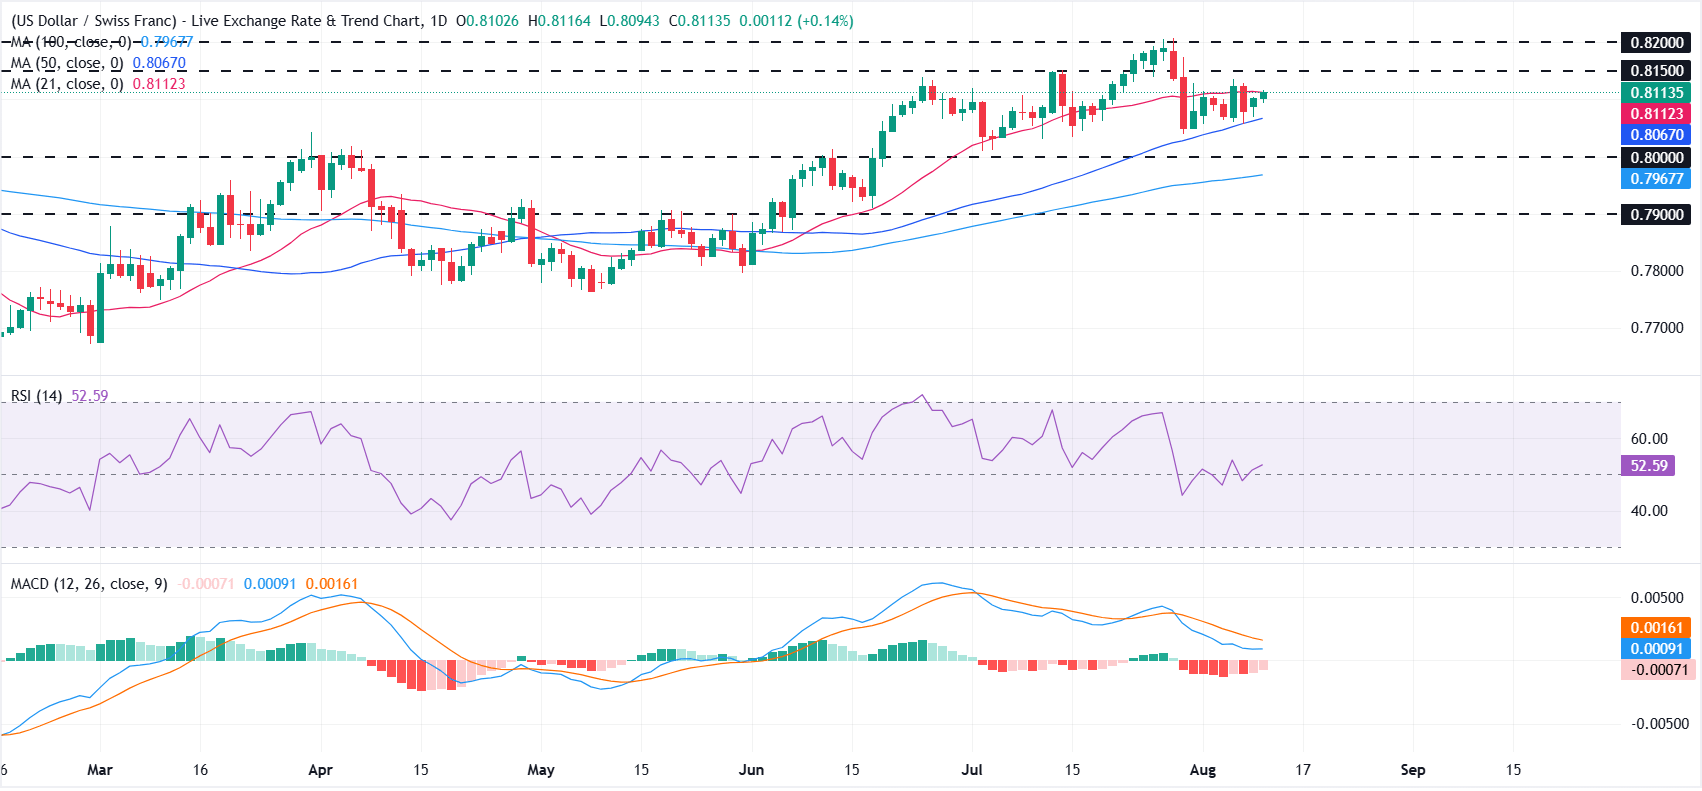
USD/CHF holds a mildly positive technical tone above the 50-day Simple Moving Average (SMA) at 0.8067, though the 21-day SMA at 0.8112 keeps gains in check.

The 100-day SMA at 0.7968 supports the broader recovery structure, while the Relative Strength Index (RSI) near 52 points to balanced momentum after cooling from earlier overbought levels.

The Moving Average Convergence Divergence (MACD) remains in negative territory, suggesting that upside momentum has weakened. However, the broader tone stays constructive as long as the pair holds above the 50-day SMA.

A sustained break above the 21-day SMA could open the door to 0.8150, followed by the 0.8200 psychological mark. On the downside, a move below the 50-day SMA would expose the 0.8000 psychological level. Further losses could bring the 100-day SMA at 0.7968 and the horizontal support at 0.7900 into focus.

(The technical analysis of this story was written with the help of an AI tool. Know more.)

Economic Indicator

Consumer Price Index (MoM)

Inflationary or deflationary tendencies are measured by periodically summing the prices of a basket of representative goods and services and presenting the data as The Consumer Price Index (CPI). CPI data is compiled on a monthly basis and released by the US Department of Labor Statistics. The MoM figure compares the prices of goods in the reference month to the previous month.The CPI is a key indicator to measure inflation and changes in purchasing trends. Generally, a high reading is seen as bullish for the US Dollar (USD), while a low reading is seen as bearish.

Read more.

Next release: Wed Aug 12, 2026 12:30

Frequency: Monthly

Consensus: 0.1%

Previous: -0.4%

Source: US Bureau of Labor Statistics

The US Federal Reserve (Fed) has a dual mandate of maintaining price stability and maximum employment. According to such mandate, inflation should be at around 2% YoY and has become the weakest pillar of the central bank’s directive ever since the world suffered a pandemic, which extends to these days. Price pressures keep rising amid supply-chain issues and bottlenecks, with the Consumer Price Index (CPI) hanging at multi-decade highs. The Fed has already taken measures to tame inflation and is expected to maintain an aggressive stance in the foreseeable future.

Disclaimer: For information purposes only. Past performance is not indicative of future results.
placeholder
US dollar clings to nine-week lows near 98.4 as Brent nears $100 and the yen hits a seven-month high — five events to watch todayThe dollar is pinned near nine-week lows even after a blockbuster jobs report, as an oil spike toward $100, a surging yen and China's reflation data crowd the driver's seat. Five key events to watch today: Brent at $99.46, USD/JPY at 154, China CPI/PPI, PBOC gold buying, and Thursday's PPI / Friday's CPI ahead of the September 15-16 FOMC.
Author  Eric Nkando
Sep 09, Wed
The dollar is pinned near nine-week lows even after a blockbuster jobs report, as an oil spike toward $100, a surging yen and China's reflation data crowd the driver's seat. Five key events to watch today: Brent at $99.46, USD/JPY at 154, China CPI/PPI, PBOC gold buying, and Thursday's PPI / Friday's CPI ahead of the September 15-16 FOMC.
placeholder
US August CPI lands tonight: after a 5.4% PPI shock, will the Fed hike on September 16?US August PPI came in at 5.4% year-on-year, above the 5.3% consensus, with core PPI at 4.6%. Traders have pushed the odds of a 25bp Fed hike on September 15-16 to around 70%. Tonight's CPI is the last major inflation print before the decision — here is the full calendar, the consensus numbers, and what a hot versus cool reading would mean for the dollar, yields, gold and stocks.
Author  Irene Q.
Sep 11, Fri
US August PPI came in at 5.4% year-on-year, above the 5.3% consensus, with core PPI at 4.6%. Traders have pushed the odds of a 25bp Fed hike on September 15-16 to around 70%. Tonight's CPI is the last major inflation print before the decision — here is the full calendar, the consensus numbers, and what a hot versus cool reading would mean for the dollar, yields, gold and stocks.
placeholder
Brent tests $108 as a key export pipeline stays shut — can the rally clear $110?Brent crude rose 2.55% to $106.97 and WTI 2.32% to $102.30 as a major regional export pipeline remained offline with no restart timeline. Front-month backwardation has widened to $5.53 from $3.84 a week ago, European gas is at its highest since December 2022, and one analyst sees $119.48 if talks stall.
Author  Irene Q.
17 hours ago
Brent crude rose 2.55% to $106.97 and WTI 2.32% to $102.30 as a major regional export pipeline remained offline with no restart timeline. Front-month backwardation has widened to $5.53 from $3.84 a week ago, European gas is at its highest since December 2022, and one analyst sees $119.48 if talks stall.
placeholder
Fed hike odds near 90% into Wednesday's decision — how to trade the dollar, gold and the S&P 500A 0.3% monthly core CPI print has lifted the market-implied probability of a 25bp Fed hike on 16 September to roughly 86.5% ~ 90%, which would be the first increase since July 2023. Here is the decision timeline, the pricing versus the forecasts, both scenarios, and the key levels for the dollar, gold and the S&P 500.
Author  Suzie
17 hours ago
A 0.3% monthly core CPI print has lifted the market-implied probability of a 25bp Fed hike on 16 September to roughly 86.5% ~ 90%, which would be the first increase since July 2023. Here is the decision timeline, the pricing versus the forecasts, both scenarios, and the key levels for the dollar, gold and the S&P 500.
placeholder
Silver Price Forecast: XAG/USD falls to near $63.50 amid Fed hike bets, higher oil pricesSilver price (XAG/USD) loses its gains from the previous day, trading around $63.50 per troy ounce during Asian hours on Monday. Non-yielding Silver is currently facing significant headwinds driven by rising Federal Reserve (Fed) rate-hike expectations for the upcoming September decision.
Author  FXStreet
14 hours ago
Silver price (XAG/USD) loses its gains from the previous day, trading around $63.50 per troy ounce during Asian hours on Monday. Non-yielding Silver is currently facing significant headwinds driven by rising Federal Reserve (Fed) rate-hike expectations for the upcoming September decision.
Related Instrument
goTop
quote