

GBP/JPY Price Forecast: Holds above 218.00 bulls eye YTD peak

Source Fxstreet
  • GBP/JPY rebounds from 217.53, keeping bullish structure near highs.
  • RSI flattens in bullish territory, signaling sideways consolidation risk.
  • Break above 218.50 exposes 219.61 and 220.00 resistance.

The GBP/JPY consolidates around 218.20 as the Pound Sterling loses momentum amid the new PM, Andy Burnham, taking office. Fears of a possible intervention by Japanese authorities capped the cross-pair advance, which remains trading near year-to-date (YTD) highs seen on July 15.

GBP/JPY Price Forecast: Technical outlook

The ongoing pullback during the last four trading days stalled near the 217.50 area, at around the low of the day (LOD) of 217.53. Since then, GBP/JPY has bounced and reclaimed the 218.00 level, increasing buyers’ chances of testing higher prices.

The Relative Strength Index (RSI) shows that momentum is bullish, though it has turned flat, suggesting the cross could trade sideways.

For a bullish continuation, GBP/JPY needs to surpass the 218.50 psychological level before 219.00. Once breached, the next stop would be the YTD high of 219.61, ahead of 220.00.

On the downside, a decisive break below the July 21 low of 217.53 opens the path to challenge 217.00. Below lies the April 30 high-turned-support at 216.60, followed by the 50-day Simple Moving Average (SMA) at 215.00.

GBP/JPY Price Chart – Daily
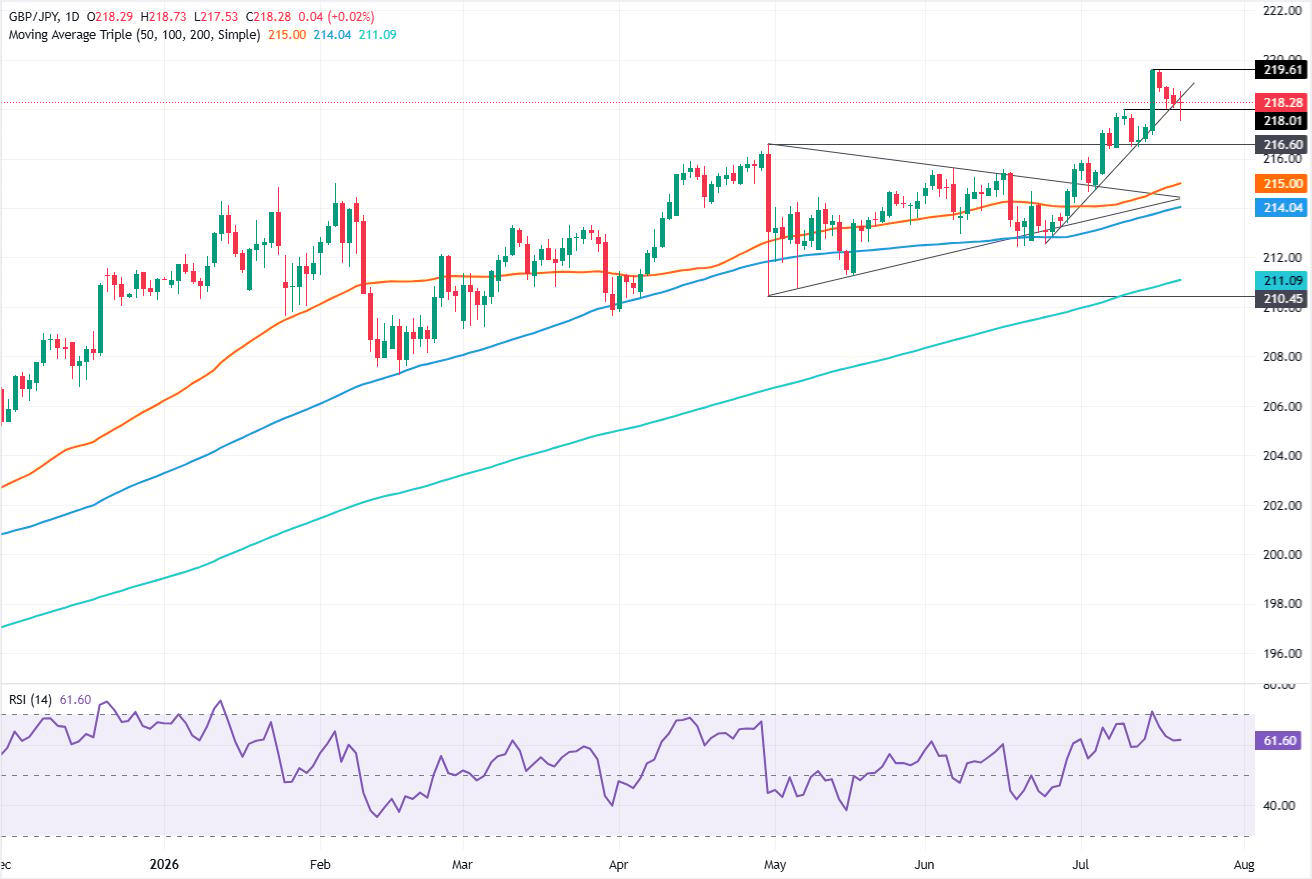
GBP/JPY daily chart

Japanese Yen FAQs

The Japanese Yen (JPY) is one of the world’s most traded currencies. Its value is broadly determined by the performance of the Japanese economy, but more specifically by the Bank of Japan’s policy, the differential between Japanese and US bond yields, or risk sentiment among traders, among other factors.

One of the Bank of Japan’s mandates is currency control, so its moves are key for the Yen. The BoJ has directly intervened in currency markets sometimes, generally to lower the value of the Yen, although it refrains from doing it often due to political concerns of its main trading partners. The BoJ ultra-loose monetary policy between 2013 and 2024 caused the Yen to depreciate against its main currency peers due to an increasing policy divergence between the Bank of Japan and other main central banks. More recently, the gradually unwinding of this ultra-loose policy has given some support to the Yen.

Over the last decade, the BoJ’s stance of sticking to ultra-loose monetary policy has led to a widening policy divergence with other central banks, particularly with the US Federal Reserve. This supported a widening of the differential between the 10-year US and Japanese bonds, which favored the US Dollar against the Japanese Yen. The BoJ decision in 2024 to gradually abandon the ultra-loose policy, coupled with interest-rate cuts in other major central banks, is narrowing this differential.

The Japanese Yen is often seen as a safe-haven investment. This means that in times of market stress, investors are more likely to put their money in the Japanese currency due to its supposed reliability and stability. Turbulent times are likely to strengthen the Yen’s value against other currencies seen as more risky to invest in.

Disclaimer: For information purposes only. Past performance is not indicative of future results.
placeholder
US dollar clings to nine-week lows near 98.4 as Brent nears $100 and the yen hits a seven-month high — five events to watch todayThe dollar is pinned near nine-week lows even after a blockbuster jobs report, as an oil spike toward $100, a surging yen and China's reflation data crowd the driver's seat. Five key events to watch today: Brent at $99.46, USD/JPY at 154, China CPI/PPI, PBOC gold buying, and Thursday's PPI / Friday's CPI ahead of the September 15-16 FOMC.
Author  Eric Nkando
Sep 09, Wed
The dollar is pinned near nine-week lows even after a blockbuster jobs report, as an oil spike toward $100, a surging yen and China's reflation data crowd the driver's seat. Five key events to watch today: Brent at $99.46, USD/JPY at 154, China CPI/PPI, PBOC gold buying, and Thursday's PPI / Friday's CPI ahead of the September 15-16 FOMC.
placeholder
US August CPI lands tonight: after a 5.4% PPI shock, will the Fed hike on September 16?US August PPI came in at 5.4% year-on-year, above the 5.3% consensus, with core PPI at 4.6%. Traders have pushed the odds of a 25bp Fed hike on September 15-16 to around 70%. Tonight's CPI is the last major inflation print before the decision — here is the full calendar, the consensus numbers, and what a hot versus cool reading would mean for the dollar, yields, gold and stocks.
Author  Irene Q.
Sep 11, Fri
US August PPI came in at 5.4% year-on-year, above the 5.3% consensus, with core PPI at 4.6%. Traders have pushed the odds of a 25bp Fed hike on September 15-16 to around 70%. Tonight's CPI is the last major inflation print before the decision — here is the full calendar, the consensus numbers, and what a hot versus cool reading would mean for the dollar, yields, gold and stocks.
placeholder
Brent tests $108 as a key export pipeline stays shut — can the rally clear $110?Brent crude rose 2.55% to $106.97 and WTI 2.32% to $102.30 as a major regional export pipeline remained offline with no restart timeline. Front-month backwardation has widened to $5.53 from $3.84 a week ago, European gas is at its highest since December 2022, and one analyst sees $119.48 if talks stall.
Author  Irene Q.
18 hours ago
Brent crude rose 2.55% to $106.97 and WTI 2.32% to $102.30 as a major regional export pipeline remained offline with no restart timeline. Front-month backwardation has widened to $5.53 from $3.84 a week ago, European gas is at its highest since December 2022, and one analyst sees $119.48 if talks stall.
placeholder
Fed hike odds near 90% into Wednesday's decision — how to trade the dollar, gold and the S&P 500A 0.3% monthly core CPI print has lifted the market-implied probability of a 25bp Fed hike on 16 September to roughly 86.5% ~ 90%, which would be the first increase since July 2023. Here is the decision timeline, the pricing versus the forecasts, both scenarios, and the key levels for the dollar, gold and the S&P 500.
Author  Suzie
17 hours ago
A 0.3% monthly core CPI print has lifted the market-implied probability of a 25bp Fed hike on 16 September to roughly 86.5% ~ 90%, which would be the first increase since July 2023. Here is the decision timeline, the pricing versus the forecasts, both scenarios, and the key levels for the dollar, gold and the S&P 500.
placeholder
Silver Price Forecast: XAG/USD falls to near $63.50 amid Fed hike bets, higher oil pricesSilver price (XAG/USD) loses its gains from the previous day, trading around $63.50 per troy ounce during Asian hours on Monday. Non-yielding Silver is currently facing significant headwinds driven by rising Federal Reserve (Fed) rate-hike expectations for the upcoming September decision.
Author  FXStreet
15 hours ago
Silver price (XAG/USD) loses its gains from the previous day, trading around $63.50 per troy ounce during Asian hours on Monday. Non-yielding Silver is currently facing significant headwinds driven by rising Federal Reserve (Fed) rate-hike expectations for the upcoming September decision.
Related Instrument
goTop
quote