

EUR/USD Price Forecast: Struggles below 1.1600 as sellers maintain control
- EUR/USD trades with a mild downside bias as a modest US Dollar rebound weighs on the Euro.
- The pair struggles to build momentum after failing to sustain a break above the 1.1600 level.
- Technically, bearish pressure persists below key moving averages, with 1.1400 support in focus.
EUR/USD trades with a mild downside bias on Friday as a modest rebound in the US Dollar (USD) weighs on the Euro (EUR), with price action lacking follow-through buying after failing to sustain a break above the 1.1600 mark.
At the time of writing, the pair hovers near 1.1542, down around 0.38% on the day, though it remains on track to close the week in positive territory after two consecutive weekly losses.
Meanwhile, the US Dollar Index (DXY), which tracks the Greenback’s value against a basket of six major currencies, is trading near 99.67, recovering after falling about 1.10% on Thursday.
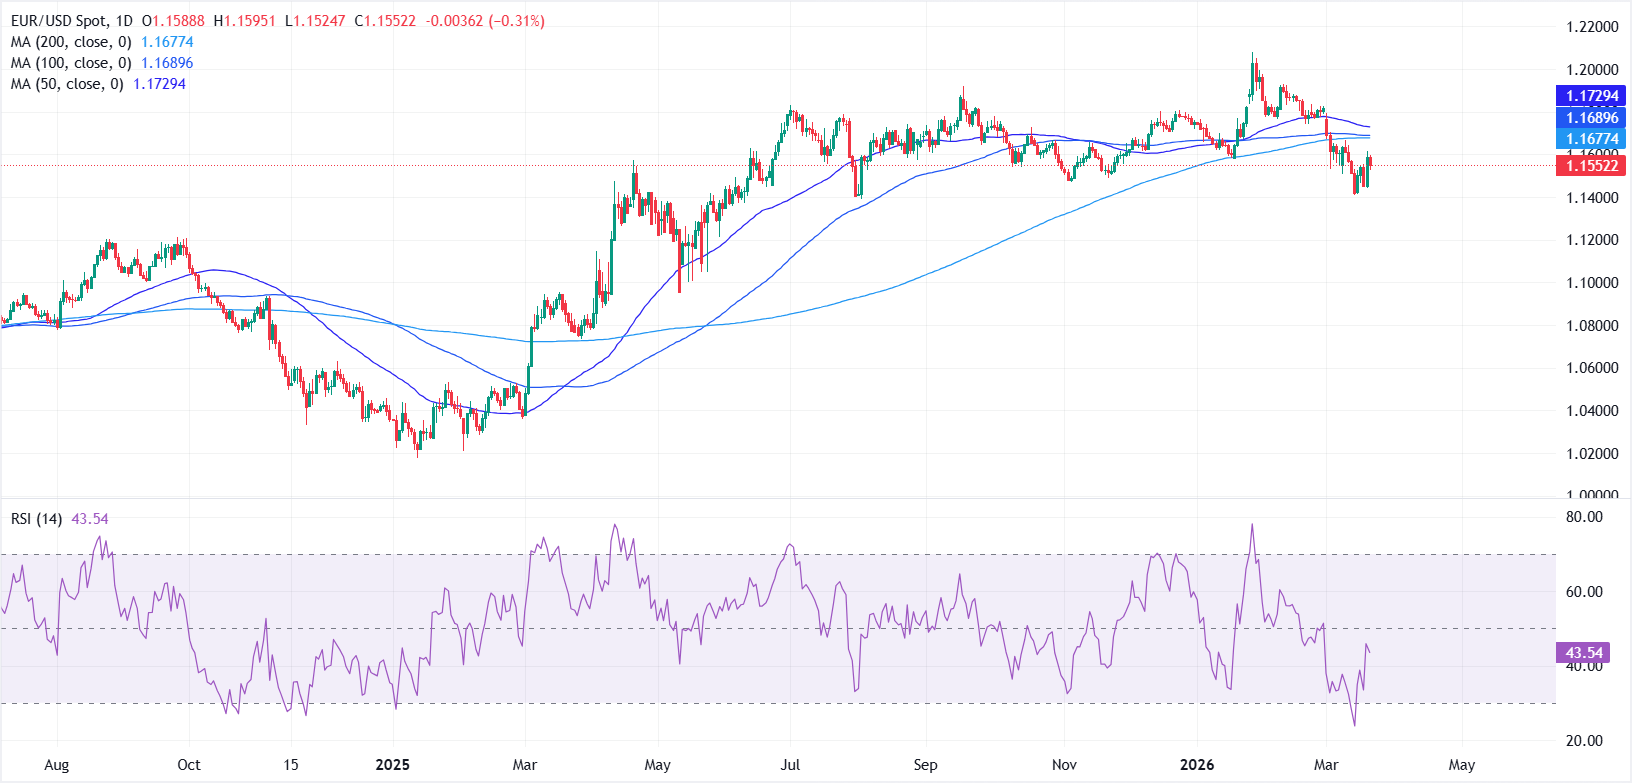
From a technical perspective, the daily chart suggests that EUR/USD maintains a mildly bearish near-term bias as the pair continues to trade below the 50-day, 100-day, and 200-day Simple Moving Averages (SMAs).
Price action continues to respect a sequence of lower highs, highlighting persistent selling pressure and keeping the broader corrective phase from the 1.2000 area in play.
Meanwhile, momentum remains subdued with the 14-day Relative Strength Index (RSI) around 43, indicating lingering downside pressure after the recent oversold dip below 30, but without strong trend acceleration.
On the upside, the 1.1600 handle serves as immediate resistance, ahead of the key confluence zone around 1.1670-1.1730.
A decisive break above this region would negate the current bearish structure and shift the bias back to bullish, opening the door toward the February highs near 1.1900, with a possible extension beyond the 1.2000 psychological level.
On the downside, immediate support is seen near the 1.1400 mark. A break below this level could trigger a deeper corrective move toward the 1.1300-1.1200 region.
US Dollar Price Today
The table below shows the percentage change of US Dollar (USD) against listed major currencies today. US Dollar was the strongest against the Japanese Yen.
| USD | EUR | GBP | JPY | CAD | AUD | NZD | CHF | |
|---|---|---|---|---|---|---|---|---|
| USD | 0.29% | 0.87% | 0.96% | -0.08% | 0.69% | 0.53% | -0.01% | |
| EUR | -0.29% | 0.57% | 0.66% | -0.37% | 0.40% | 0.22% | -0.29% | |
| GBP | -0.87% | -0.57% | 0.08% | -0.95% | -0.17% | -0.35% | -0.86% | |
| JPY | -0.96% | -0.66% | -0.08% | -1.01% | -0.26% | -0.41% | -0.93% | |
| CAD | 0.08% | 0.37% | 0.95% | 1.01% | 0.76% | 0.61% | 0.08% | |
| AUD | -0.69% | -0.40% | 0.17% | 0.26% | -0.76% | -0.16% | -0.69% | |
| NZD | -0.53% | -0.22% | 0.35% | 0.41% | -0.61% | 0.16% | -0.53% | |
| CHF | 0.00% | 0.29% | 0.86% | 0.93% | -0.08% | 0.69% | 0.53% |
The heat map shows percentage changes of major currencies against each other. The base currency is picked from the left column, while the quote currency is picked from the top row. For example, if you pick the US Dollar from the left column and move along the horizontal line to the Japanese Yen, the percentage change displayed in the box will represent USD (base)/JPY (quote).
Recommended Articles


