

3 Altcoins To Watch This Weekend | March 21 – 22
Altcoins are drawing attention as the weekend approaches, with coins showing chart structures worth monitoring closely. With the broader market in flux, price action across smaller-cap tokens often accelerates during low-liquidity periods.
Thus, BeInCrypto has analyzed three altcoins that the investors should watch in the coming weekend.
Cystic Token (CYS)
Cysic Token (CYS) is trading at $0.502 on the daily chart, posting a 6.730% loss on the session with a high of $0.532 and a low of $0.465. Price sits just above the 0.786 Fibonacci level at $0.482, which has capped downside on prior pullbacks. The Money Flow Index reads 70.450, approaching overbought territory. Volume is 150K.
The MFI at 70.450 is rising steadily toward the 80 overbought threshold, suggesting accumulation pressure remains intact beneath the surface. A recovery above the 1.0 Fibonacci level at $0.532 would open the path toward $0.588, the 1.236 extension level. The all-time high at $0.600 sits just above as the next significant ceiling.
Want more token insights like this? Sign up for Editor Harsh Notariya’s Daily Crypto Newsletter here.
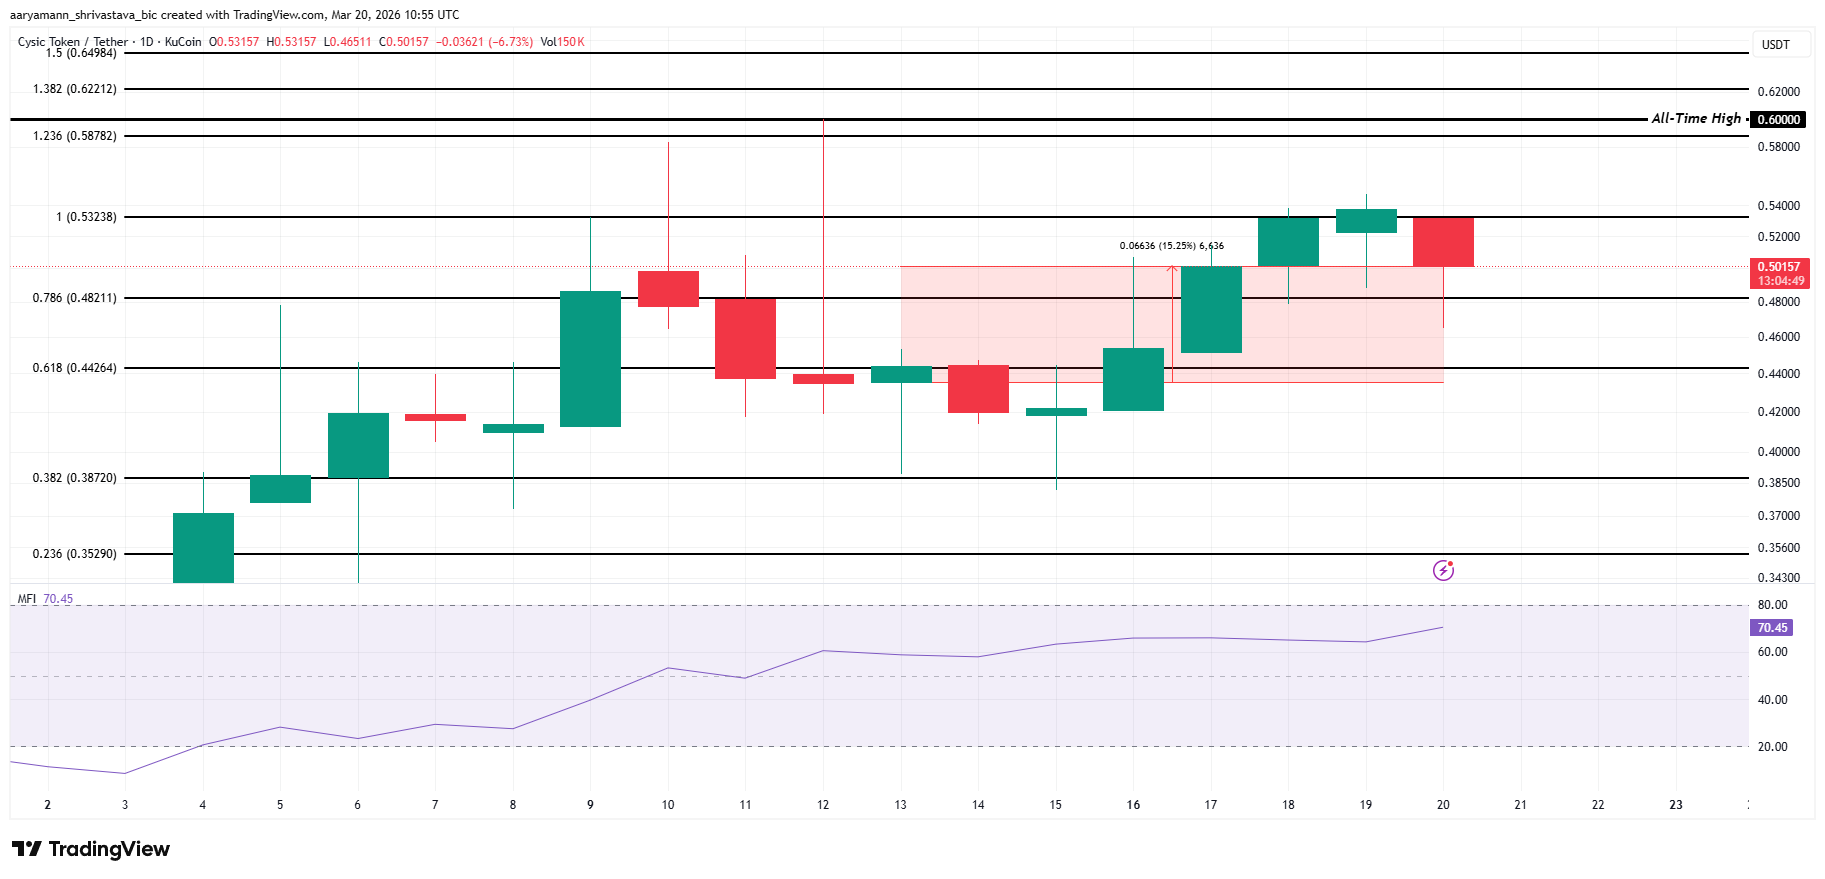 CYS Price Analysis. Source: TradingView
A daily close below $0.482 would invalidate the bullish case and expose the 0.618 Fibonacci level at $0.443. Continued selling through that zone shifts focus to $0.387, the 0.382 level that provided support in early March. Those two levels represent the binary floor scenario if buyers fail to defend the current price.
Siren (SIREN)
SIREN (SIR) is trading at $0.919 on the daily chart, up 17.110% on the session with a high of $0.937 and a low of $0.778. Volume stands at 622.380K, a sharp uptick reflecting strong participation. Price is pressing against the 1.786 Fibonacci level at $0.936, a level marked with a red horizontal line. The CMF reads 0.030, crossing above zero after a prolonged negative stretch.
The CMF turning positive after weeks below the zero line confirms fresh capital entering the market. Price trading above the 1.5 Fibonacci level at $0.816 and pushing into $0.936 resistance signals momentum favoring continuation. A break above $0.936 targets the 2.0 extension at $1.026, with the all-time high at $0.988 acting as an intermediate ceiling.
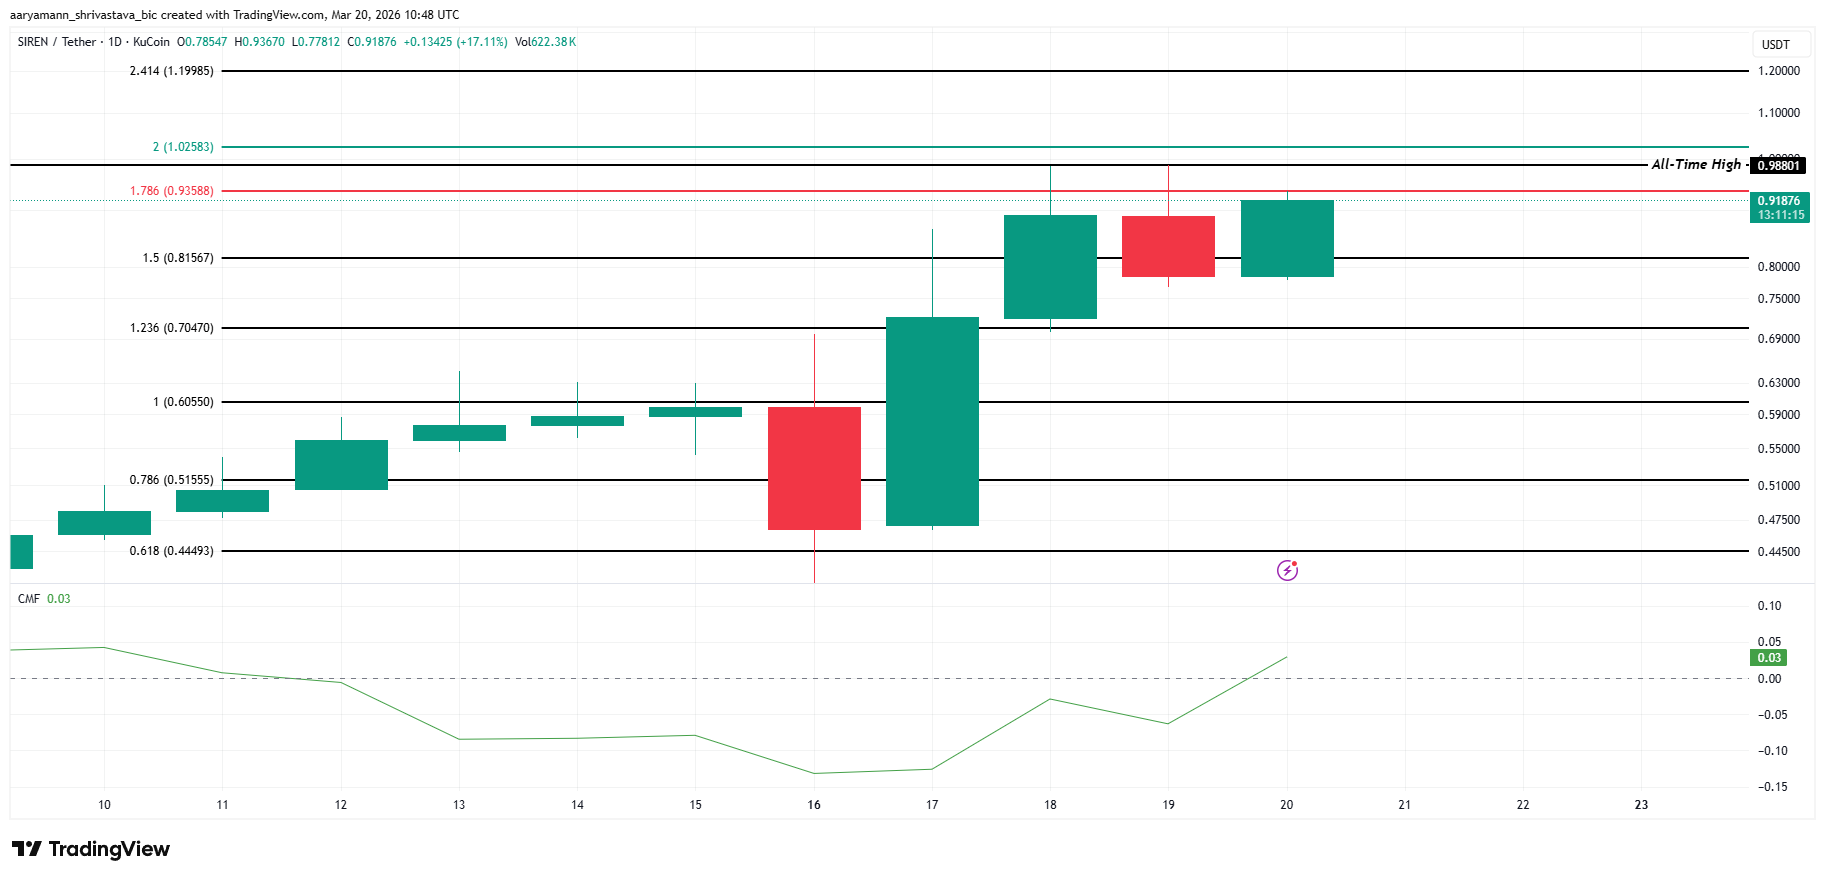 SIREN Price Analysis. Source: TradingView
A failure to close above $0.936 and a reversal below $0.816 would invalidate the bullish thesis. That scenario would pull SIR back toward the 1.236 level at $0.705, the prior consolidation zone before the breakout candle on March 17. Holding $0.816 on any pullback remains the key condition for bulls.
Artificial Superintelligence Alliance (FET)
Fetch.AI (FET) is trading at $0.228 on the daily chart, up 7.150% on the session with a high of $0.243 and a low of $0.212. Volume reads 62.700M. Price is consolidating just above the 1.236 Fibonacci level at $0.232, after a sharp rally from the 0.236 level at $0.153. The EMA sits at $0.189, well below the current price, confirming the trend shift since early March.
FET holding above the 1.236 level at $0.232 with the EMA rising and the Correlation Coefficient (CC) reading at 0.910 near its upper range indicates strong trend alignment. The 1.5 Fibonacci level at $0.253 is the next target, followed by the 1.786 extension at $0.276, marked by a red resistance line. Both levels are visible and untested.
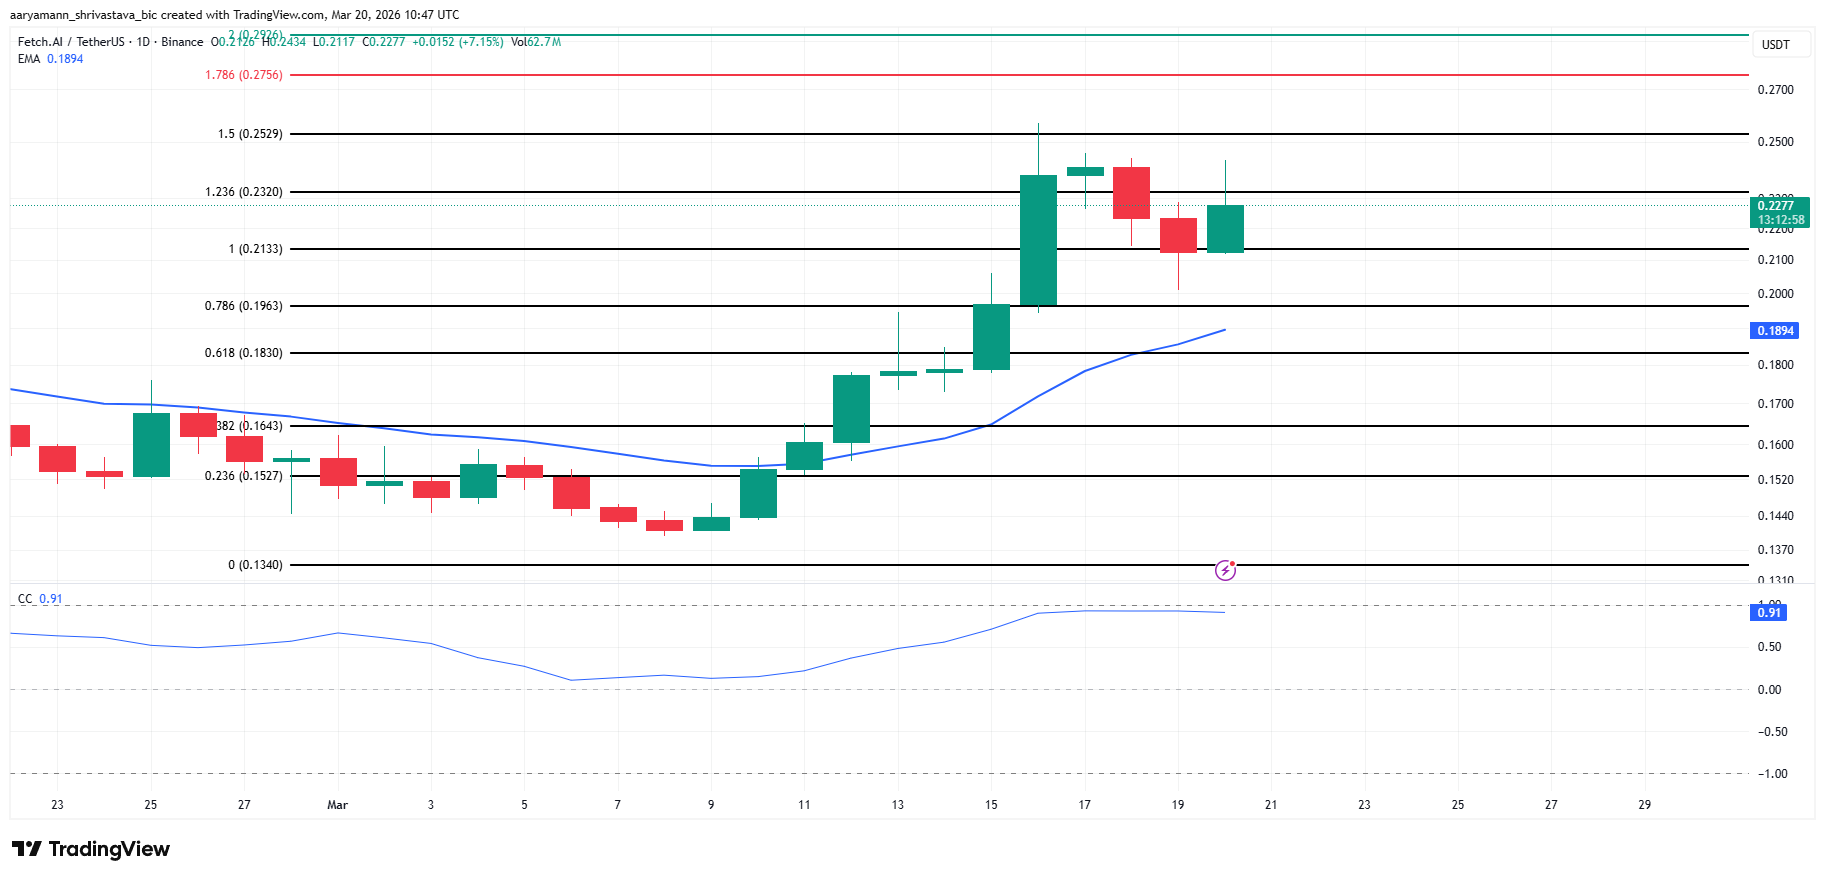 FET Price Analysis. Source: TradingView
A daily close below the 1.236 level at $0.232 would shift the structure bearish and bring the 1.0 Fibonacci level at $0.213 into focus as immediate support. A breach of that floor exposes $0.196, the 0.786 level. Price reclaiming $0.232 on a close basis remains the condition that keeps the bullish structure intact.
Recommended Articles


