

WTI Futures (USOIL-F) Is down 4.84% on Sep 17: Key Drivers to Watch

Source Tradingkey

WTI Futures (USOIL-F) is down 4.84% at Sep 17 20:00(ET), now at $97.02, with a 7-day down of 6.60%.
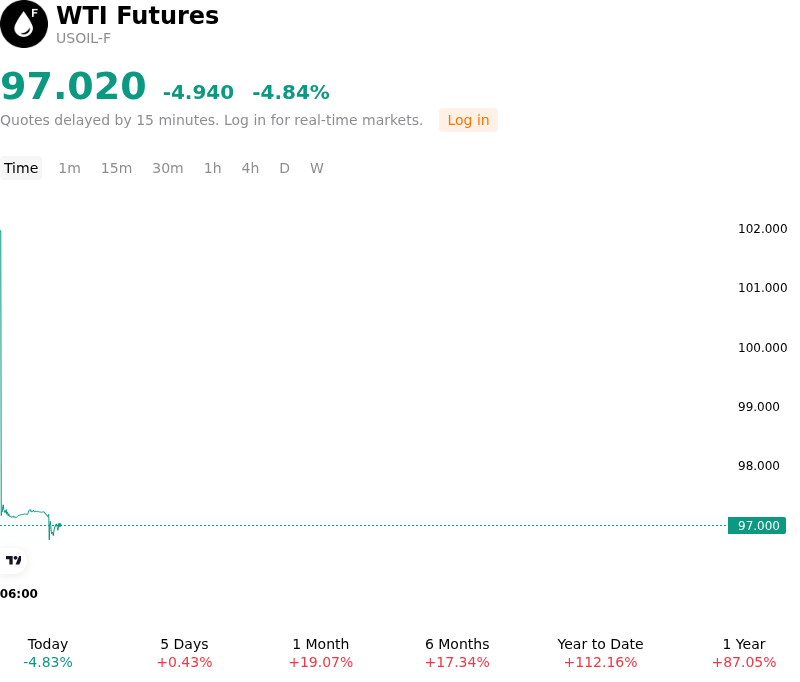
SummaryOverview

What is driving WTI Futures (USOIL-F)’s stock price down today?

The sharp decline in U.S. crude oil futures was primarily driven by domestic inventory data that provided temporary relief to tight market sentiment, prompting profit-taking after a sustained multi-session rally. The Energy Information Administration reported a smaller-than-anticipated drop in U.S. commercial crude stockpiles, while refined products saw unexpected inventory builds in both gasoline and distillates. A marginal decline in U.S. refinery utilization rates further signaled a brief softening in domestic crude demand. Although global supply availability remains constrained by geopolitical disruptions and pipeline shut-ins, the smaller inventory draw allowed short-term market participants to unwind extended long positions.

Macroeconomic pressures further exacerbated the selling pressure throughout the session. Tightening monetary policy expectations and a firmer U.S. dollar created strong headwinds for energy commodities. Rising U.S. Treasury yields strengthened the greenback, making dollar-denominated crude more expensive for foreign buyers while raising borrowing costs that could curb broader economic growth. Concerns over high energy prices weighing on global industrial activity and refined product demand led institutional investors to recalibrate their near-term pricing expectations.

This downward price action reflects a temporary, event-driven liquidity correction within a broader structurally tight market environment. While immediate inventory data and macro headwinds pressured sentiment, global commercial stockpiles remain well below historical averages, keeping physical supply balances fragile. Investors continue to closely monitor regional production bottlenecks, OPEC supply discipline, domestic refinery run rates, and central bank guidance to gauge the sustainability of energy price trends.

Technical Analysis of WTI Futures (USOIL-F)

Technically, WTI Futures (USOIL-F) shows a MACD (12,26,9) value of 1.281, indicating a buy signal. The RSI at 57.387 suggests neutral condition and the Williams %R at 43.053 suggests buy condition. Please monitor closely.
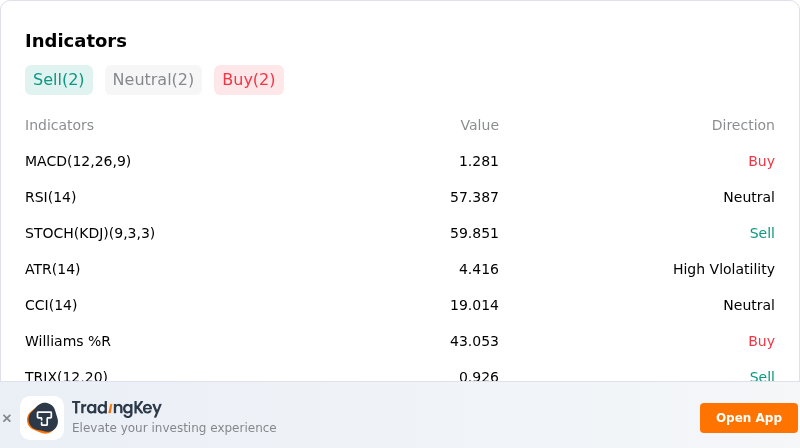
IndicatorAnalysis

More details about WTI Futures (USOIL-F)

Recent Events and Risks:

  • Bearish U.S. Inventory Build and Weak Fuel Demand: Industry and government reports from the API and EIA showed weaker-than-expected U.S. commercial crude draws alongside unexpected builds in gasoline and distillate stockpiles, highlighting sluggish domestic refining intake and weak seasonal fuel consumption.
  • Unwinding Geopolitical Risk Premiums: Downside pressure on WTI futures accelerated as concerns over Middle Eastern supply choke points eased, driven by reports of stable daily tanker transit through key waterways and efforts to restore regional pipeline flows, triggering profit-taking and long liquidation.
  • Slowing Chinese Refinery Runs and Import Drag: Margins and industrial demand across China remain under pressure, prompting domestic refiners to reduce crude run rates and rely on existing commercial stockpiles, which threatens to create a seaborne crude surplus over the near term.
  • U.S. Dollar Strength and Macro Headwinds: A rebound in the U.S. Dollar Index alongside broader macro risk-off sentiment in equity and commodity markets is raising foreign buyer costs for dollar-denominated USOIL contracts, adding strong intraday selling pressure.
Disclaimer: For information purposes only. Past performance is not indicative of future results.
placeholder
Fed hike odds near 90% into Wednesday's decision — how to trade the dollar, gold and the S&P 500A 0.3% monthly core CPI print has lifted the market-implied probability of a 25bp Fed hike on 16 September to roughly 86.5% ~ 90%, which would be the first increase since July 2023. Here is the decision timeline, the pricing versus the forecasts, both scenarios, and the key levels for the dollar, gold and the S&P 500.
Author  Suzie
Sep 14, Mon
A 0.3% monthly core CPI print has lifted the market-implied probability of a 25bp Fed hike on 16 September to roughly 86.5% ~ 90%, which would be the first increase since July 2023. Here is the decision timeline, the pricing versus the forecasts, both scenarios, and the key levels for the dollar, gold and the S&P 500.
placeholder
Gold falls below $4,300 as higher US yields bolster Fed rate hike betsGold price (XAU/USD) tumbles to near $4,295 during the early Asian session on Tuesday. The precious metal faces some selling pressure as rising bond yields and surging energy prices strengthen expectations that the US Federal Reserve (Fed) will raise interest rates this week. 
Author  FXStreet
Sep 15, Tue
Gold price (XAU/USD) tumbles to near $4,295 during the early Asian session on Tuesday. The precious metal faces some selling pressure as rising bond yields and surging energy prices strengthen expectations that the US Federal Reserve (Fed) will raise interest rates this week. 
placeholder
【Daily Brief】10-year Treasury yield briefly tops 5%, S&P 500 slips to 7,602 and the dollar firms at 99.3 as the Fed's decision eve beginsThe 10-year Treasury yield touched 5.014% on Monday — its first print above 5% since October 2023 — while the S&P 500 closed 0.48% lower at 7,619.98 and the dollar index firmed to 99.3. Here is the full market wrap ahead of Wednesday's FOMC decision, the dot plot and the August retail sales report, plus today's CLARITY Act Senate vote.
Author  Irene Q.
Sep 15, Tue
The 10-year Treasury yield touched 5.014% on Monday — its first print above 5% since October 2023 — while the S&P 500 closed 0.48% lower at 7,619.98 and the dollar index firmed to 99.3. Here is the full market wrap ahead of Wednesday's FOMC decision, the dot plot and the August retail sales report, plus today's CLARITY Act Senate vote.
placeholder
Silver breaks $64 as precious metals rebound — can gold hold the $4,280 line into the Fed decision?Silver has climbed back above $64 an ounce for the first time this week, leading a broad rebound across precious metals hours before the Federal Reserve delivers what is expected to be its first rate hike since 2023. Spot silver was last at $64.64, up 1.49% on the day, while gold reclaimed $4,300 and platinum and palladium both advanced. The question now is whether the bounce is a genuine turn — or a pause before the Fed's dot plot decides the next move.
Author  Suzie
16 hours ago
Silver has climbed back above $64 an ounce for the first time this week, leading a broad rebound across precious metals hours before the Federal Reserve delivers what is expected to be its first rate hike since 2023. Spot silver was last at $64.64, up 1.49% on the day, while gold reclaimed $4,300 and platinum and palladium both advanced. The question now is whether the bounce is a genuine turn — or a pause before the Fed's dot plot decides the next move.
placeholder
Bitcoin falls below $75,000 as the CLARITY Act fails in the Senate — what the vote means for cryptoThe US Senate blocked the Digital Asset Market CLARITY Act in a 49-50 procedural vote, sending Bitcoin briefly below $75,000 — its biggest one-day drop since June. Ethereum fell more than 8%, Coinbase slid 10% and $75 billion of crypto market value evaporated. Here is what the vote was, why it failed, and the levels that matter now.
Author  Suzie
16 hours ago
The US Senate blocked the Digital Asset Market CLARITY Act in a 49-50 procedural vote, sending Bitcoin briefly below $75,000 — its biggest one-day drop since June. Ethereum fell more than 8%, Coinbase slid 10% and $75 billion of crypto market value evaporated. Here is what the vote was, why it failed, and the levels that matter now.
goTop
quote