

ICICI Bank Ltd Stock (IBN) Opened Down by 3.08% on Sep 15: Facts Behind the Movement

Source Tradingkey

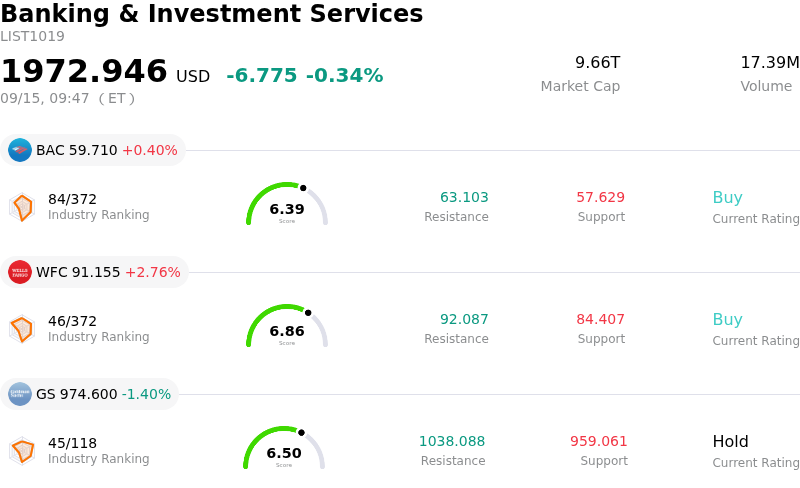
ICICI Bank Ltd (IBN) opened down by 3.08%. The Banking & Investment Services sector is down by 0.34%. The company underperformed the industry. Top 3 stocks by turnover in the sector: Bank of America Corp (BAC) up 0.49%; Wells Fargo & Co (WFC) up 2.76%; Goldman Sachs Group Inc (GS) down 1.40%.
SummaryOverview

What is driving ICICI Bank Ltd (IBN)’s stock price down today?

ICICI Bank American Depositary Shares experienced downward pressure during today's trading session, driven primarily by broader macroeconomic headwinds affecting emerging market financial assets. A sharp firming in global crude oil prices, coupled with elevated U.S. Treasury yields and a strong U.S. dollar, has renewed risk-off sentiment among global market participants. This macro climate has accelerated net foreign portfolio investor outflows from Indian equities. As one of the most liquid international gateways to the Indian financial sector, ICICI Bank's ADR naturally felt the impact of broader institutional capital reallocation.

In addition to top-down capital flows, industry dynamics within the Indian banking ecosystem continue to influence short-term sentiment. While domestic credit demand remains relatively resilient, persistent deposit competition and elevated funding costs have raised investor concerns regarding near-term net interest margin compression. Market participants are exercising tactical caution across major private-sector lenders as they assess the balance between deposit mobilization costs and loan portfolio yields in an evolving interest rate environment.

From a technical perspective, the intraday volatility was further amplified by profit-taking and automated institutional selling as the equity drifted below key technical support levels. Despite these short-term market pressures, ICICI Bank's long-term fundamental profile remains well-anchored. Strong capital adequacy, sound asset quality metrics, and ongoing digital infrastructure investments provide a solid framework for the bank to navigate transient macroeconomic turbulence.

Technical Analysis of ICICI Bank Ltd (IBN)

Technically, ICICI Bank Ltd (IBN) shows a MACD (12,26,9) value of -0.395, indicating a neutral signal. The RSI at 36.668 suggests neutral condition and the Williams %R at 97.275 suggests oversold condition. Please monitor closely.

Fundamental Analysis of ICICI Bank Ltd (IBN)

ICICI Bank Ltd (IBN) is in the Banking & Investment Services industry. Its latest annual revenue is $25.32B, ranking 21 in the industry. The net profit is $6.14B, ranking 21 in the industry. Company Profile

Over the past month, multiple analysts have rated the company as Buy, with an average price target of $36.33, a high of $38.00, and a low of $35.30.

More details about ICICI Bank Ltd (IBN)

Company Specific Risks:

  • Persistent Downward Price Momentum: ICICI Bank has suffered a multi-day decline, dropping nearly 2% intraday as heavy selling across Indian financial sector constituents and broader emerging market equities dragged down trading sentiment.
  • Net Interest Margin Compression Risks: Expectation of potential monetary policy easing and interest rate cuts by the Reserve Bank of India, combined with rising interest expenses from substantial senior debt obligations, threatens to narrow the bank's net interest margins.
  • Regulatory Oversight and Governance Compliance: Heightened regulatory scrutiny by financial authorities—illustrated by SEBI warnings over foreign portfolio investor repatriation compliance and reporting delays—highlights lingering operational and oversight vulnerabilities.
  • ADR Foreign Exchange and Capital Outflow Sensitivity: As an American Depositary Receipt, IBN remains vulnerable to Indian Rupee depreciation against the US Dollar and systemic foreign institutional capital flight during broader global market sell-offs.
Disclaimer: For information purposes only. Past performance is not indicative of future results.
placeholder
US August CPI lands tonight: after a 5.4% PPI shock, will the Fed hike on September 16?US August PPI came in at 5.4% year-on-year, above the 5.3% consensus, with core PPI at 4.6%. Traders have pushed the odds of a 25bp Fed hike on September 15-16 to around 70%. Tonight's CPI is the last major inflation print before the decision — here is the full calendar, the consensus numbers, and what a hot versus cool reading would mean for the dollar, yields, gold and stocks.
Author  Irene Q.
Sep 11, Fri
US August PPI came in at 5.4% year-on-year, above the 5.3% consensus, with core PPI at 4.6%. Traders have pushed the odds of a 25bp Fed hike on September 15-16 to around 70%. Tonight's CPI is the last major inflation print before the decision — here is the full calendar, the consensus numbers, and what a hot versus cool reading would mean for the dollar, yields, gold and stocks.
placeholder
Brent tests $108 as a key export pipeline stays shut — can the rally clear $110?Brent crude rose 2.55% to $106.97 and WTI 2.32% to $102.30 as a major regional export pipeline remained offline with no restart timeline. Front-month backwardation has widened to $5.53 from $3.84 a week ago, European gas is at its highest since December 2022, and one analyst sees $119.48 if talks stall.
Author  Irene Q.
Yesterday 07: 16
Brent crude rose 2.55% to $106.97 and WTI 2.32% to $102.30 as a major regional export pipeline remained offline with no restart timeline. Front-month backwardation has widened to $5.53 from $3.84 a week ago, European gas is at its highest since December 2022, and one analyst sees $119.48 if talks stall.
placeholder
Fed hike odds near 90% into Wednesday's decision — how to trade the dollar, gold and the S&P 500A 0.3% monthly core CPI print has lifted the market-implied probability of a 25bp Fed hike on 16 September to roughly 86.5% ~ 90%, which would be the first increase since July 2023. Here is the decision timeline, the pricing versus the forecasts, both scenarios, and the key levels for the dollar, gold and the S&P 500.
Author  Suzie
Yesterday 07: 49
A 0.3% monthly core CPI print has lifted the market-implied probability of a 25bp Fed hike on 16 September to roughly 86.5% ~ 90%, which would be the first increase since July 2023. Here is the decision timeline, the pricing versus the forecasts, both scenarios, and the key levels for the dollar, gold and the S&P 500.
placeholder
Silver Price Forecast: XAG/USD falls to near $63.50 amid Fed hike bets, higher oil pricesSilver price (XAG/USD) loses its gains from the previous day, trading around $63.50 per troy ounce during Asian hours on Monday. Non-yielding Silver is currently facing significant headwinds driven by rising Federal Reserve (Fed) rate-hike expectations for the upcoming September decision.
Author  FXStreet
Yesterday 10: 37
Silver price (XAG/USD) loses its gains from the previous day, trading around $63.50 per troy ounce during Asian hours on Monday. Non-yielding Silver is currently facing significant headwinds driven by rising Federal Reserve (Fed) rate-hike expectations for the upcoming September decision.
placeholder
【Daily Brief】10-year Treasury yield briefly tops 5%, S&P 500 slips to 7,602 and the dollar firms at 99.3 as the Fed's decision eve beginsThe 10-year Treasury yield touched 5.014% on Monday — its first print above 5% since October 2023 — while the S&P 500 closed 0.48% lower at 7,619.98 and the dollar index firmed to 99.3. Here is the full market wrap ahead of Wednesday's FOMC decision, the dot plot and the August retail sales report, plus today's CLARITY Act Senate vote.
Author  Irene Q.
6 hours ago
The 10-year Treasury yield touched 5.014% on Monday — its first print above 5% since October 2023 — while the S&P 500 closed 0.48% lower at 7,619.98 and the dollar index firmed to 99.3. Here is the full market wrap ahead of Wednesday's FOMC decision, the dot plot and the August retail sales report, plus today's CLARITY Act Senate vote.
goTop
quote