

WTI Futures (USOIL-F) Is up 2.03% on Sep 15: Is the Market Repricing It?

Source Tradingkey

WTI Futures (USOIL-F) is up 2.03% at Sep 15 05:20(ET), now at $103.88, with a 7-day up of 10.28%.
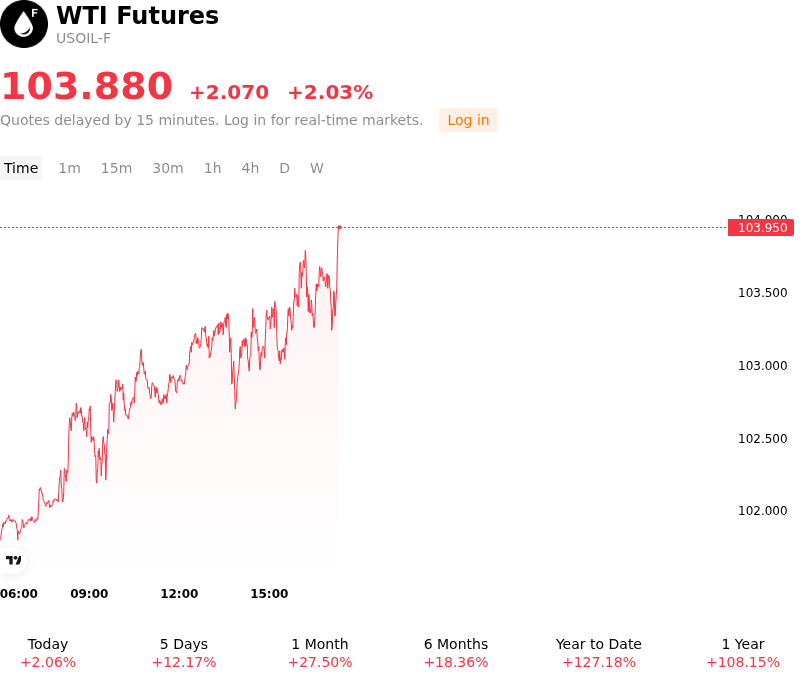
SummaryOverview

What is driving WTI Futures (USOIL-F)’s stock price up today?

The upward momentum in West Texas Intermediate crude oil futures was primarily driven by severe supply-side disruptions and escalating geopolitical friction in the Middle East. Energy markets rapidly repriced near-term export availability following the sustained outage of Saudi Arabia’s East-West Pipeline, a critical infrastructure artery designed to transport crude directly to Red Sea ports. Infrastructure damage blocked substantial daily volumes from entering international markets, eroding global supply buffers and forcing market participants to recalibrate available export capacity.

Compounding these inland logistics disruptions, physical transit through the Strait of Hormuz contracted sharply as commercial vessel traffic slowed under heightened security threats and elevated maritime insurance premiums. The simultaneous pressure on both primary export chokepoints and secondary bypass routes severely constrained physical crude flows out of the Persian Gulf. As a result, institutional investors aggressively built a higher geopolitical risk premium into the front end of the curve, prioritizing immediate supply security over broader economic demand concerns.

On the inventory front, price gains were reinforced by expectations of tightening supply balances in the Western Hemisphere. Forecasts pointing to further drawdowns in commercial crude inventories, alongside historic lows in strategic reserves, provided additional downside protection for benchmark futures.

While macroeconomic uncertainty and structural demand forecasts continue to present medium-term headwinds, the immediate concentration of physical supply risks and transit bottlenecks across key export corridors remains the central driver of price action. Investors continue to monitor infrastructure restoration timelines and shipping traffic metrics to assess whether current price levels reflect a temporary risk-off spike or an extended physical deficit.

Technical Analysis of WTI Futures (USOIL-F)

Technically, WTI Futures (USOIL-F) shows a MACD (12,26,9) value of 2.761, indicating a buy signal. The RSI at 72.282 suggests buy condition and the Williams %R at 5.192 suggests overbought condition. Please monitor closely.
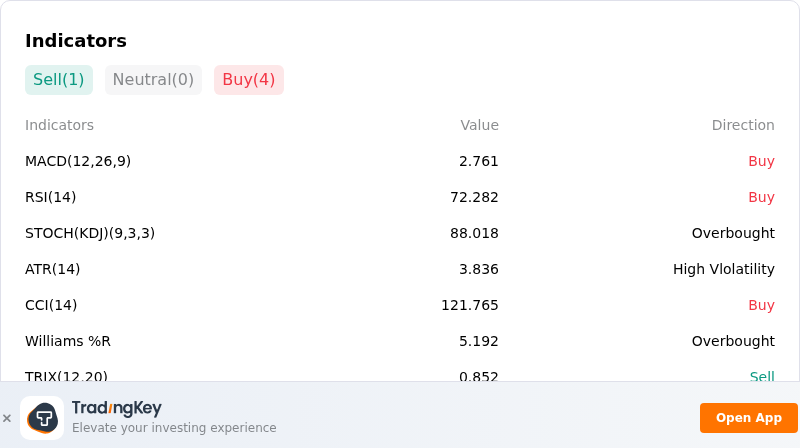
IndicatorAnalysis

More details about WTI Futures (USOIL-F)

Recent Events and Risks:

  • Demand Destruction & Macro Consumption Headwinds: Prominent energy forecasting agencies, including the IEA and OPEC, have recently downgraded global oil demand growth expectations, citing sustained elevated fuel prices, declining US consumer sentiment, and slowing industrial consumption across major Asian and European economies.
  • Easing Geopolitical Risk Premium: Market sentiment has faced intraday downward pressure following reports that significant crude traffic continues through vital maritime corridors and potential diplomatic channels remain open, prompting traders to unwind defensive geopolitical risk premiums.
  • Technical Exhaustion & Positioning Unwind: WTI crude futures experienced a sharp pullback after failing to sustain gains above multi-month resistance around $104.90, triggering bearish RSI divergence and MACD crossovers that are driving algorithmic long liquidation and short-term profit-taking.
  • Medium-Term Supply Glut Projections: Major institutional commodity strategists and federal energy outlooks continue to highlight long-term market oversupply risks driven by expanding non-OPEC liquids output in the Americas, creating persistent headwind pressures on the forward futures curve.
Disclaimer: For information purposes only. Past performance is not indicative of future results.
placeholder
US August CPI lands tonight: after a 5.4% PPI shock, will the Fed hike on September 16?US August PPI came in at 5.4% year-on-year, above the 5.3% consensus, with core PPI at 4.6%. Traders have pushed the odds of a 25bp Fed hike on September 15-16 to around 70%. Tonight's CPI is the last major inflation print before the decision — here is the full calendar, the consensus numbers, and what a hot versus cool reading would mean for the dollar, yields, gold and stocks.
Author  Irene Q.
Sep 11, Fri
US August PPI came in at 5.4% year-on-year, above the 5.3% consensus, with core PPI at 4.6%. Traders have pushed the odds of a 25bp Fed hike on September 15-16 to around 70%. Tonight's CPI is the last major inflation print before the decision — here is the full calendar, the consensus numbers, and what a hot versus cool reading would mean for the dollar, yields, gold and stocks.
placeholder
Brent tests $108 as a key export pipeline stays shut — can the rally clear $110?Brent crude rose 2.55% to $106.97 and WTI 2.32% to $102.30 as a major regional export pipeline remained offline with no restart timeline. Front-month backwardation has widened to $5.53 from $3.84 a week ago, European gas is at its highest since December 2022, and one analyst sees $119.48 if talks stall.
Author  Irene Q.
Yesterday 07: 16
Brent crude rose 2.55% to $106.97 and WTI 2.32% to $102.30 as a major regional export pipeline remained offline with no restart timeline. Front-month backwardation has widened to $5.53 from $3.84 a week ago, European gas is at its highest since December 2022, and one analyst sees $119.48 if talks stall.
placeholder
Fed hike odds near 90% into Wednesday's decision — how to trade the dollar, gold and the S&P 500A 0.3% monthly core CPI print has lifted the market-implied probability of a 25bp Fed hike on 16 September to roughly 86.5% ~ 90%, which would be the first increase since July 2023. Here is the decision timeline, the pricing versus the forecasts, both scenarios, and the key levels for the dollar, gold and the S&P 500.
Author  Suzie
Yesterday 07: 49
A 0.3% monthly core CPI print has lifted the market-implied probability of a 25bp Fed hike on 16 September to roughly 86.5% ~ 90%, which would be the first increase since July 2023. Here is the decision timeline, the pricing versus the forecasts, both scenarios, and the key levels for the dollar, gold and the S&P 500.
placeholder
Silver Price Forecast: XAG/USD falls to near $63.50 amid Fed hike bets, higher oil pricesSilver price (XAG/USD) loses its gains from the previous day, trading around $63.50 per troy ounce during Asian hours on Monday. Non-yielding Silver is currently facing significant headwinds driven by rising Federal Reserve (Fed) rate-hike expectations for the upcoming September decision.
Author  FXStreet
Yesterday 10: 37
Silver price (XAG/USD) loses its gains from the previous day, trading around $63.50 per troy ounce during Asian hours on Monday. Non-yielding Silver is currently facing significant headwinds driven by rising Federal Reserve (Fed) rate-hike expectations for the upcoming September decision.
placeholder
【Daily Brief】10-year Treasury yield briefly tops 5%, S&P 500 slips to 7,602 and the dollar firms at 99.3 as the Fed's decision eve beginsThe 10-year Treasury yield touched 5.014% on Monday — its first print above 5% since October 2023 — while the S&P 500 closed 0.48% lower at 7,619.98 and the dollar index firmed to 99.3. Here is the full market wrap ahead of Wednesday's FOMC decision, the dot plot and the August retail sales report, plus today's CLARITY Act Senate vote.
Author  Irene Q.
3 hours ago
The 10-year Treasury yield touched 5.014% on Monday — its first print above 5% since October 2023 — while the S&P 500 closed 0.48% lower at 7,619.98 and the dollar index firmed to 99.3. Here is the full market wrap ahead of Wednesday's FOMC decision, the dot plot and the August retail sales report, plus today's CLARITY Act Senate vote.
goTop
quote