

Altcoins to watch this week: UNI, SUI eye double-digit gains as momentum builds

- Iran Situation Rekindles Threat of War. Bitcoin Price Decline Accelerates, $75,000 Geopolitical Defense Line Faces Test
- WTI declines below $102.00 after Trump says he called off Iran attacks
- Gold falls below $4,500 on rising global rate hike bets
- Nvidia Earnings Approach: Can It Drive a Nasdaq Rebound? What Should Investors Watch Most?
- Euro softens to near 1.1600 on US–Iran tensions
- Australian Dollar softens to near 0.7200 as Trump and Xi set for second day of talks

Uniswap price approaches a key resistance level at $7.38 which, if overcome, could lead to a potential rally.
Sui price hovers around $3.37 on Tuesday after finding support around a key level last week.
On-chain data for UNI and SUI shows Spot Taker CVD and funding rates are positive, signaling buy-side dominance.
Altcoins Uniswap (UNI) and Sui (SUI) are gaining traction this week, showing signs of potential double-digit gains. UNI is approaching a key technical barrier, while SUI has rebounded after testing crucial levels. On-chain data for both altcoins shows that Spot Taker CVD and funding rates are positive, signaling buy-side dominance.
Uniswap and Sui bulls take control of the momentum
CryptoQuant data, as shown in the graph below, highlights buying pressure on UNI and SUI. The Taker CVD (Cumulative Volume Delta) for both altcoins has been positive and has increased since early May for UNI and since early June for SUI.
This indicator measures the cumulative difference between market buy and sell volumes over a three-month period. When 90-day CVD is positive and increasing, it suggests the Taker Buy Dominant Phase, while a negative and decreasing value indicates the Taker Sell Dominant Phase.
-1749541665524.png)
UNI Spot Taker CVD chart. Source: CryptoQuant
-1749541703973.png)
Sui Spot Taker CVD chart. Source: CryptoQuantmetrics
Coinglass’s OI-Weighted Funding Rate data for both altcoins also shows that the number of traders betting that the price of UNI and SUI will slide further is lower than that anticipating a price increase. Generally, a positive rate (longs pay shorts) indicates bullish sentiment, while negative (shorts pay longs) indicates bearishness.
The metrics for UNI and SUI read 0.0055% and 0.0071%, respectively, on Tuesday. These positive rates for both altcoins indicate that longs are paying shorts.
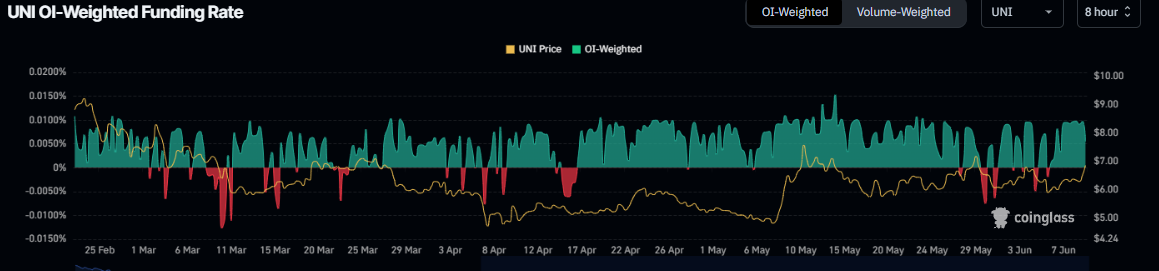
UNI funding rate chart. Source: Coinglass
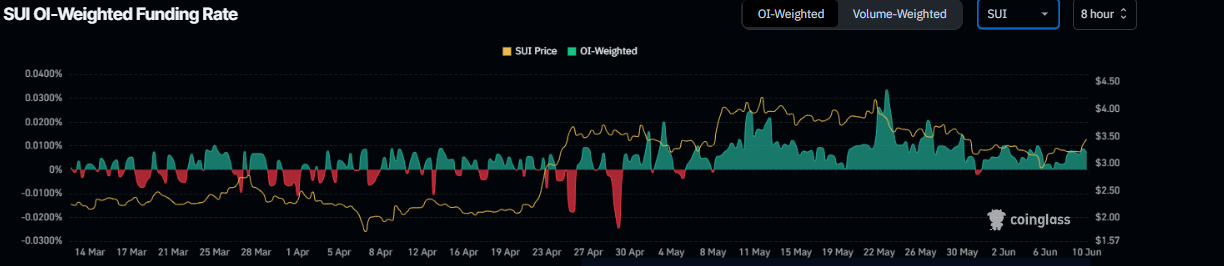
SUI funding rate chart. Source: Coinglass
Uniswap Price Forecast: UNI could rally if it closes above the $7.38 resistance level
Uniswap price declined after hitting its technical target of the double-bottom pattern, around $7.38 in mid-May, and found support at the key level of $6.04. UNI has been consolidating between the $6.04 and $7.38 levels for the last 23 days. At the time of writing on Tuesday, it trades 4% higher, nearing its key resistance level at $7.38.
Sideline investors looking for buying opportunities could do so if UNI closes above the $7.38 level on a daily basis. UNI could extend the rally by 16% from the $7.38 level to retest its next daily resistance at $8.63.
The Relative Strength Index (RSI) on the daily chart reads 61, above its neutral level and pointing upward, indicating that bullish momentum is gaining traction. The Moving Average Convergence Divergence (MACD) indicator showed a bullish crossover on Monday, signaling a buying opportunity and indicating an upward trend ahead.
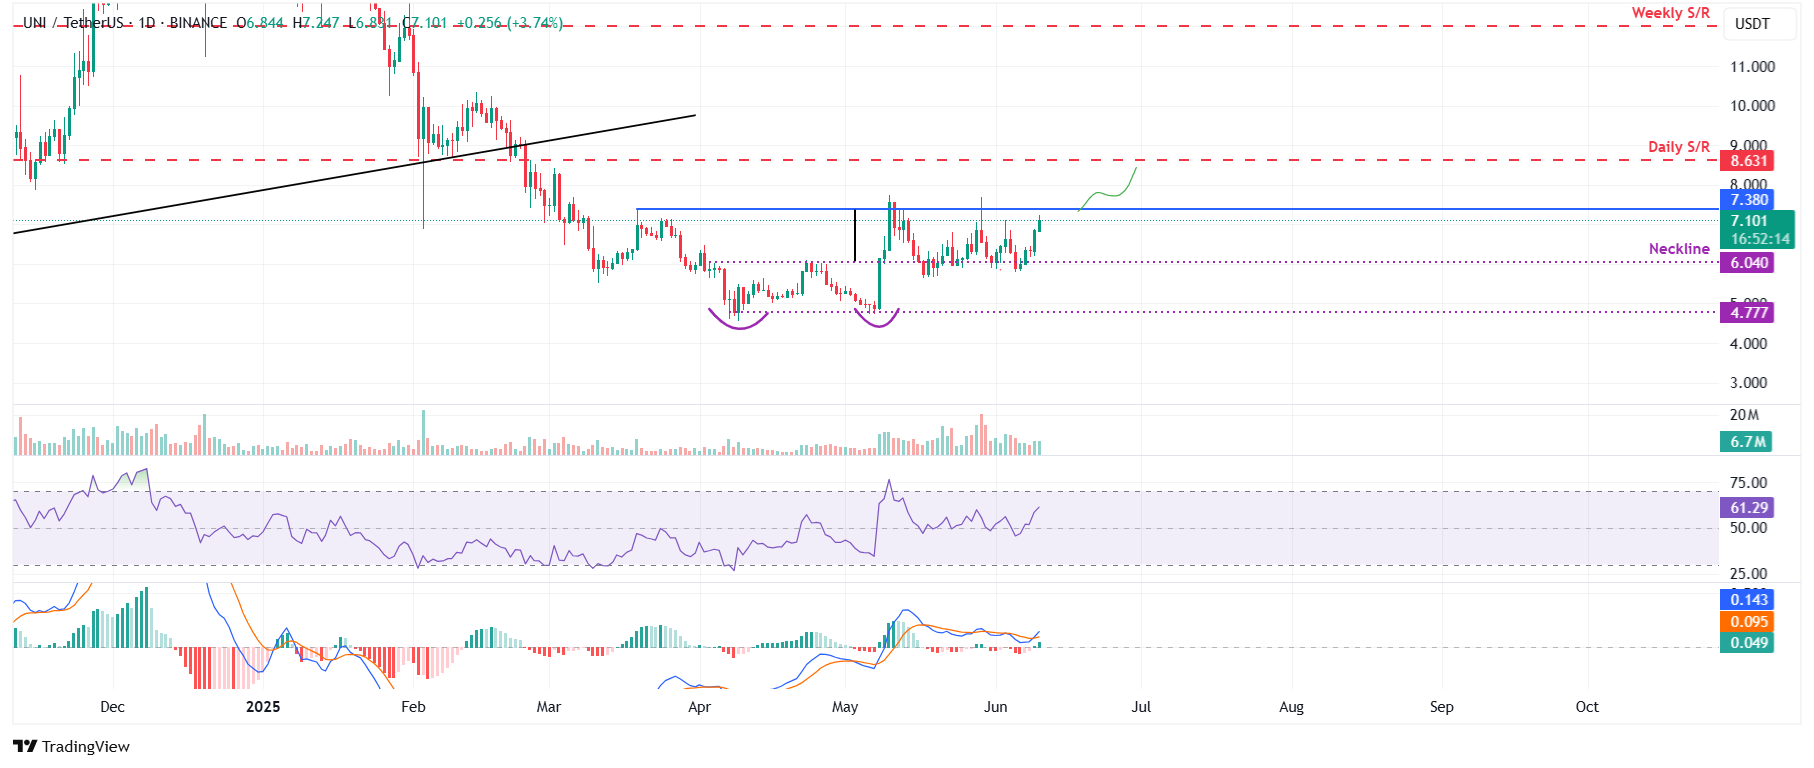
UNI/USDT daily chart
However, if UNI fails to break above the $7.38 resistance level and faces a correction, it could extend the decline to retest its key support at $6.04.
Sui Price Forecast: SUI price action looks promising
Sui price retested and found support around the key level at $3.05 last week on Thursday and recovered 17.81% until Monday. At the time of writing on Tuesday, it hovers around $3.40.
If Sui continues its upward trend, it could extend the rally to retest its daily resistance level at $3.65. Sideline traders looking to accumulate SUI tokens could do so if it closes above $3.65 on a daily basis; it could extend the rally to retest its next resistance at $4.25.
The RSI on the daily chart is hovering around its neutral level of 50, indicating indecisiveness among traders. For the bullish momentum to be sustained, the RSI must move above its neutral level of 50.
Moreover, the MACD indicator on the daily chart is about to flip a bullish crossover on the daily chart. If the MACD generates a bullish crossover, it will provide a buying signal and indicate an upward trend.
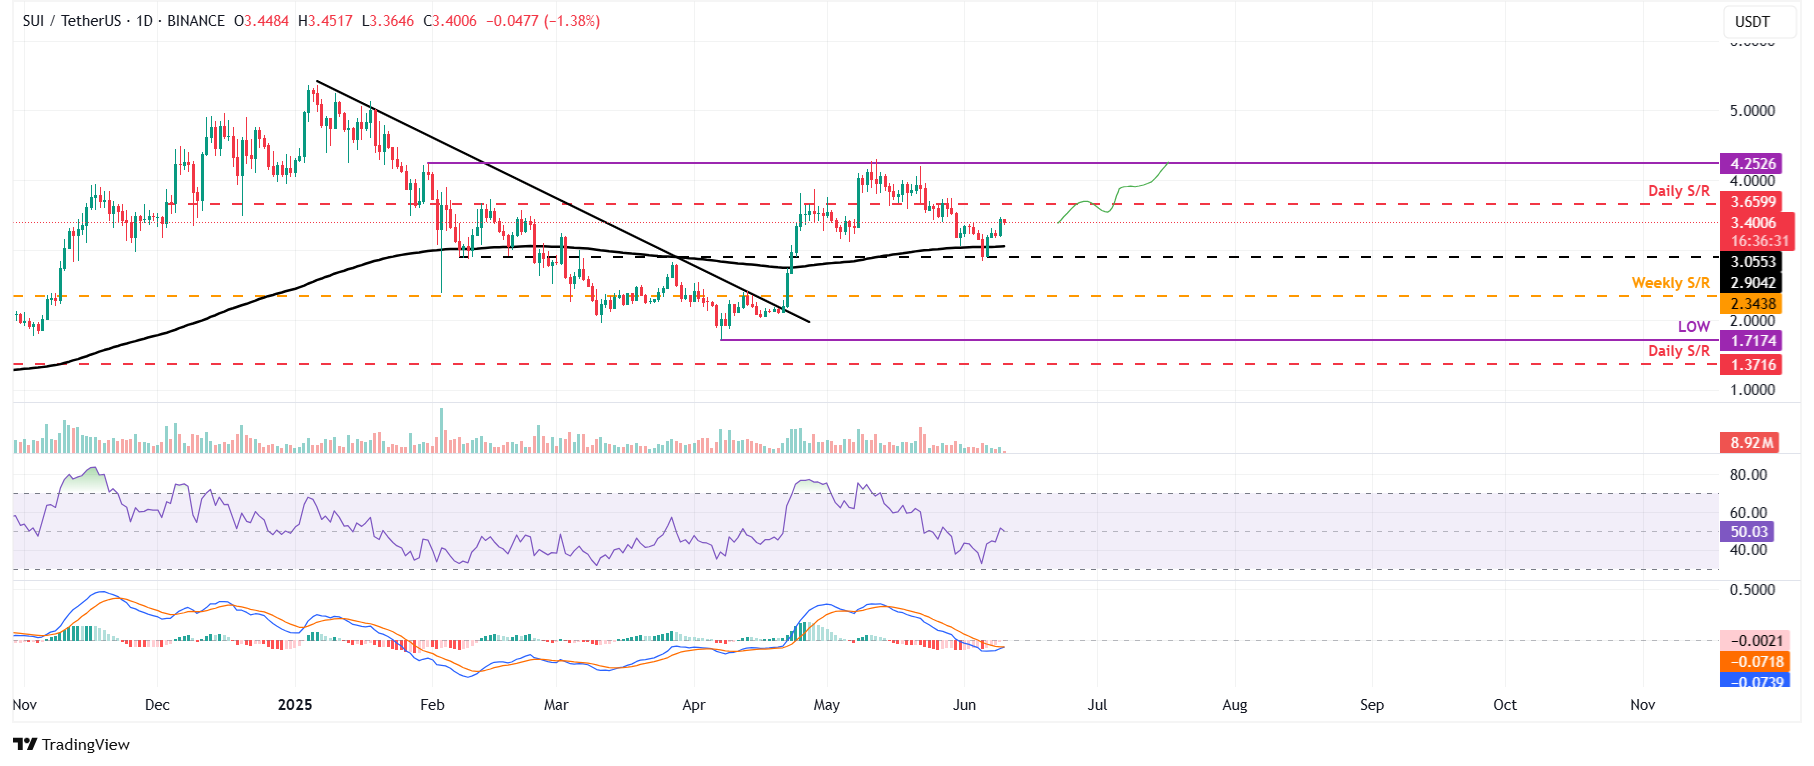
SUI/USDT daily chart
However, if SUI faces a correction, it could extend the decline to retest its key support level at $3.05.
Read more
* The content presented above, whether from a third party or not, is considered as general advice only. This article should not be construed as containing investment advice, investment recommendations, an offer of or solicitation for any transactions in financial instruments.


