
Dow Jones Industrial Average climbs as investors pivot away from tech
- The Dow Jones soared on Tuesday, climbing into multi-month highs.
- The Dow is getting a boost from a reversal out of tech stocks.
- Budget watchers remain leery of details in Trump’s spend-heavy funding bill.
The Dow Jones Industrial Average (DJIA) rose to its highest levels in around five months on Tuesday, testing above 44,500 for the first time since early February. Equity markets were overall mixed, with declines in tech stocks keeping other major indexes under wraps. Health stocks are leading the charge higher on the Dow Jones, while tech giants including Nvidia (NVDA) and Tesla (TSLA) are struggling under the weight of their unique battles.
The Trump administration is inching toward finally passing its “big, beautiful budget bill” after weeks of political grappling over different sections of the rapidly changing government spending bill. However, one thing is certain to investors: Trump’s spend-heavy budget will be adding trillions of dollars of debt to the already heavily laden federal deficit for years to come.
Healthcare up, tech stocks down
Health sector stocks are catching a windfall as investors pull back from tech giants heading into the midweek. Ongoing trade and tariff uncertainty, political strife, and insider selling are all beginning to weigh on both hardware giant Nvidia and electric vehicle maker Tesla.
Tesla CEO Elon Musk, who until recently was President Trump’s right-hand hatchetman responsible for cutting federal workers and entire departments without congressional oversight, has crashed out of Trump’s inner circle. Musk has stepped up his antagonism of President Trump’s budget, and is threatening to fund the opponents of Republicans who support the bill.
Nvidia is struggling to continue delivering triple-digit revenue growth that has become the new baseline expectation for tech investors. The dizzying fervor over Nvidia shares, which have risen nearly 1,400% from a low of $10.81 in October of 2022 and peaked at $158.83 per share in June, could be seeing a flattening as the Trump administration continues to use US tech access as a bargaining chip in trade talks with China. Also on Nvidia's investor radar is a growing list of insider stockholders who have been slowly releasing their shares this year, even as share prices reach meteoric highs. Nvidia insiders have released upwards of a billion dollars’ worth of Nvidia stock over the past year, prompting some NVDA traders to wonder if the top on the AI craze is already priced in.
US data improves, but trade overhang remains
US ISM Manufacturing Purchasing Managers Index (PMI) figures for June came in stronger than expected on Tuesday, rising to 49.0 from last month’s 48.5. Despite the improvement, aggregated investor sentiment is still stuck in contraction territory as business operators continue to worry about growth prospects in the face of tumultuous trade and tariff conditions.
Dow Jones price forecast
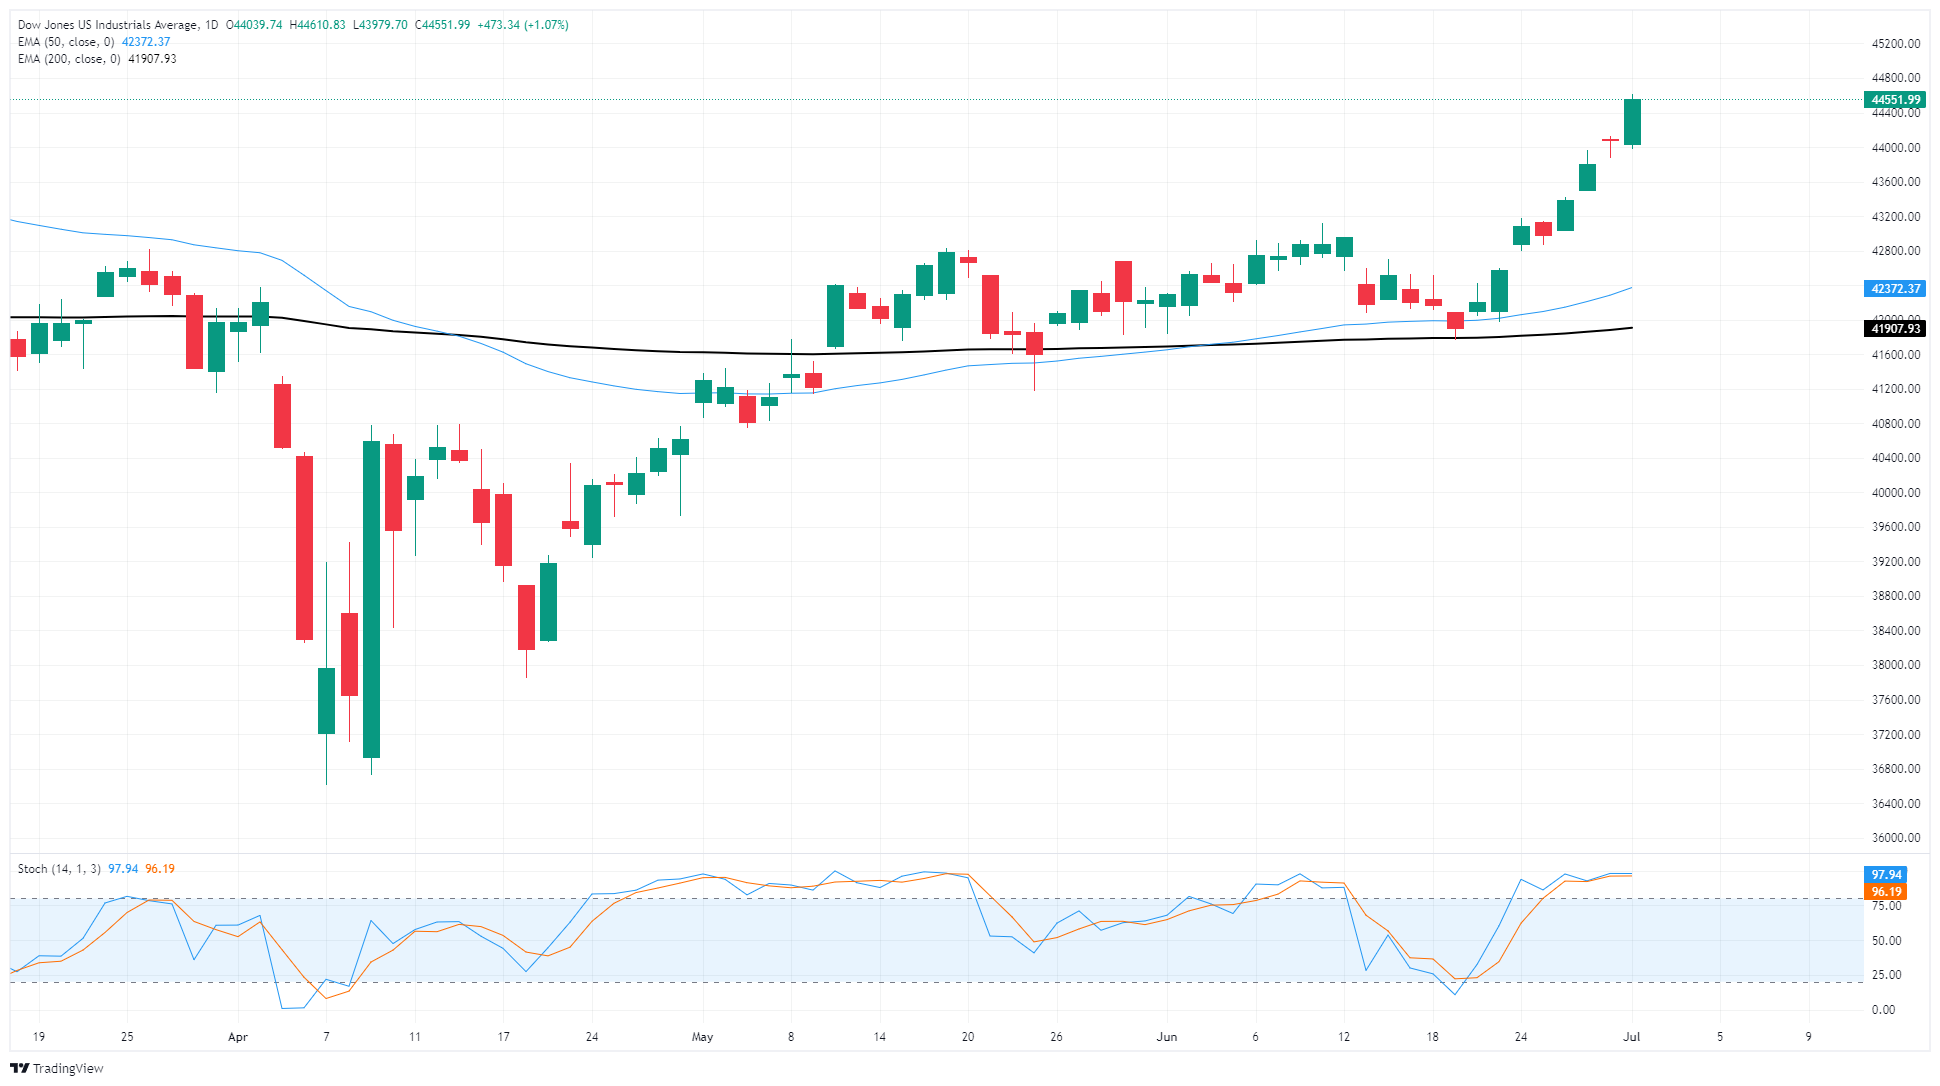
The Dow Jones surged around a full percent on Tuesday, climbing above 44,500 for the first time in several months. The major equity index is now on pace to take a fresh run at all-time highs north of 45,000, but bidders will have to contend with overbought conditions and a possible relief pullback first. Technical oscillators are pinned deep in overbought territory, and intraday bids have reached their highest differential from the 50-day Exponential Moving Average (EMA) since late 2024, with the medium-term moving average rising into 42,380.
Dow Jones daily chart
Dow Jones FAQs
The Dow Jones Industrial Average, one of the oldest stock market indices in the world, is compiled of the 30 most traded stocks in the US. The index is price-weighted rather than weighted by capitalization. It is calculated by summing the prices of the constituent stocks and dividing them by a factor, currently 0.152. The index was founded by Charles Dow, who also founded the Wall Street Journal. In later years it has been criticized for not being broadly representative enough because it only tracks 30 conglomerates, unlike broader indices such as the S&P 500.
Many different factors drive the Dow Jones Industrial Average (DJIA). The aggregate performance of the component companies revealed in quarterly company earnings reports is the main one. US and global macroeconomic data also contributes as it impacts on investor sentiment. The level of interest rates, set by the Federal Reserve (Fed), also influences the DJIA as it affects the cost of credit, on which many corporations are heavily reliant. Therefore, inflation can be a major driver as well as other metrics which impact the Fed decisions.
Dow Theory is a method for identifying the primary trend of the stock market developed by Charles Dow. A key step is to compare the direction of the Dow Jones Industrial Average (DJIA) and the Dow Jones Transportation Average (DJTA) and only follow trends where both are moving in the same direction. Volume is a confirmatory criteria. The theory uses elements of peak and trough analysis. Dow’s theory posits three trend phases: accumulation, when smart money starts buying or selling; public participation, when the wider public joins in; and distribution, when the smart money exits.
There are a number of ways to trade the DJIA. One is to use ETFs which allow investors to trade the DJIA as a single security, rather than having to buy shares in all 30 constituent companies. A leading example is the SPDR Dow Jones Industrial Average ETF (DIA). DJIA futures contracts enable traders to speculate on the future value of the index and Options provide the right, but not the obligation, to buy or sell the index at a predetermined price in the future. Mutual funds enable investors to buy a share of a diversified portfolio of DJIA stocks thus providing exposure to the overall index.
Recommended Articles


