


The US Dollar Index edges lower to around 97.90 in Wednesday’s early European session.
The negative outlook of the index remains in play below the 100-day EMA with a bearish RSI indicator.
The first support level to watch is 97.75; the immediate resistance level is seen at 99.16.
The US Dollar Index (DXY), an index of the value of the US Dollar (USD) measured against a basket of six world currencies, extends the decline to near 97.90 during the early European session on Wednesday. Growing optimism that a ceasefire between Israel and Iran will hold after it was touted by US President Donald Trump weighs on the safe-haven currency like the Greenback.
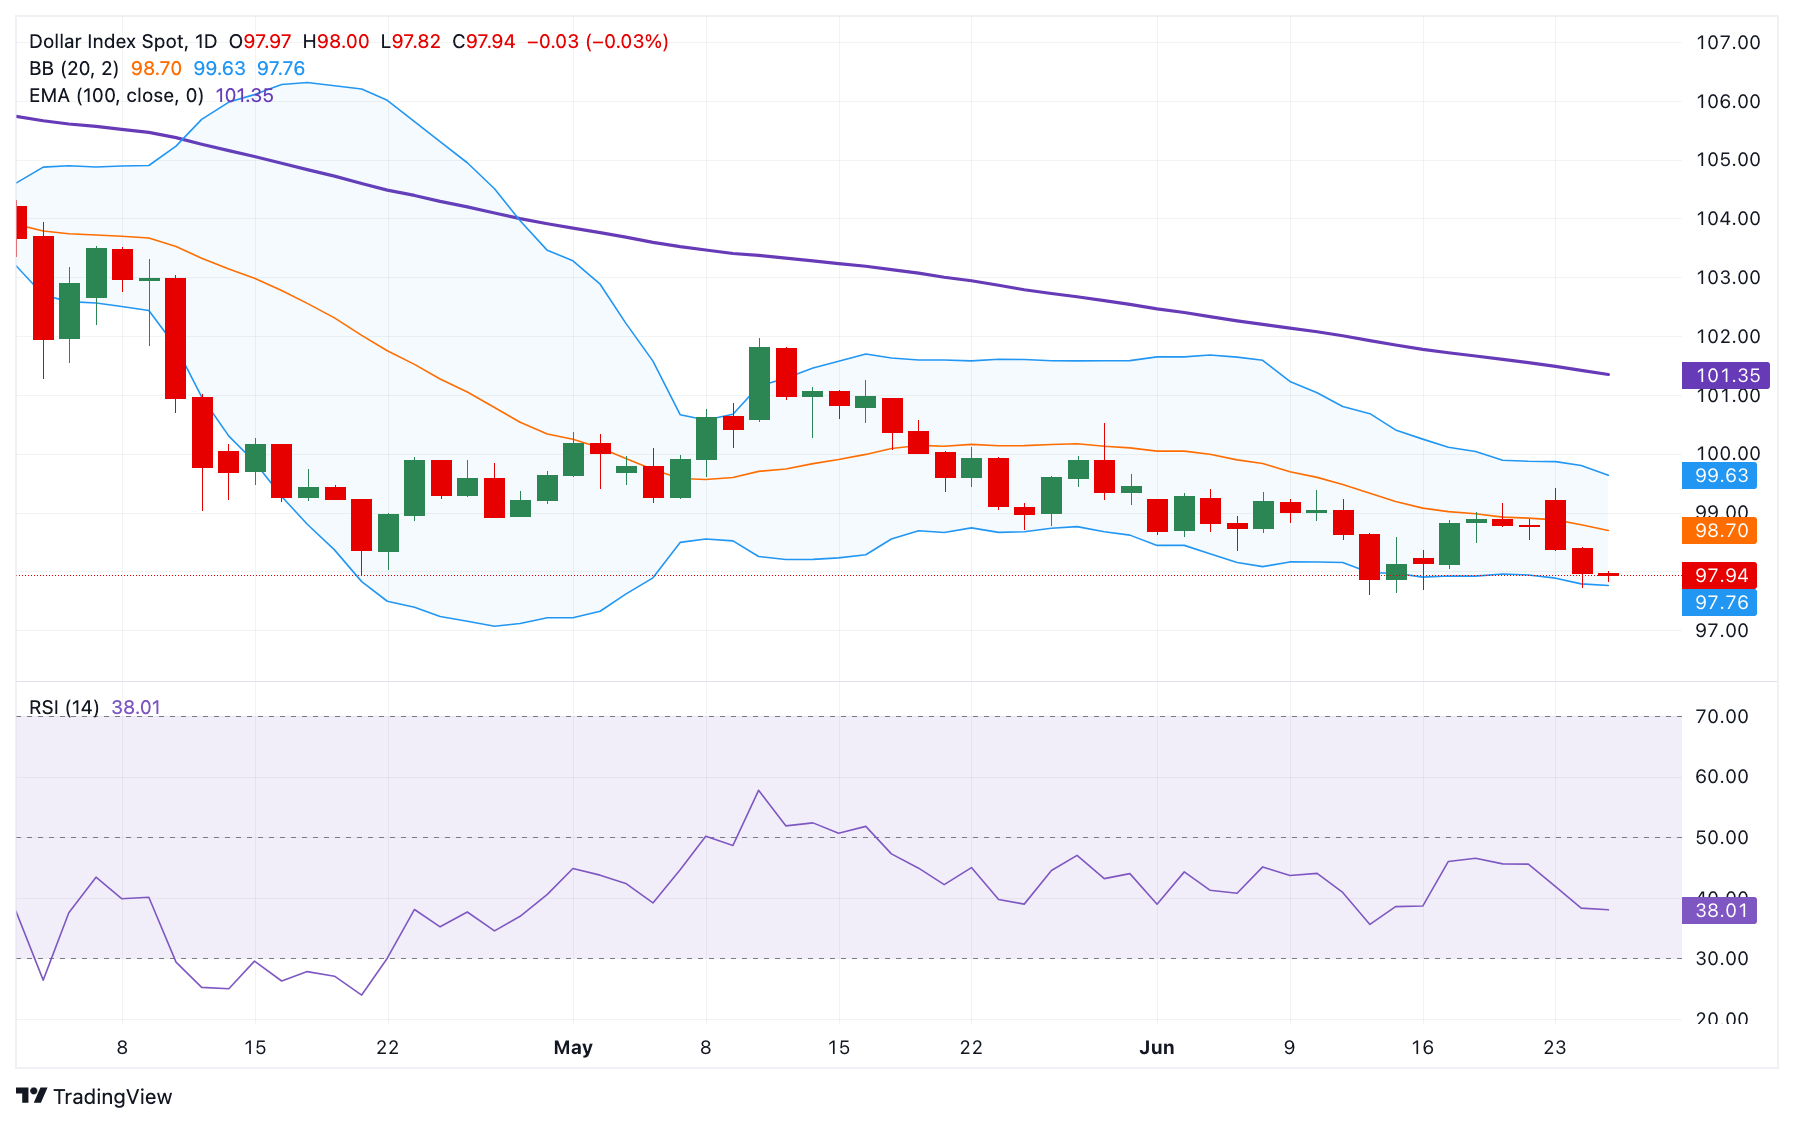
According to the daily chart, the bearish sentiment of DXY prevails as the index is below the key 100-day Exponential Moving Average (EMA). Furthermore, the downward momentum is supported by the 14-day Relative Strength Index (RSI), which stands below the midline near 37.95, supporting the sellers in the near term.
The initial support level for the US Dollar Index emerges at 97.75, the lower limit of the Bollinger Band. Further south, the additional downside filter to watch is 97.61, the low of June 12. The next contention level is seen at 96.55, the low of February 25, 2022.
On the bright side, the first upside barrier for the DXY is located at 99.16, the high of June 19. Any follow-through buying above this level could pave the way to 99.65, the upper boundary of the Bollinger Band. A decisive break above the mentioned level could see a rally to the 100.00 psychological level, en route to 101.35, the 100-day EMA.
US Dollar Index (DXY) daily chart
* The content presented above, whether from a third party or not, is considered as general advice only. This article should not be construed as containing investment advice, investment recommendations, an offer of or solicitation for any transactions in financial instruments.


