
Dow Jones Industrial Average gives up tech rally gains as policy confusion sets in
- The Dow Jones soared in overnight trading after Q1 Nvidia (NVDA) earnings beat the street again.
- Federal courts axed Trump’s “reciprocal” tariffs, citing misappropriation of national security laws.
- Equities fizzled during pre-market trading as investors await to see how the Trump administration will react.
The Dow Jones Industrial Average (DJIA) whipsawed through the overnight session and into Wednesday’s trading window, with investors piling back into the tech rally after Nvidia (NVDA) posted better-than-expected quarterly earnings in Q1. The United States (US) Federal Courts also struck down President Donald Trump’s wide-reaching “reciprocal” tariffs overnight, adding a fresh layer of chaos to markets as investors brace for the Trump administration's reaction.
Tariffs off?
Citing the International Emergency Economic Powers Act (IEEPA), President Donald Trump has been grappling to impose broad import taxes with generally low levels of success. The Trump administration has been waylaid by a constant cycle of walkbacks and tariff delays. Government-imposed import fees have taken on a quantum state within the White House, meant to both raise government revenues but also to strongarm other countries to the negotiation table for “trade deals” in the hopes of earning a tariff reduction.
The US Court of International Trade struck down Donald Trump’s sweeping “reciprocal” tariffs on Wednesday, stating that Trump’s “Worldwide Retaliatory Tariff Orders” broadly exceed the bounds of the IEEPA, which allows the President to bypass Congress to impose restrictions on trade during a national emergency. The Trump administration is expected to expedite the appeals process to get the decision in front of the Supreme Court, which has tended to rule in favor of Trump over precedent in the past.
US data eases slightly, PCE inflation in the barrel for Friday
US data broadly came in poor to mixed on Thursday, weighing on equities further, albeit to a limited extent. US Pending Home Sales fell to a one-year low of -6.3%, week-on-week Initial Jobless Claims rose more than expected to 240K, and Q1 Gross Domestic Product (GDP) contracted 0.2% on an annualized basis.
US Personal Consumption Expenditure Price Index (PCE) inflation for April is due on Friday and will be a key reading for investors. As the Federal Reserve’s (Fed) favored measure of inflation, PCE price growth has a direct link to when the Fed will move interest rates, and by how much.
Dow Jones price forecast
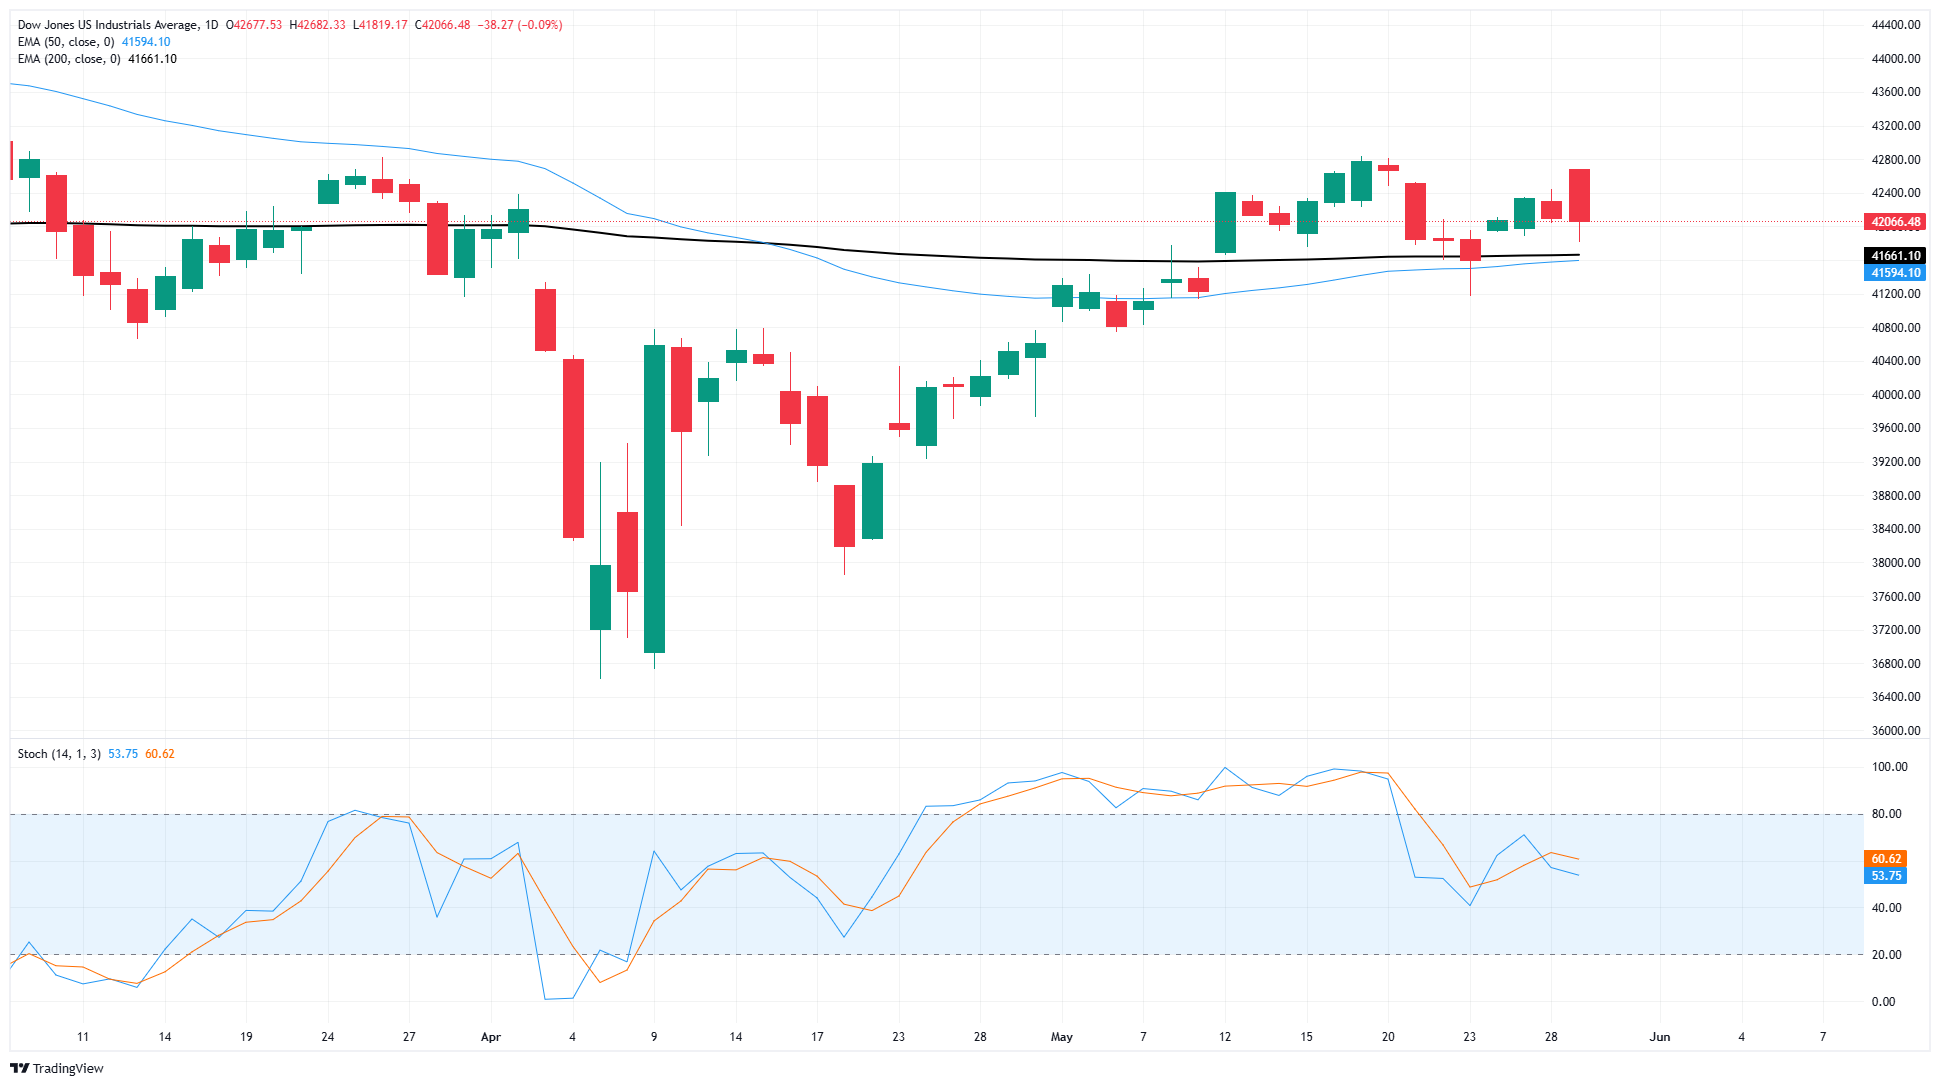
The Dow Jones Industrial Average pulled back sharply from weekly highs posted during the overnight session, falling back to the 42,000 region. The major equity index remains embedded in a near-term consolidation zone, with price action hobbled just north of the 200-day Exponential Moving Average (EMA) near 41,685.
Dow Jones daily chart
Dow Jones FAQs
The Dow Jones Industrial Average, one of the oldest stock market indices in the world, is compiled of the 30 most traded stocks in the US. The index is price-weighted rather than weighted by capitalization. It is calculated by summing the prices of the constituent stocks and dividing them by a factor, currently 0.152. The index was founded by Charles Dow, who also founded the Wall Street Journal. In later years it has been criticized for not being broadly representative enough because it only tracks 30 conglomerates, unlike broader indices such as the S&P 500.
Many different factors drive the Dow Jones Industrial Average (DJIA). The aggregate performance of the component companies revealed in quarterly company earnings reports is the main one. US and global macroeconomic data also contributes as it impacts on investor sentiment. The level of interest rates, set by the Federal Reserve (Fed), also influences the DJIA as it affects the cost of credit, on which many corporations are heavily reliant. Therefore, inflation can be a major driver as well as other metrics which impact the Fed decisions.
Dow Theory is a method for identifying the primary trend of the stock market developed by Charles Dow. A key step is to compare the direction of the Dow Jones Industrial Average (DJIA) and the Dow Jones Transportation Average (DJTA) and only follow trends where both are moving in the same direction. Volume is a confirmatory criteria. The theory uses elements of peak and trough analysis. Dow’s theory posits three trend phases: accumulation, when smart money starts buying or selling; public participation, when the wider public joins in; and distribution, when the smart money exits.
There are a number of ways to trade the DJIA. One is to use ETFs which allow investors to trade the DJIA as a single security, rather than having to buy shares in all 30 constituent companies. A leading example is the SPDR Dow Jones Industrial Average ETF (DIA). DJIA futures contracts enable traders to speculate on the future value of the index and Options provide the right, but not the obligation, to buy or sell the index at a predetermined price in the future. Mutual funds enable investors to buy a share of a diversified portfolio of DJIA stocks thus providing exposure to the overall index.
Recommended Articles


