
Injective extends gains as Testnet goes live amid rising demand for tokenized stocks
- Injective rises 5% on Thursday, adding to the double-digit gains from the previous day.
- Wednesday's sharp gains came on the back of a major network update.
- Injective Open Interest hits a 30-day high of $170 million, signaling increased optimism.
Injective (INJ) rises 5% at press time Thursday, following the 11.50% surge from the previous day on the back of Injective Protocol's Testnet going live. Amid the rising buzz around tokenized stocks, the Testnet launch boosted the optimism around the future of the platform and its token, with Open Interests in the derivatives market hitting a 30-day high of $170 million. The technical outlook supports an extended rally as trend momentum shifts to bullish.
Injective’s network upgrade could boost DeFi activity
Injective announced on Wednesday the launch of its Testnet, a significant milestone in the development of its decentralized finance (DeFi) space. With the testnet live, Injective claims to be the only Layer-1 chain to have unified virtual machine (VM) layers.
Typically, developers use multiple VMs to build decentralized applications (dApps) that raise complexities in the use of native tokens for dApps built on different VMs. The unified VM layer provides a framework for a MultiVM Token Standard (MTS) to unify liquidity across multiple dApps.
With the network upgrade increasing interoperability, developer and user activity could surge across Injective dApps.
Injective's Testnet launch aligns with the launch of tokenized stocks by Robinhood, Kraken, and Gemini. Notably, Injective holds nearly $1 billion in volume from tokenized stocks.
Traders anticipate an extended rally in Injective
CoinGlass’ data shows that the Injective Open Interest (OI) reached a 30-day high of $170.80 million on Thursday, up from $146.90 million on Wednesday. A surge in OI relates to additional or new purchases in the derivatives market, increasing the chances of a leverage-driven rally.
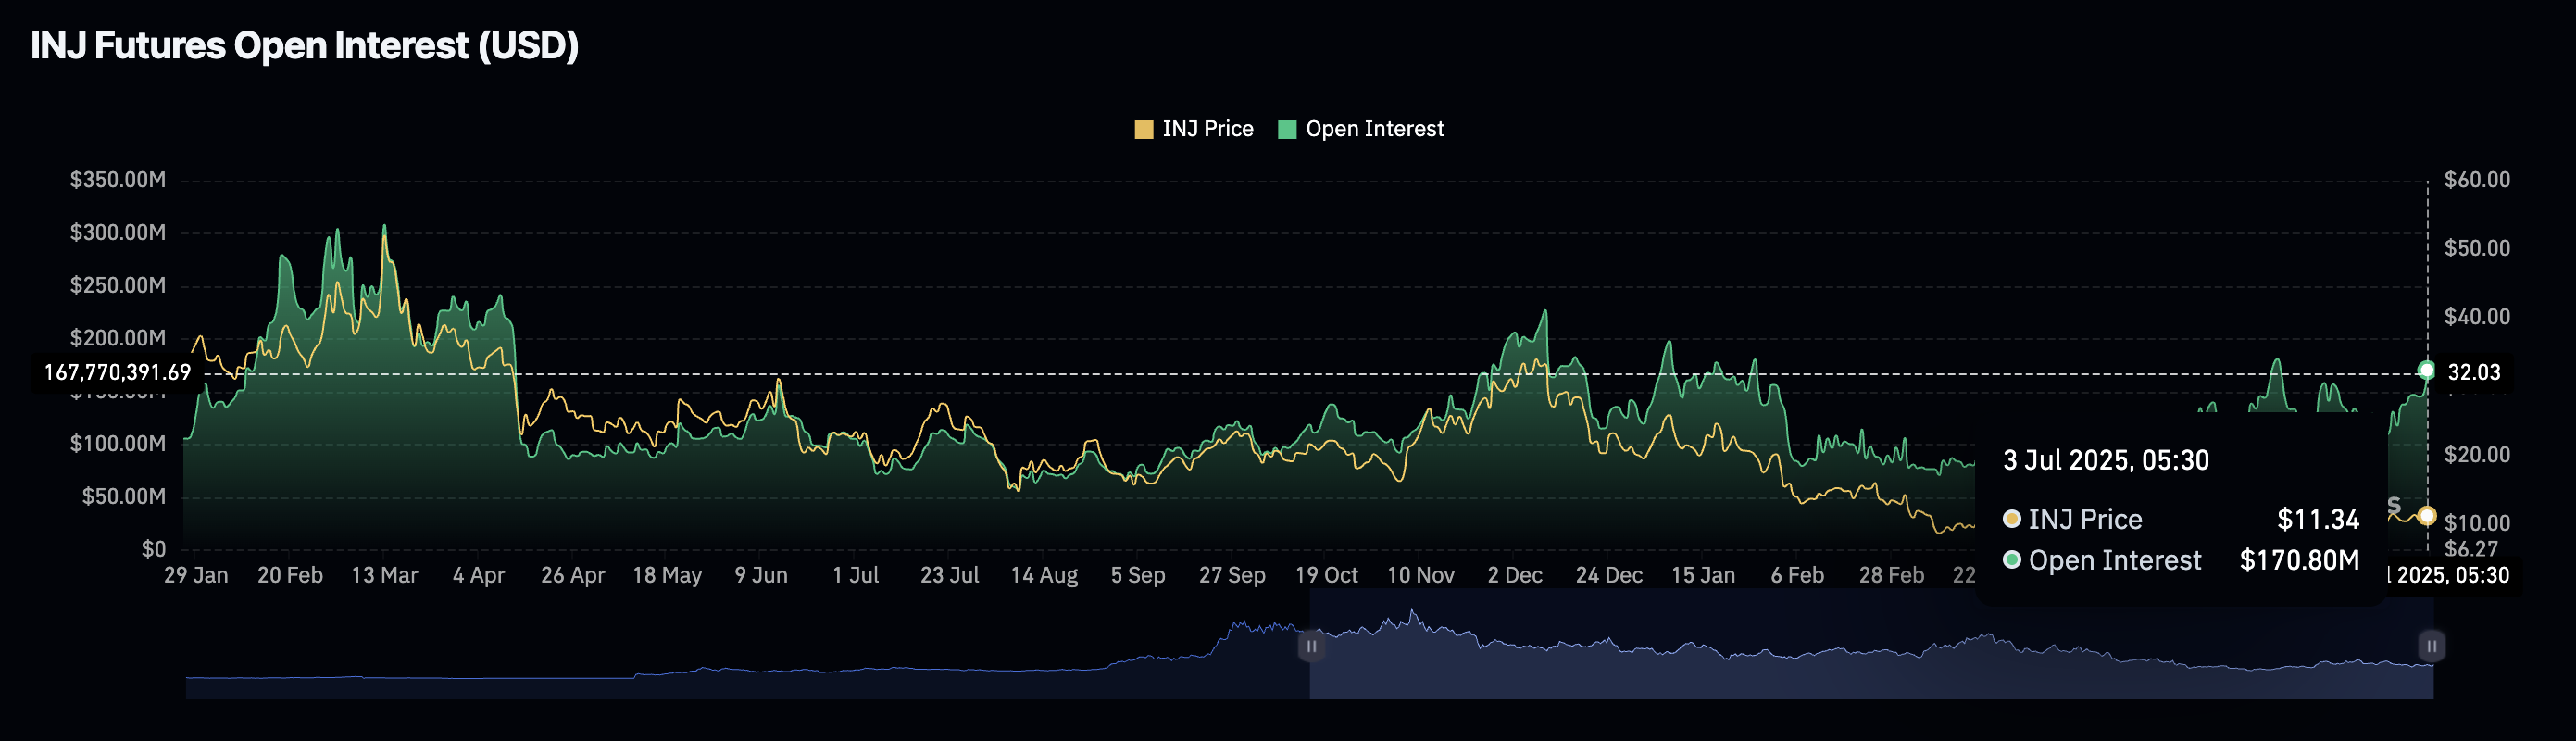
INJ Open Interest. Source: Coinglass
Adding credence to increased buying, the OI-weighted funding rate flips positive to 0.0103% from -0.0054% on Wednesday. Bulls pay the funding rates (positive) to offset the imbalance in spot and swap prices, which are rising due to increased buying pressure, and vice versa.
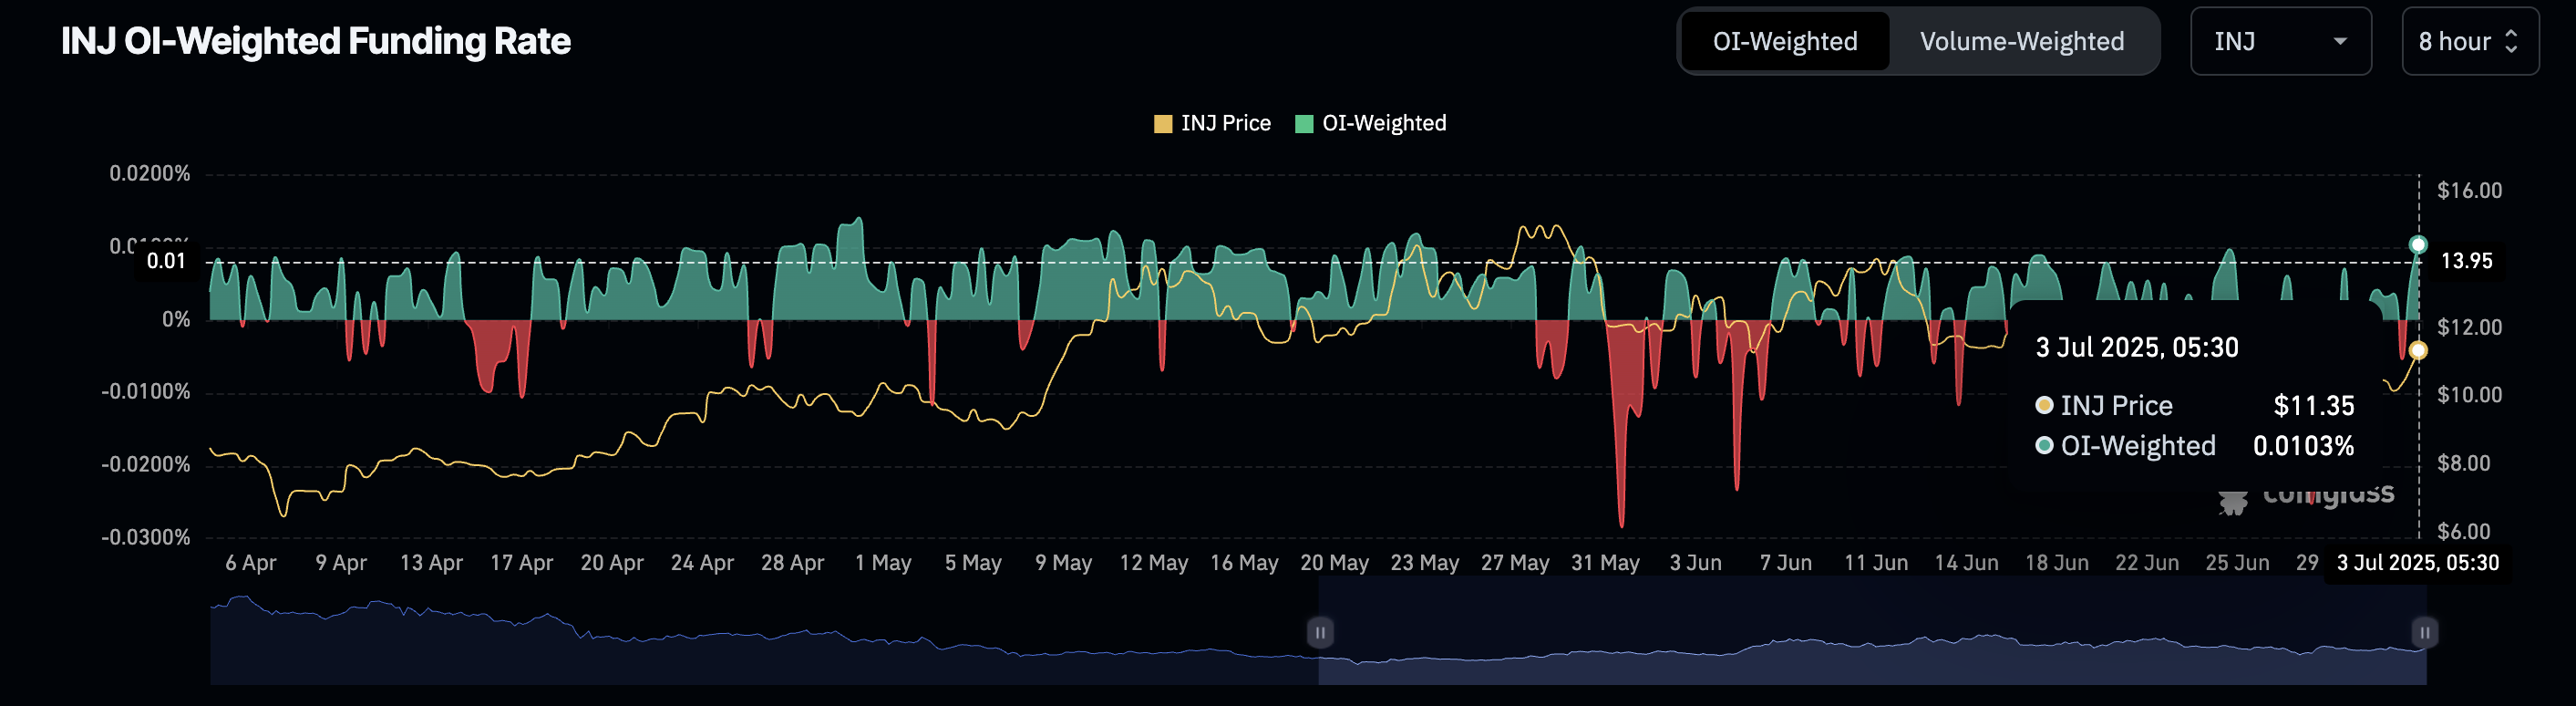
INJ OI-weighted funding rate. Source: Coinglass
Injective’s recovery targets the 200-day EMA
Injective trades near the 100-day Exponential Moving Average (EMA) at $11.91, teasing a potential breakout. At the time of writing, INJ trades higher by nearly 6% on the day, extending gains after the 11.50% rise on Wednesday.
A potential daily close above the 100-day EMA could extend the uptrend towards the 200-day EMA at $13.88. Beyond the dynamic resistances, INJ could target the 50% Fibonacci retracement level at $14.95, drawn from the December 6 high of $35.26 to the April 7 low of $6.34.
The technical indicators on the daily chart suggest a shift in trend momentum. The Relative Strength Index (RSI) at 54 crosses above the midpoint level of 50, reaching a neutral range while pointing upwards.
The Moving Average Convergence/Divergence (MACD) indicator displays the MACD line bouncing off its signal line, concurrent with a green histogram bar rising from the zero line. Typically, a spike in histogram bars indicates increased momentum, while the rising trend in average lines suggests a potential shift supporting the uptrend.
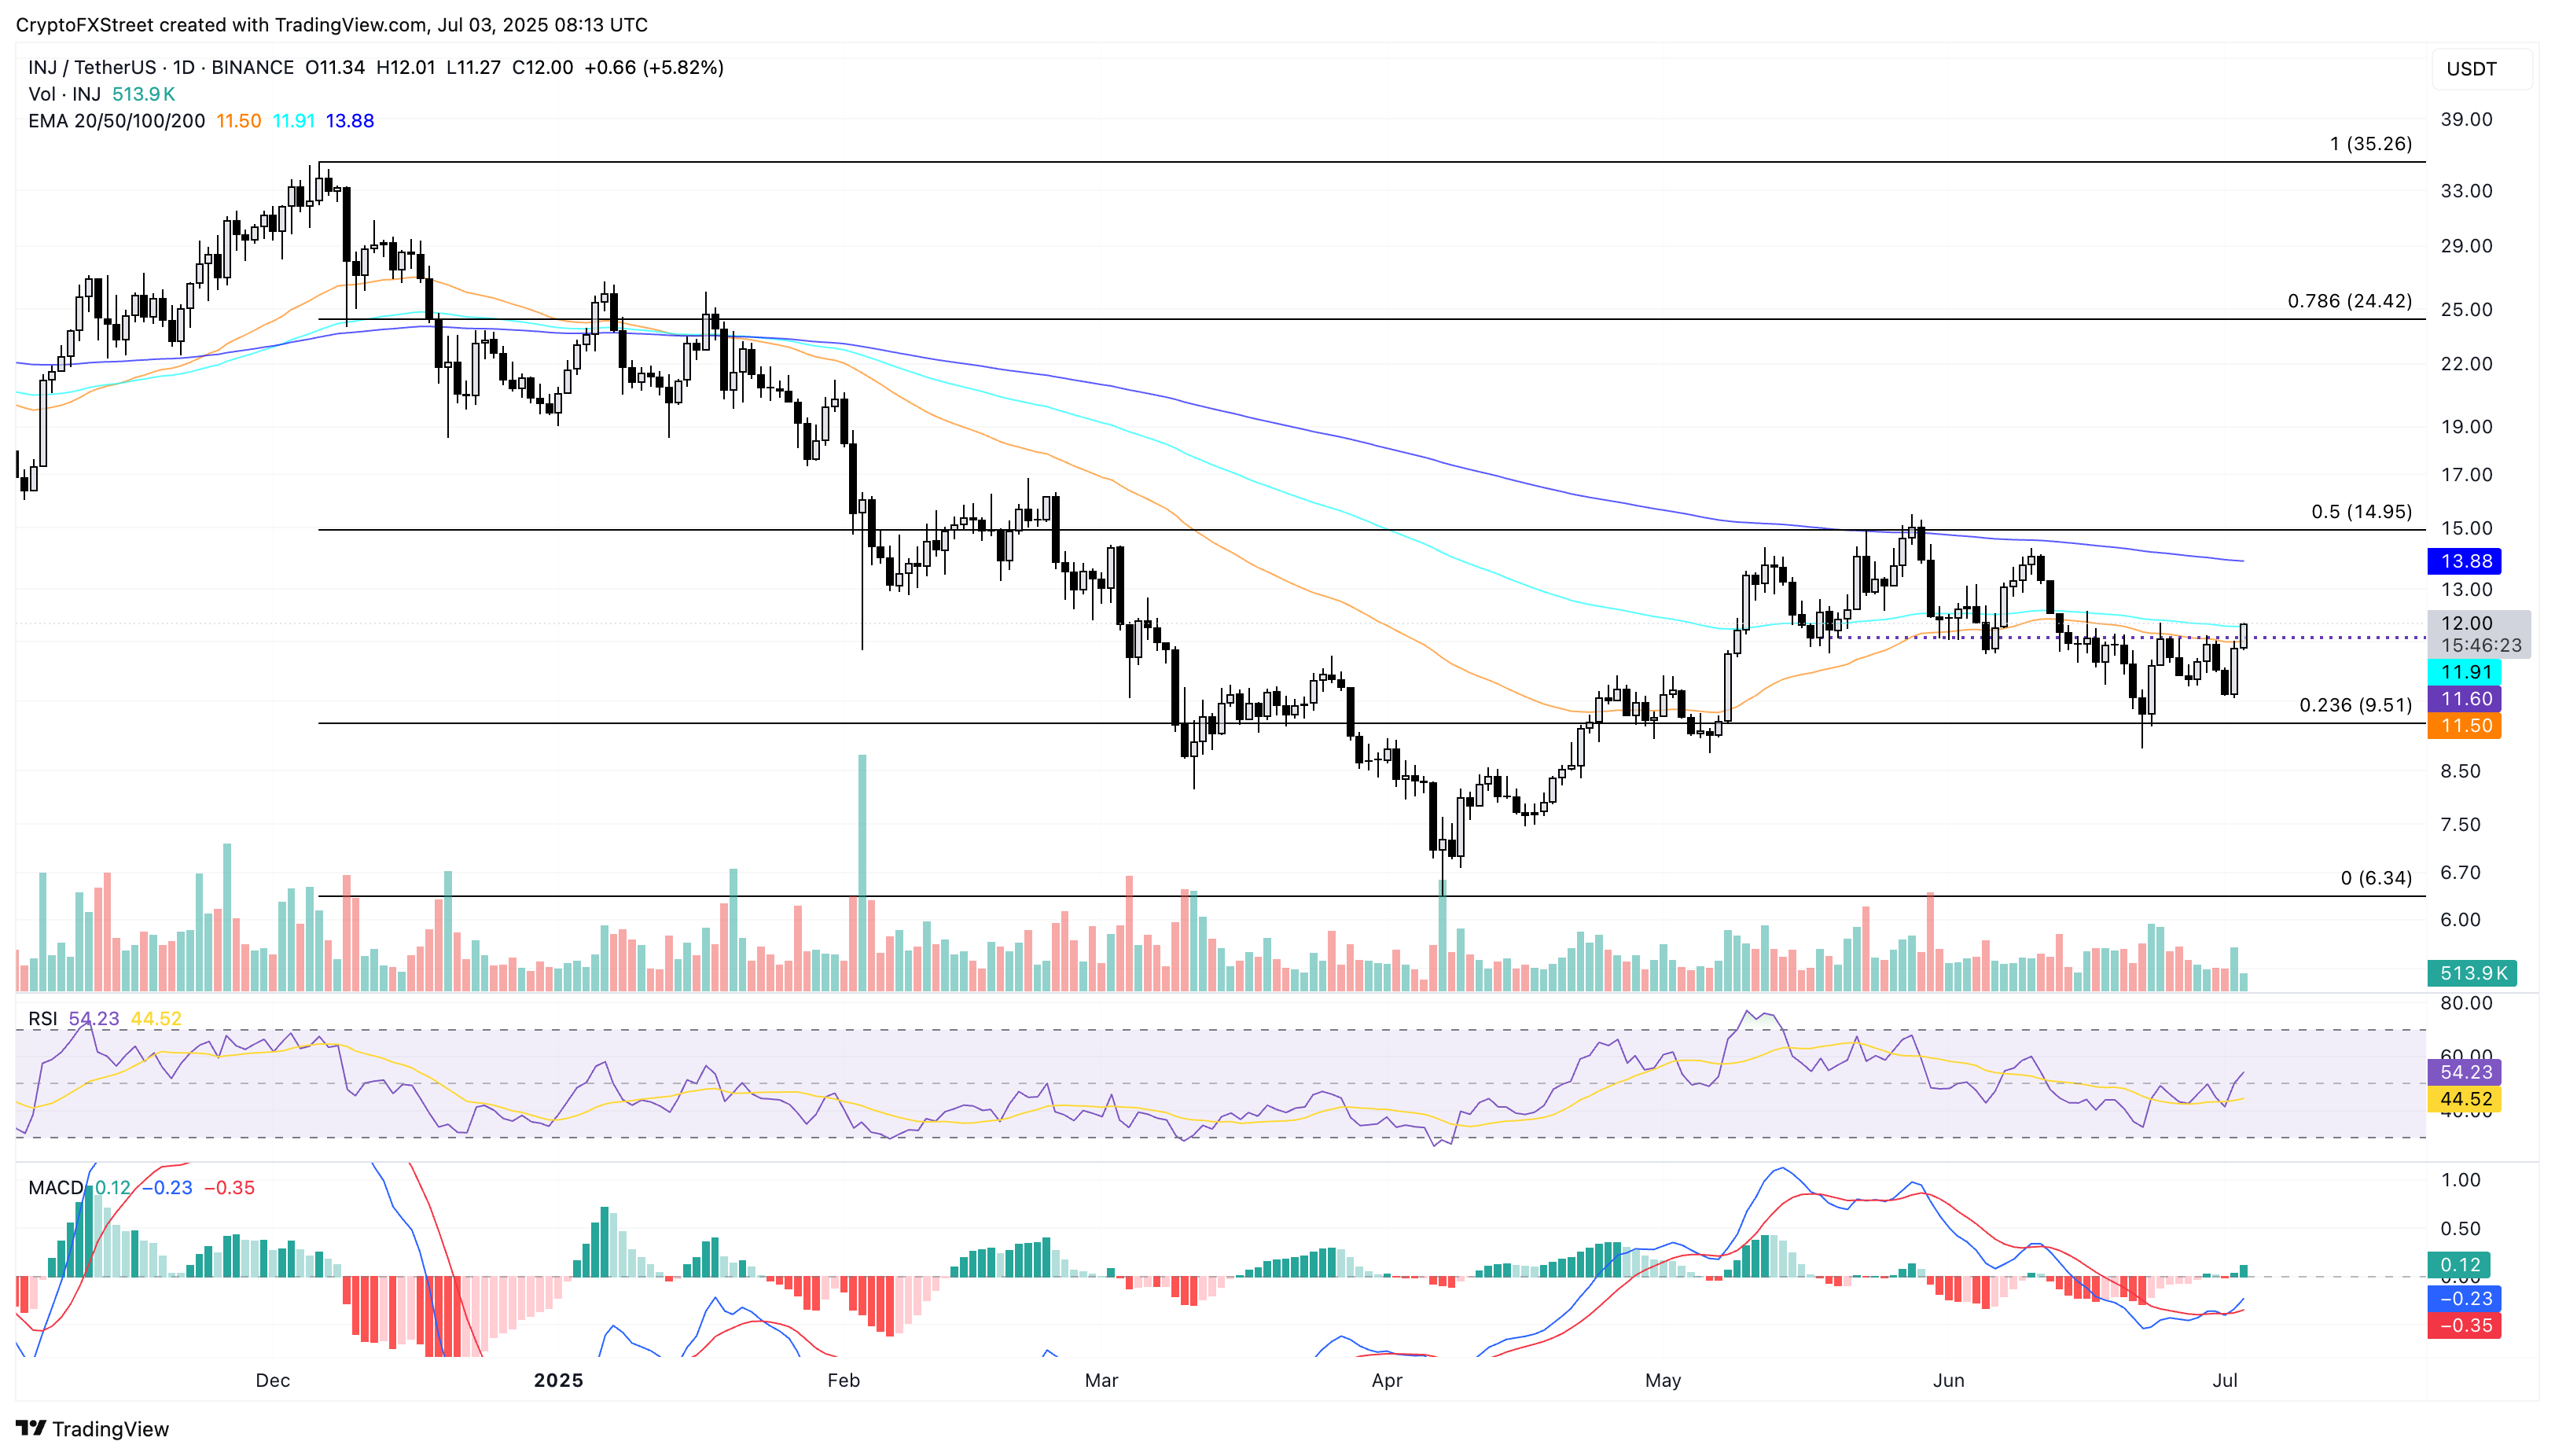
INJ/USDT daily price chart.
On the downside, if Injective fails to hold the gains and momentum, it could retest the 23.6% support floor at $9.51.
Recommended Articles


