
Solana’s first staking ETF debut, with $33 million in volume, outperforms XRP futures
- Solana’s first-ever staking ETF by Rex Shares went live on Wednesday, marking a major milestone for the network.
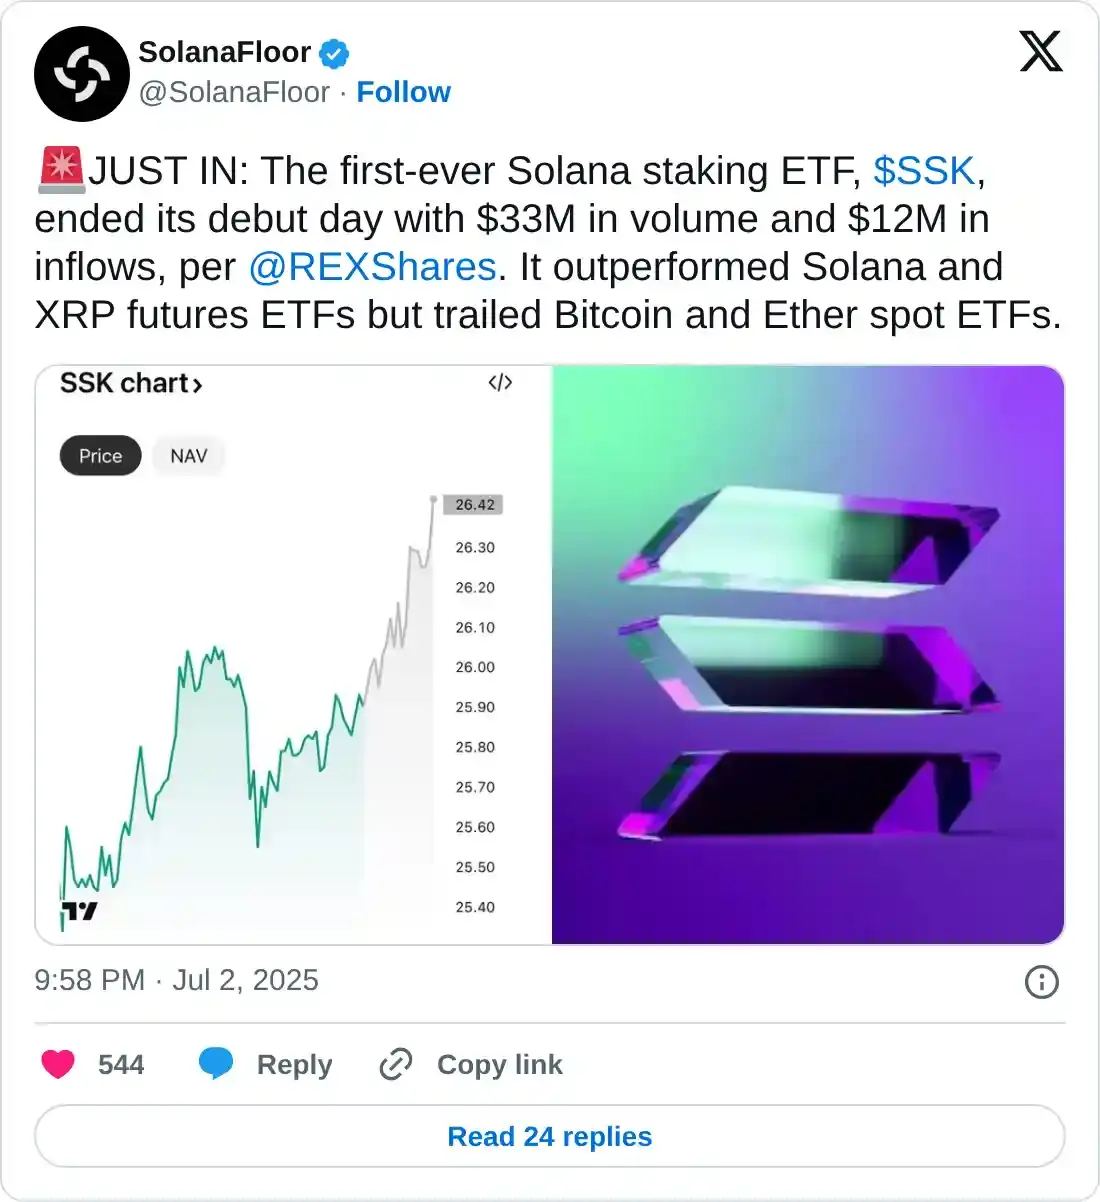
- SSK ETF recorded $33 million in trading volume and $12 million in inflows on its debut, outperforming XRP futures.
- Solana’s price extends its gains on Thursday after rallying nearly 4% the previous day.
Solana (SOL) price extends its gains, trading above $154 on Thursday following a 4% rally the previous day. The rally is supported by the successful debut of the network’s first-ever staking Exchange Trade Fund (ETF) in the United States (US). Launched by Rex Shares, the Solana Staking ETF (SSK) went live on Wednesday and quickly gained traction, recording $33 million in trading volume and $12 million in inflows on its first day. The strong demand helped SSK outperform Ripple (XRP) futures, reinforcing bullish sentiment around SOL and its growing institutional appeal.
Solana’s first US-listed ETF offering goes live
Solana’s first staking ETF, SSK by REX Shares, went live on the Chicago Board Options Exchange (Cboe) on Wednesday.
According to Eric Balchunas, Senior ETF Analyst at Bloomberg, SSK ended its debut day with $33 million in trading volume.
“Again, blows away, the Solana futures ETF and XRP futures ETFs (or the avg ETF launch), but it is much lower than the Bitcoin and Ether spot ETFs,” said Balchunas in his X post.
Moreover, SolanaFloor's X post highlighted that the $12 million in inflows occurred on its first day for SSK, highlighting its growing institutional appeal.
The healthy launch and growing demand for SOL’s SSK project indicate a bullish outlook for its native token, SOL, in the long term. This staking ETF provides investors with indirect exposure to SOL while also offering the opportunity to contribute to the network’s functionality through staking smart contracts, thereby enhancing its network growth and wider adoption.
Unlike the 12 Bitcoin spot ETFs operating in the US, which require the fund issuers to hold the underlying assets, this staking ETF requires the custodian to hold the underlying digital asset, which Anchorage Digital does.
Solana’s technical outlook hints at a rally ahead
Solana price broke out and closed above the descending trendline (drawn by connecting multiple highs since May 24) on Saturday, rallying to close above its 50-day Exponential Moving Average (EMA) at $151.48 the following day. However, it declined 5.12% on Tuesday and rebounded after retesting its descending trendline the next day. At the time of writing on Thursday, it continues to trade higher at around $153.41.
If SOL continues its upward trend, it could extend the rally toward its daily resistance level at $160. A successful close above this level could extend additional gains to retest its next daily resistance at $184.13.
The Relative Strength Index (RSI) on the daily chart reads 53, above its neutral level of 50, indicating that bullish momentum is gaining traction. The Moving Average Convergence Divergence (MACD) on the daily chart also displayed a bullish crossover on Saturday, providing a buy signal and indicating an upward trend.
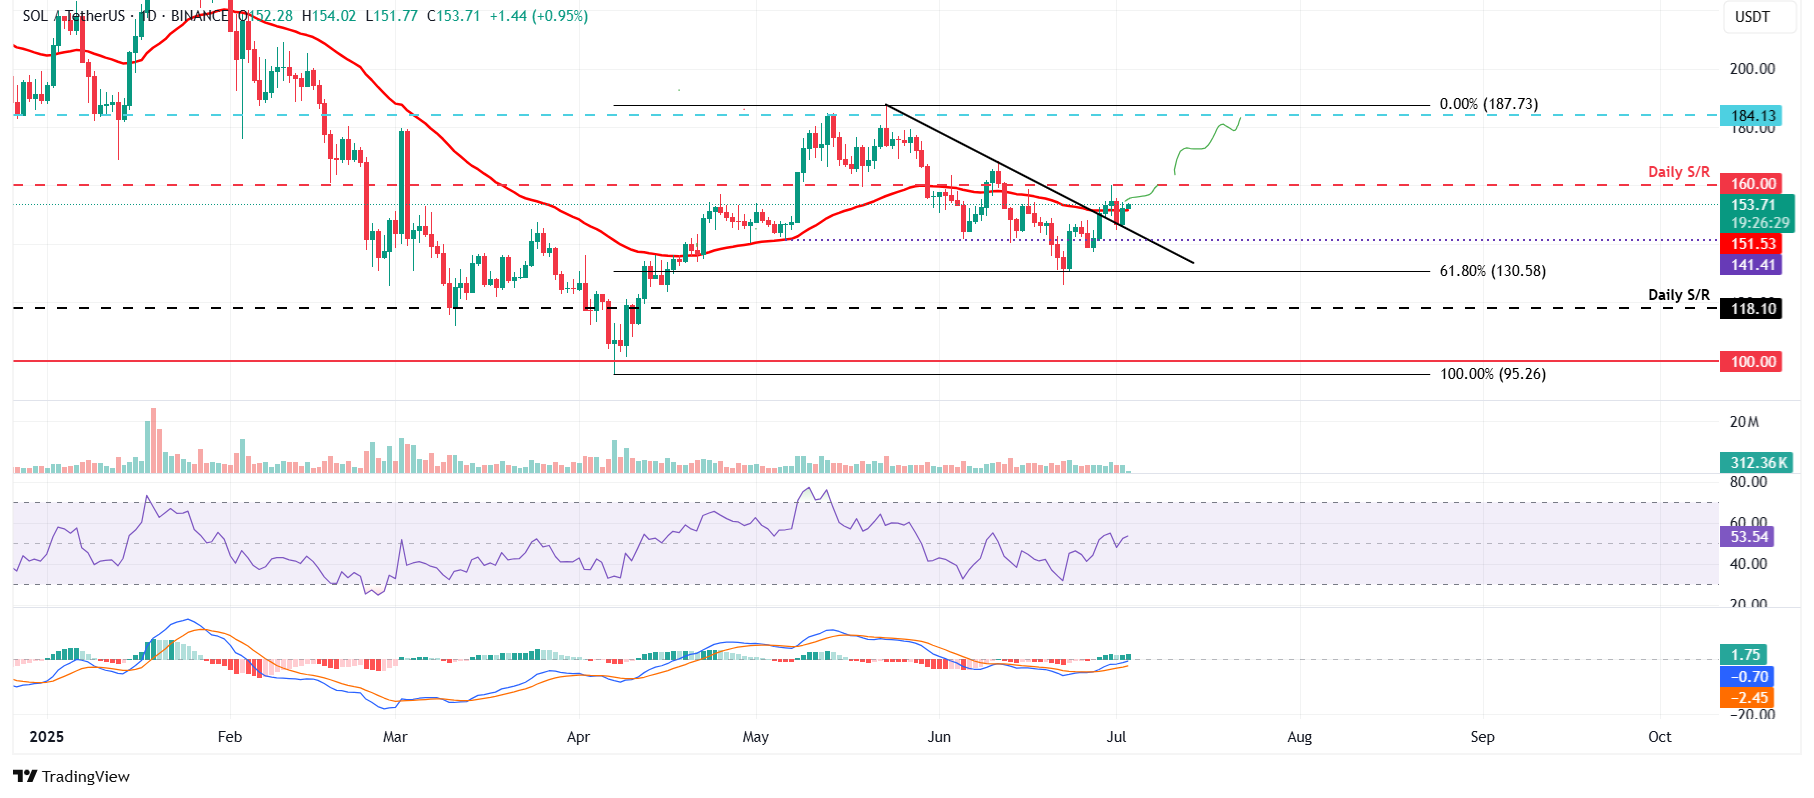
SOL/USDT daily chart
However, if SOL faces a correction, it could extend the decline toward its next support level at $141.41.
Recommended Articles


