
Crypto Today: Bitcoin, Ethereum, XRP tick higher as US Dollar weakens amid Trump's reiterated criticism of Powell
- Bitcoin pares geopolitical tensions losses, retesting $108,000 resistance.
- Investors are turning their attention to the differences between Trump and Powell, as well as concerns about the Fed's independence.
- Ethereum and XRP extend recovery amid a steady derivatives market with open interest regaining momentum.
Bitcoin (BTC) extends its recovery, briefly stepping above $108,000 resistance before correcting to trade at around $107,356 at the time of writing on Thursday, citing growing investor interest in digital assets due to concerns about the United States (US) Federal Reserve's independence. Leading altcoins, including Ethereum (ETH) and Ripple (XRP), are gaining bullish momentum, backing the surge in investor interest.
Market overview: President Trump hints at Fed Chair Powell's replacement
Sentiment in the cryptocurrency market has shifted from lukewarm after US President Donald Trump resumed his criticism of Federal Reserve (Fed) Chair Jerome Powell, hinting at his replacement.
President Trump described Powell as "terrible," before adding that he has potential successors in mind. "I know within three or four people who I'm going to pick," Trump told reporters at The Hague amid the NATO summit.
The direct criticism and perceived attacks on Powell continue to raise concerns about the central bank's independence. President Trump has called for interest rate cuts. Still, the Fed Chair, testifying before a US Senate panel on Wednesday, said that the central bank needs more time to observe the situation, as "higher tariffs could push up inflation this summer."
The US Dollar Index (DXY) slipped further on Thursday, holding at 97.17 at the time of writing. Based on the daily chart below, the DXY has declined by at least 11.82% from around 110.00 on January 13, prior to President Trump's inauguration.
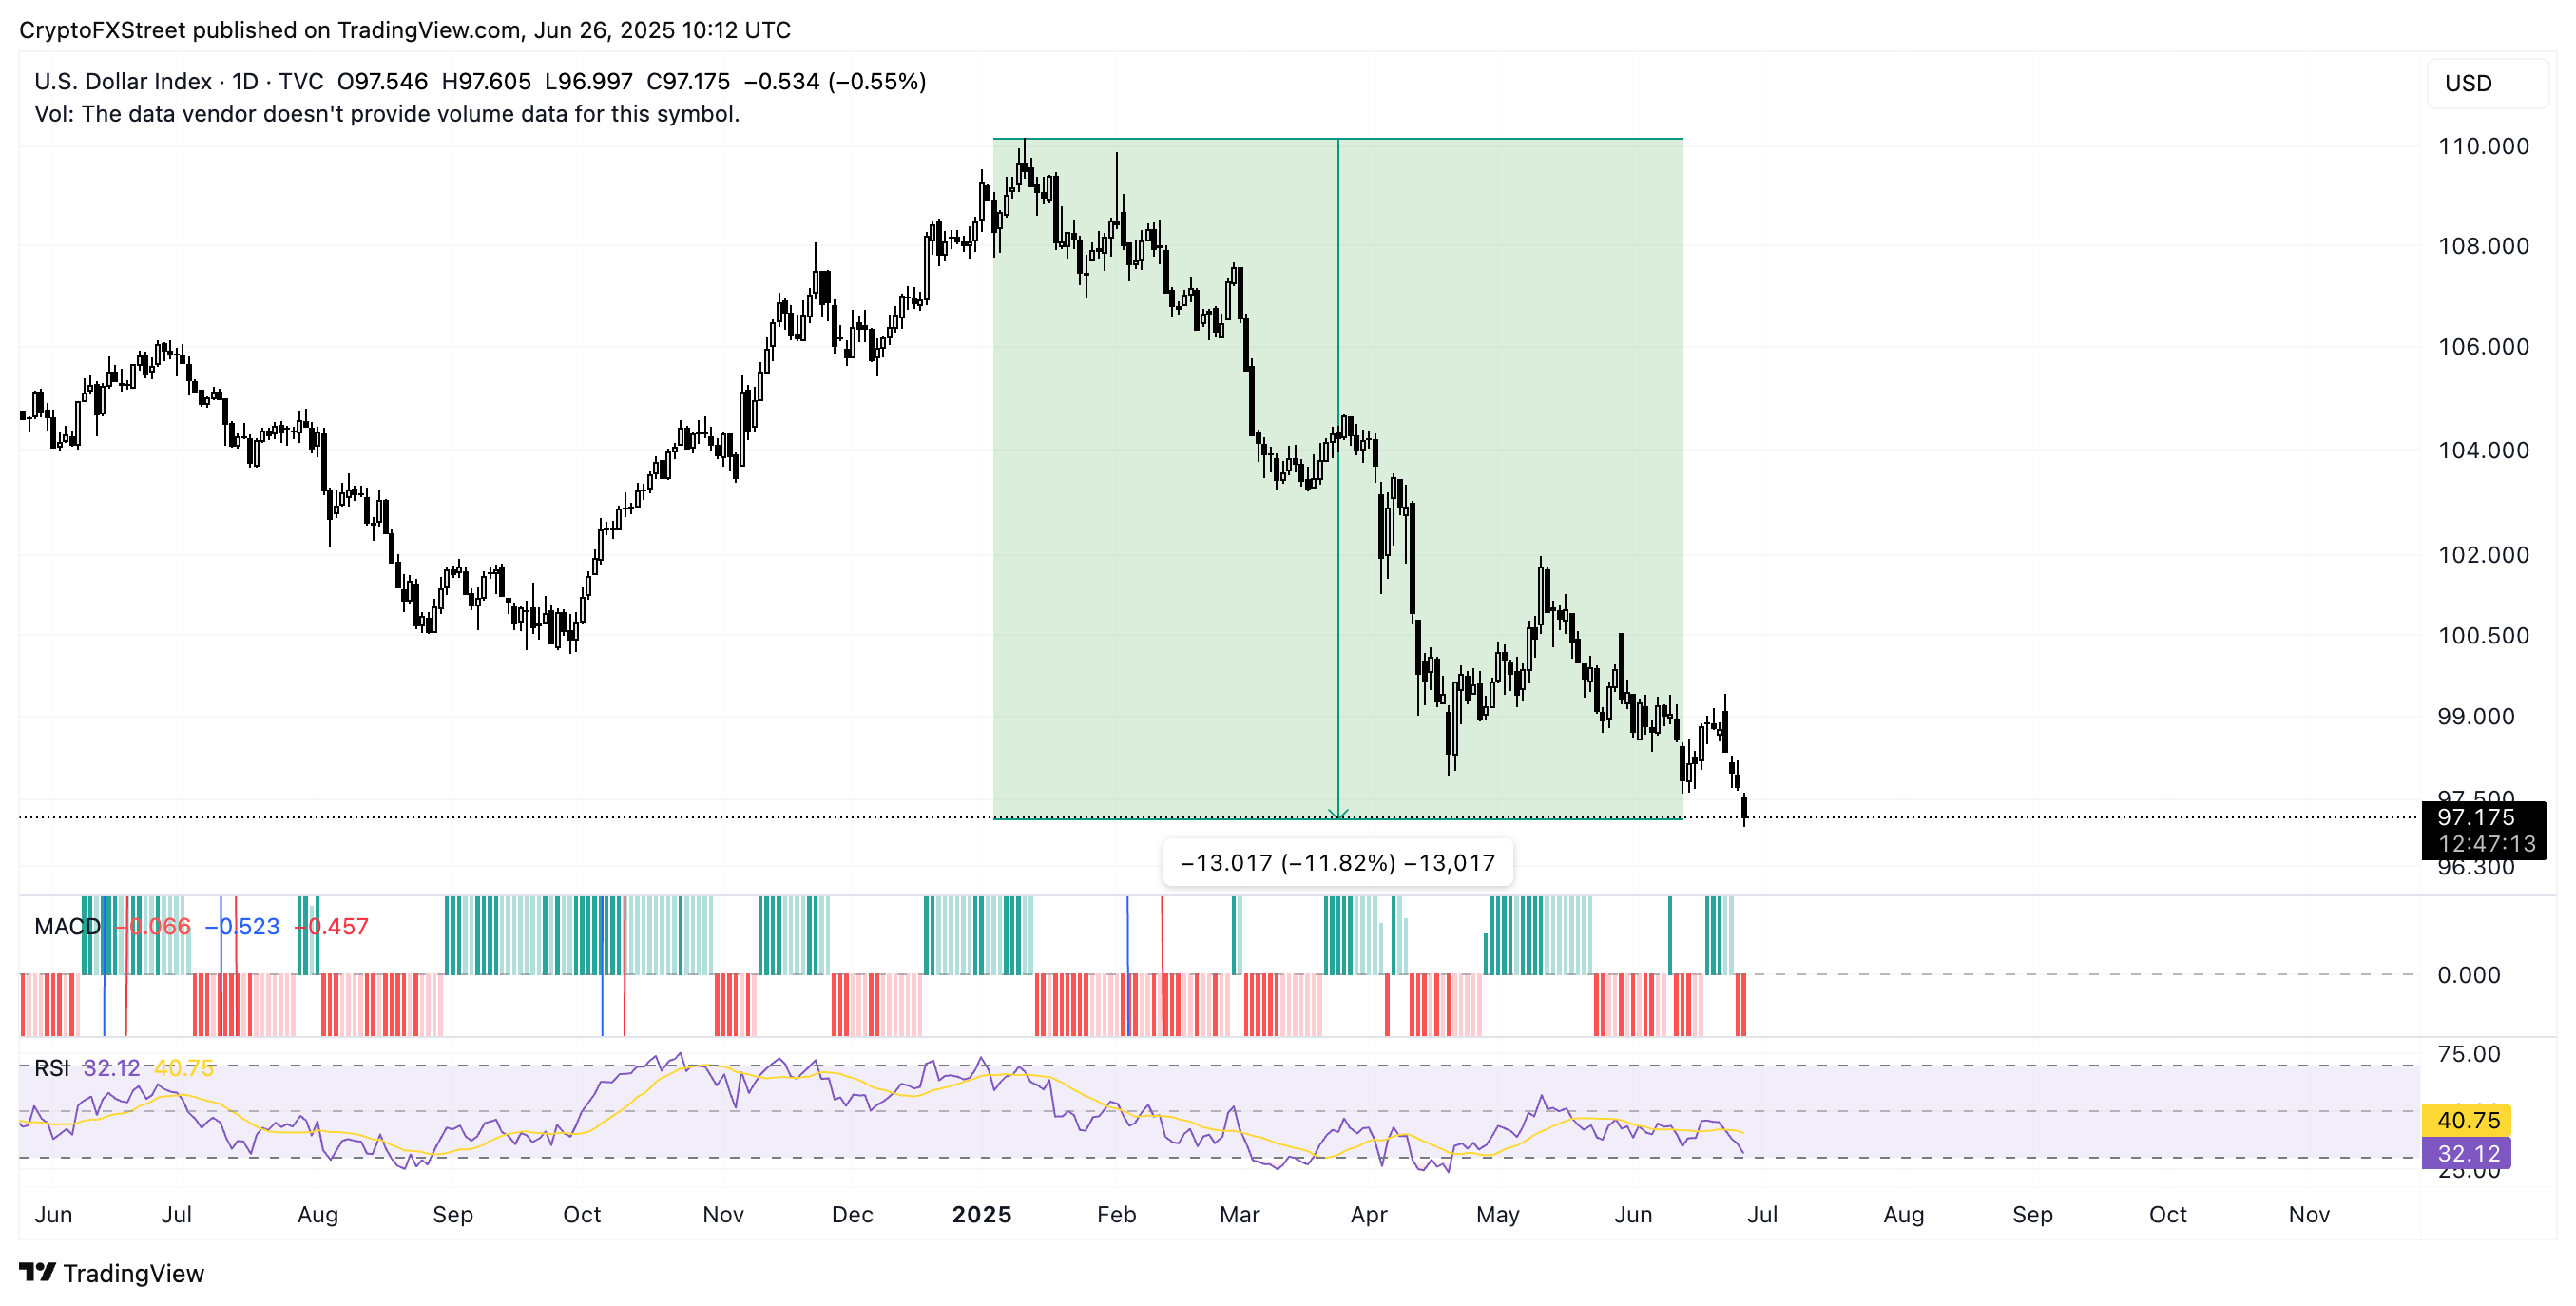
DXY daily chart
Data spotlight: Bitcoin, Ethereum spot ETF inflows surge
As investors digest the impact of President Trump's attacks on Jerome Powell and the independence of the central bank, interest in digital assets, especially in spot Exchange Traded Funds (ETFs) as a hedge against uncertainty, significantly ticks up.
SoSoValue data shows that investors pumped over $547 million in BTC spot ETFs on Wednesday, marking 12 consecutive days of net inflows. The cumulative total inflow volume currently stands at $48.14 billion, with net assets totaling approximately $134 billion.
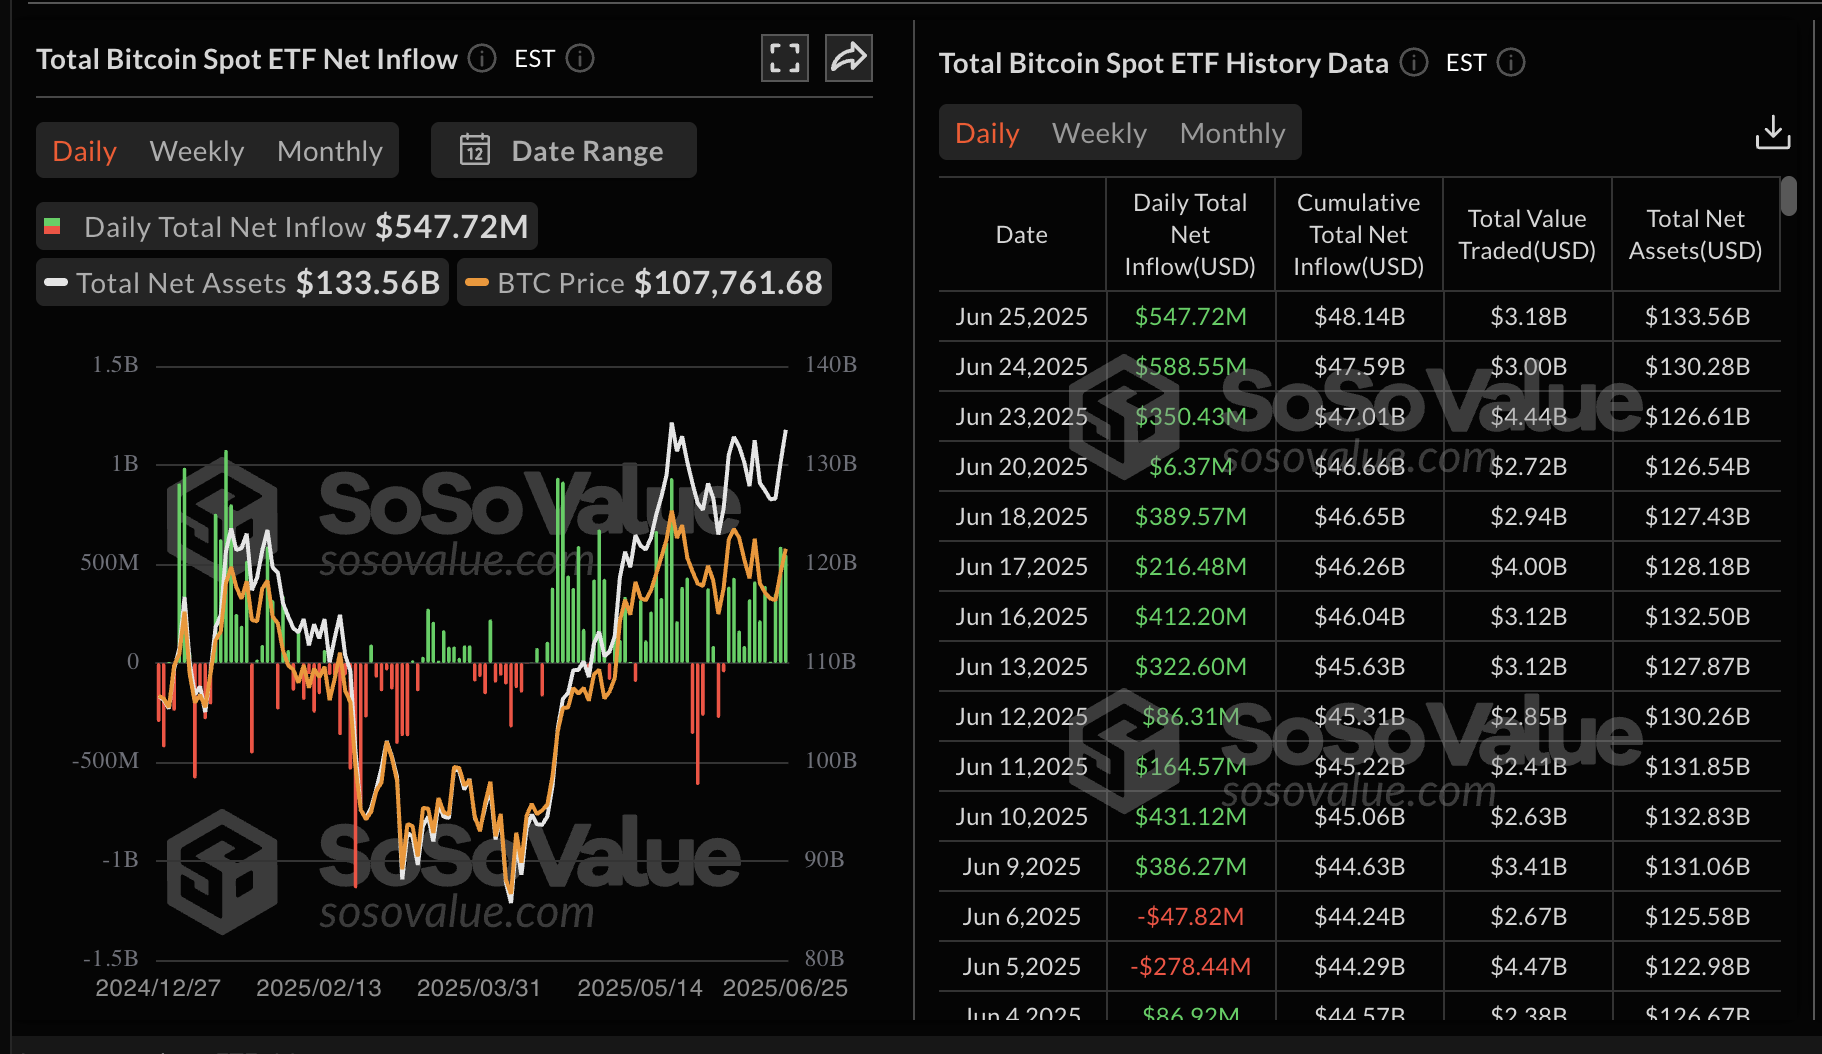
Bitcoin spot ETF data | Source: SoSoValue
Ethereum spot ETFs extended their net inflow streak, with approximately $60 million in new investments recorded on Wednesday. The ETF products now boast over $4.1 billion in total inflow volume, with net assets nearing $10 billion.
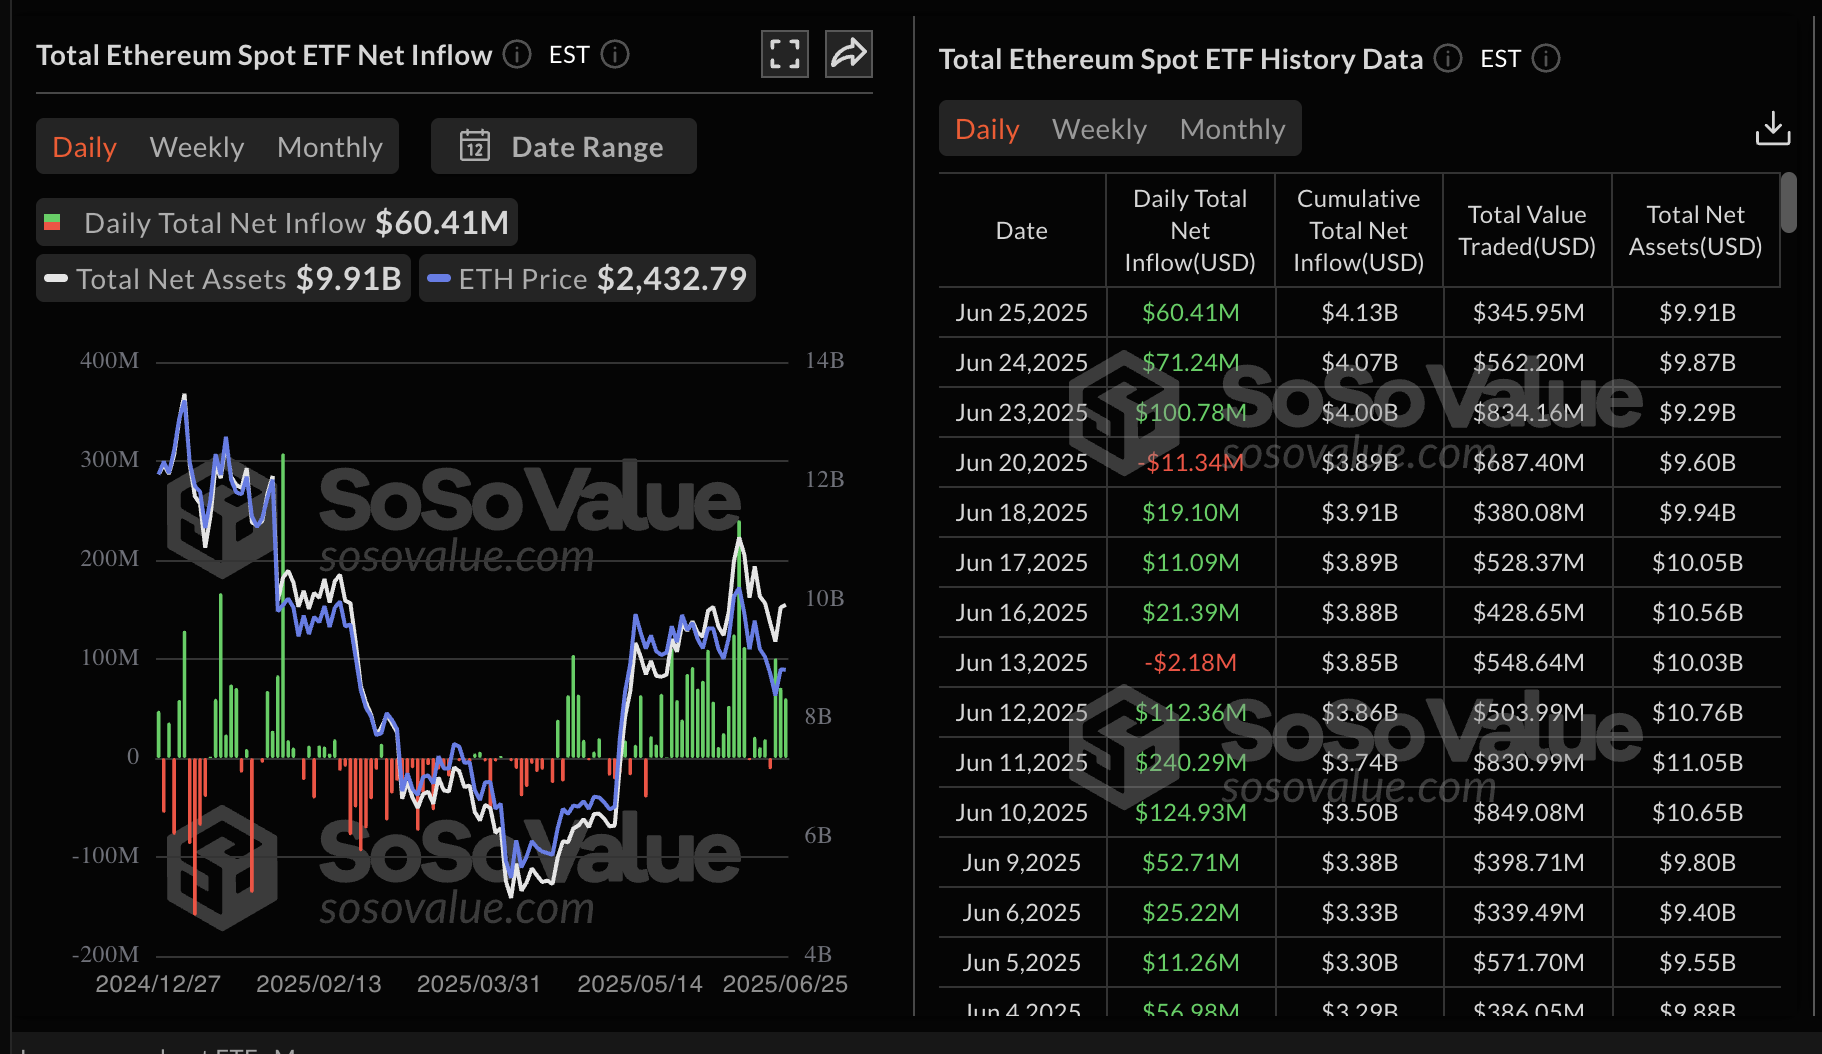
Ethereum spot ETF data | Source: SoSoValue
Chart of the day: Bitcoin consolidates following breakout
Bitcoin's price hovers at around $107,356 at the time of writing, indicating possible consolidation after a remarkable recovery from the sell-off triggered by geopolitical tensions, which had pushed the price down to around $98,227 on Sunday.
Key technical indicators display a bullish structure, as evidenced by the buy signal from the Moving Average Convergence Divergence (MACD) on the 12-hour chart below. The uptrend in BTC was marked by the blue MACD line crossing above the red signal line on Tuesday, confirming bullish momentum and encouraging a higher risk appetite.
The Relative Strength Index (RSI) is in an upward trend, positioned above the midline, signaling bullish momentum. A breakout toward the $110,000 round-number resistance could follow the breakout above the $108,000 resistance, with the RSI approaching overbought territory.
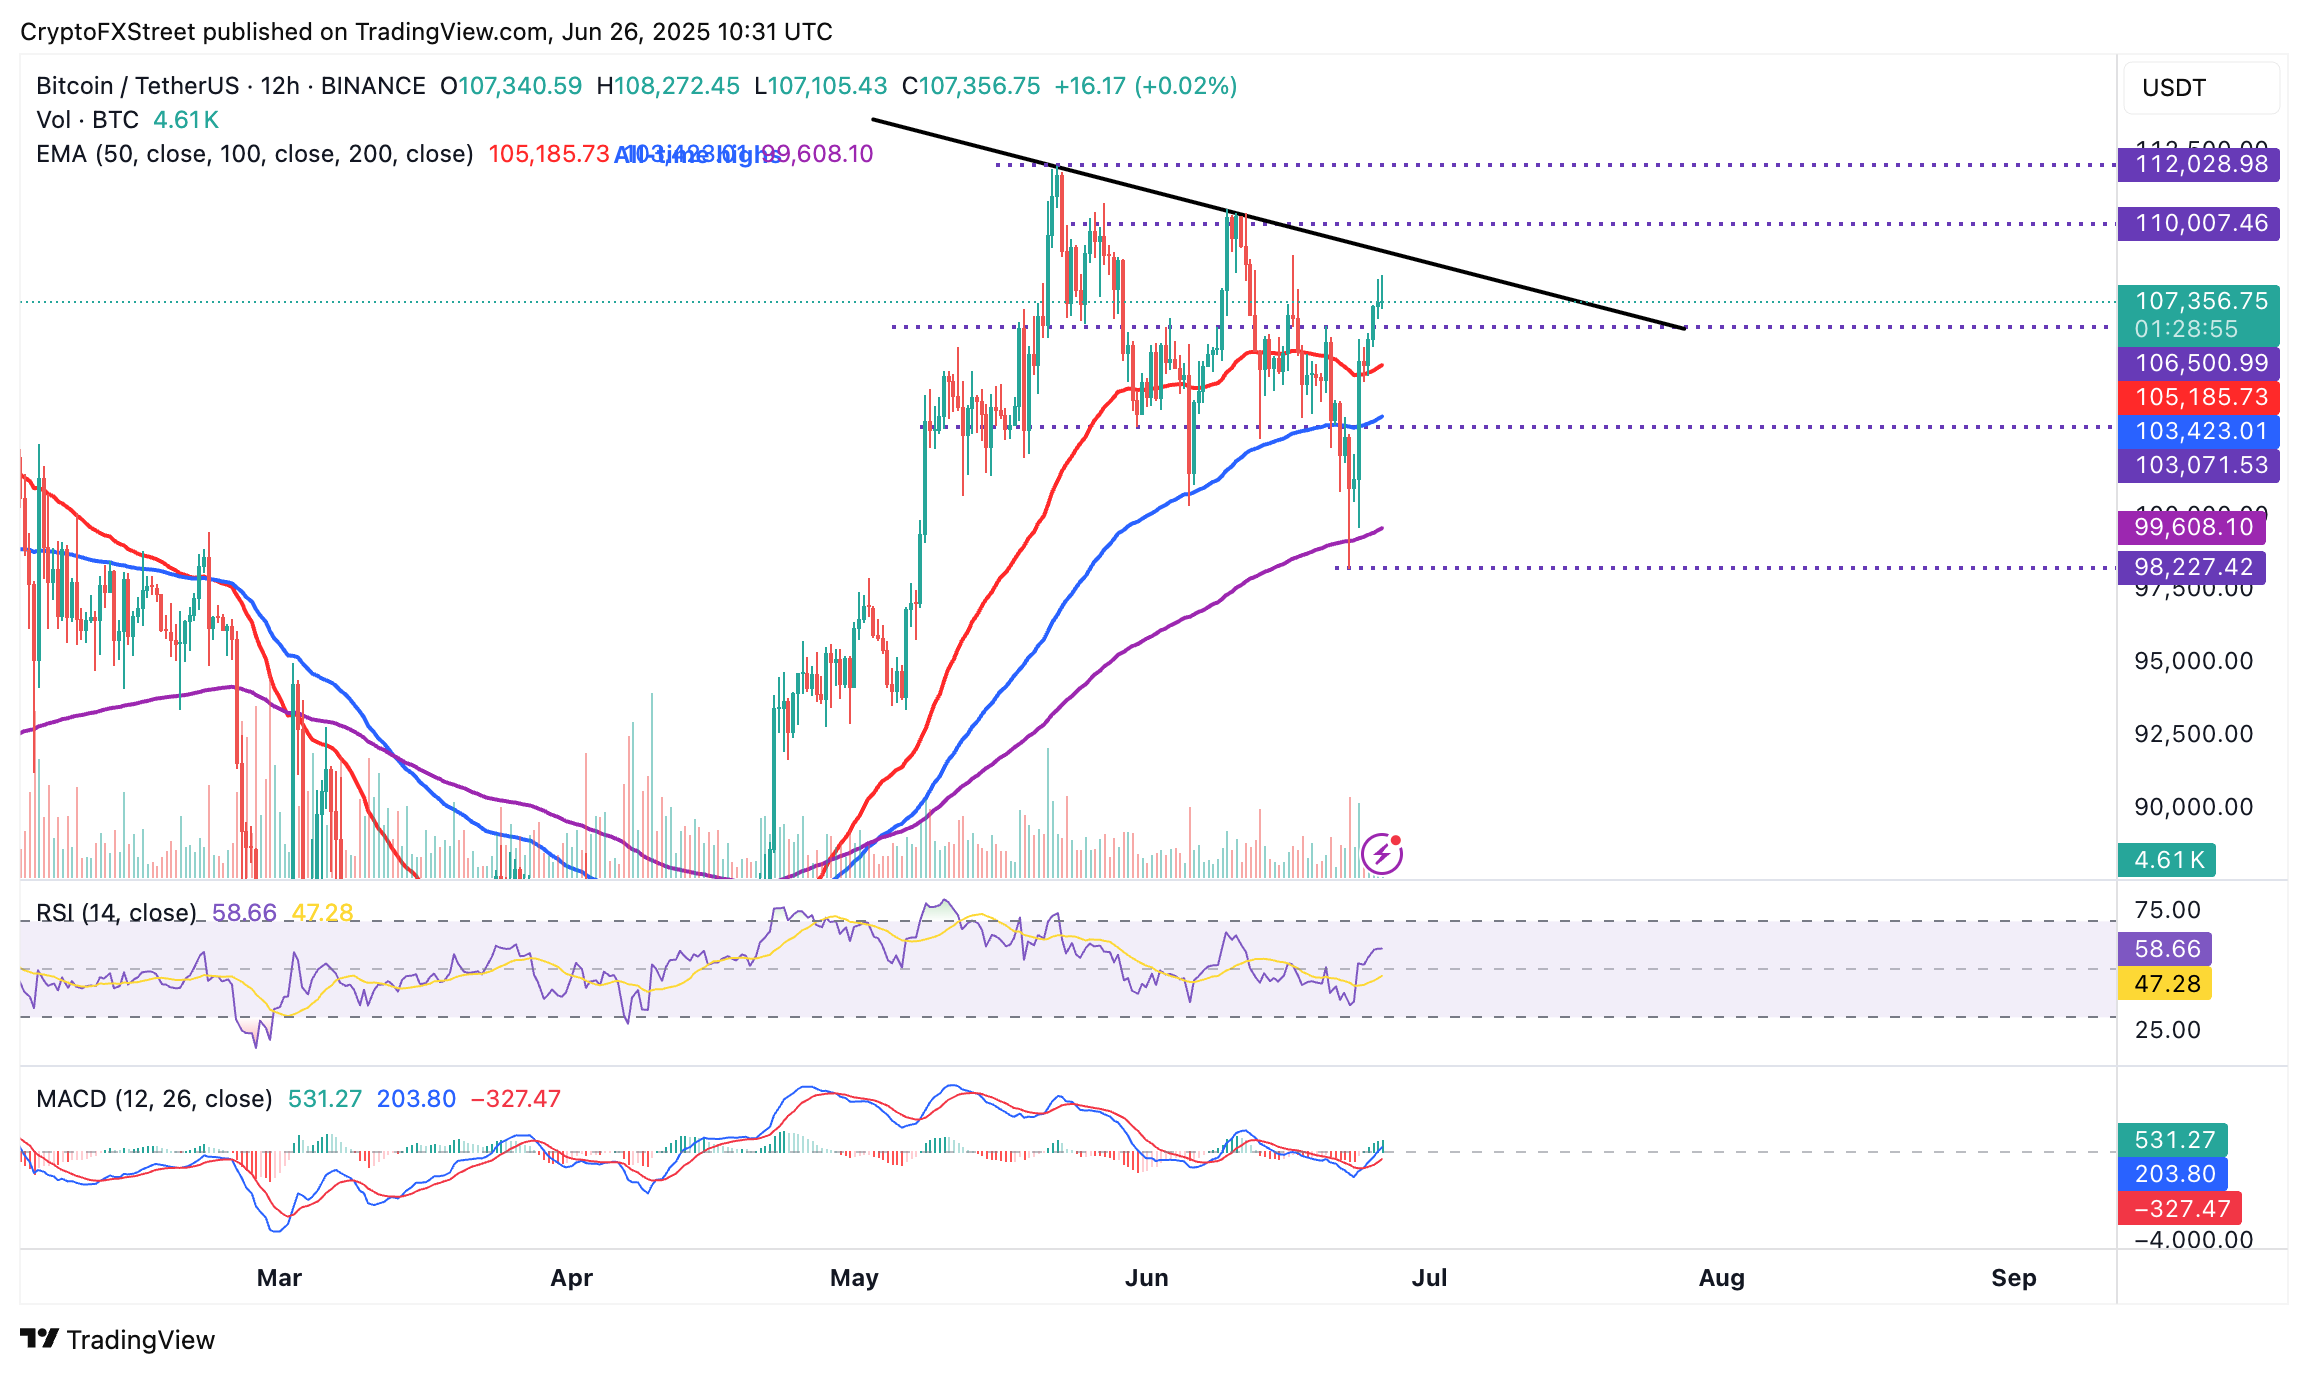
BTC/USDT 12-hour chart
Still, traders may want to focus on tentative support areas, such as the 50-period Exponential Moving Average (EMA) at $105,185, the 100-period EMA at $103,423, and the 200-period EMA at $99,608, in case of a trend reversal.
Altcoins update: Ethereum, XRP extend recovery
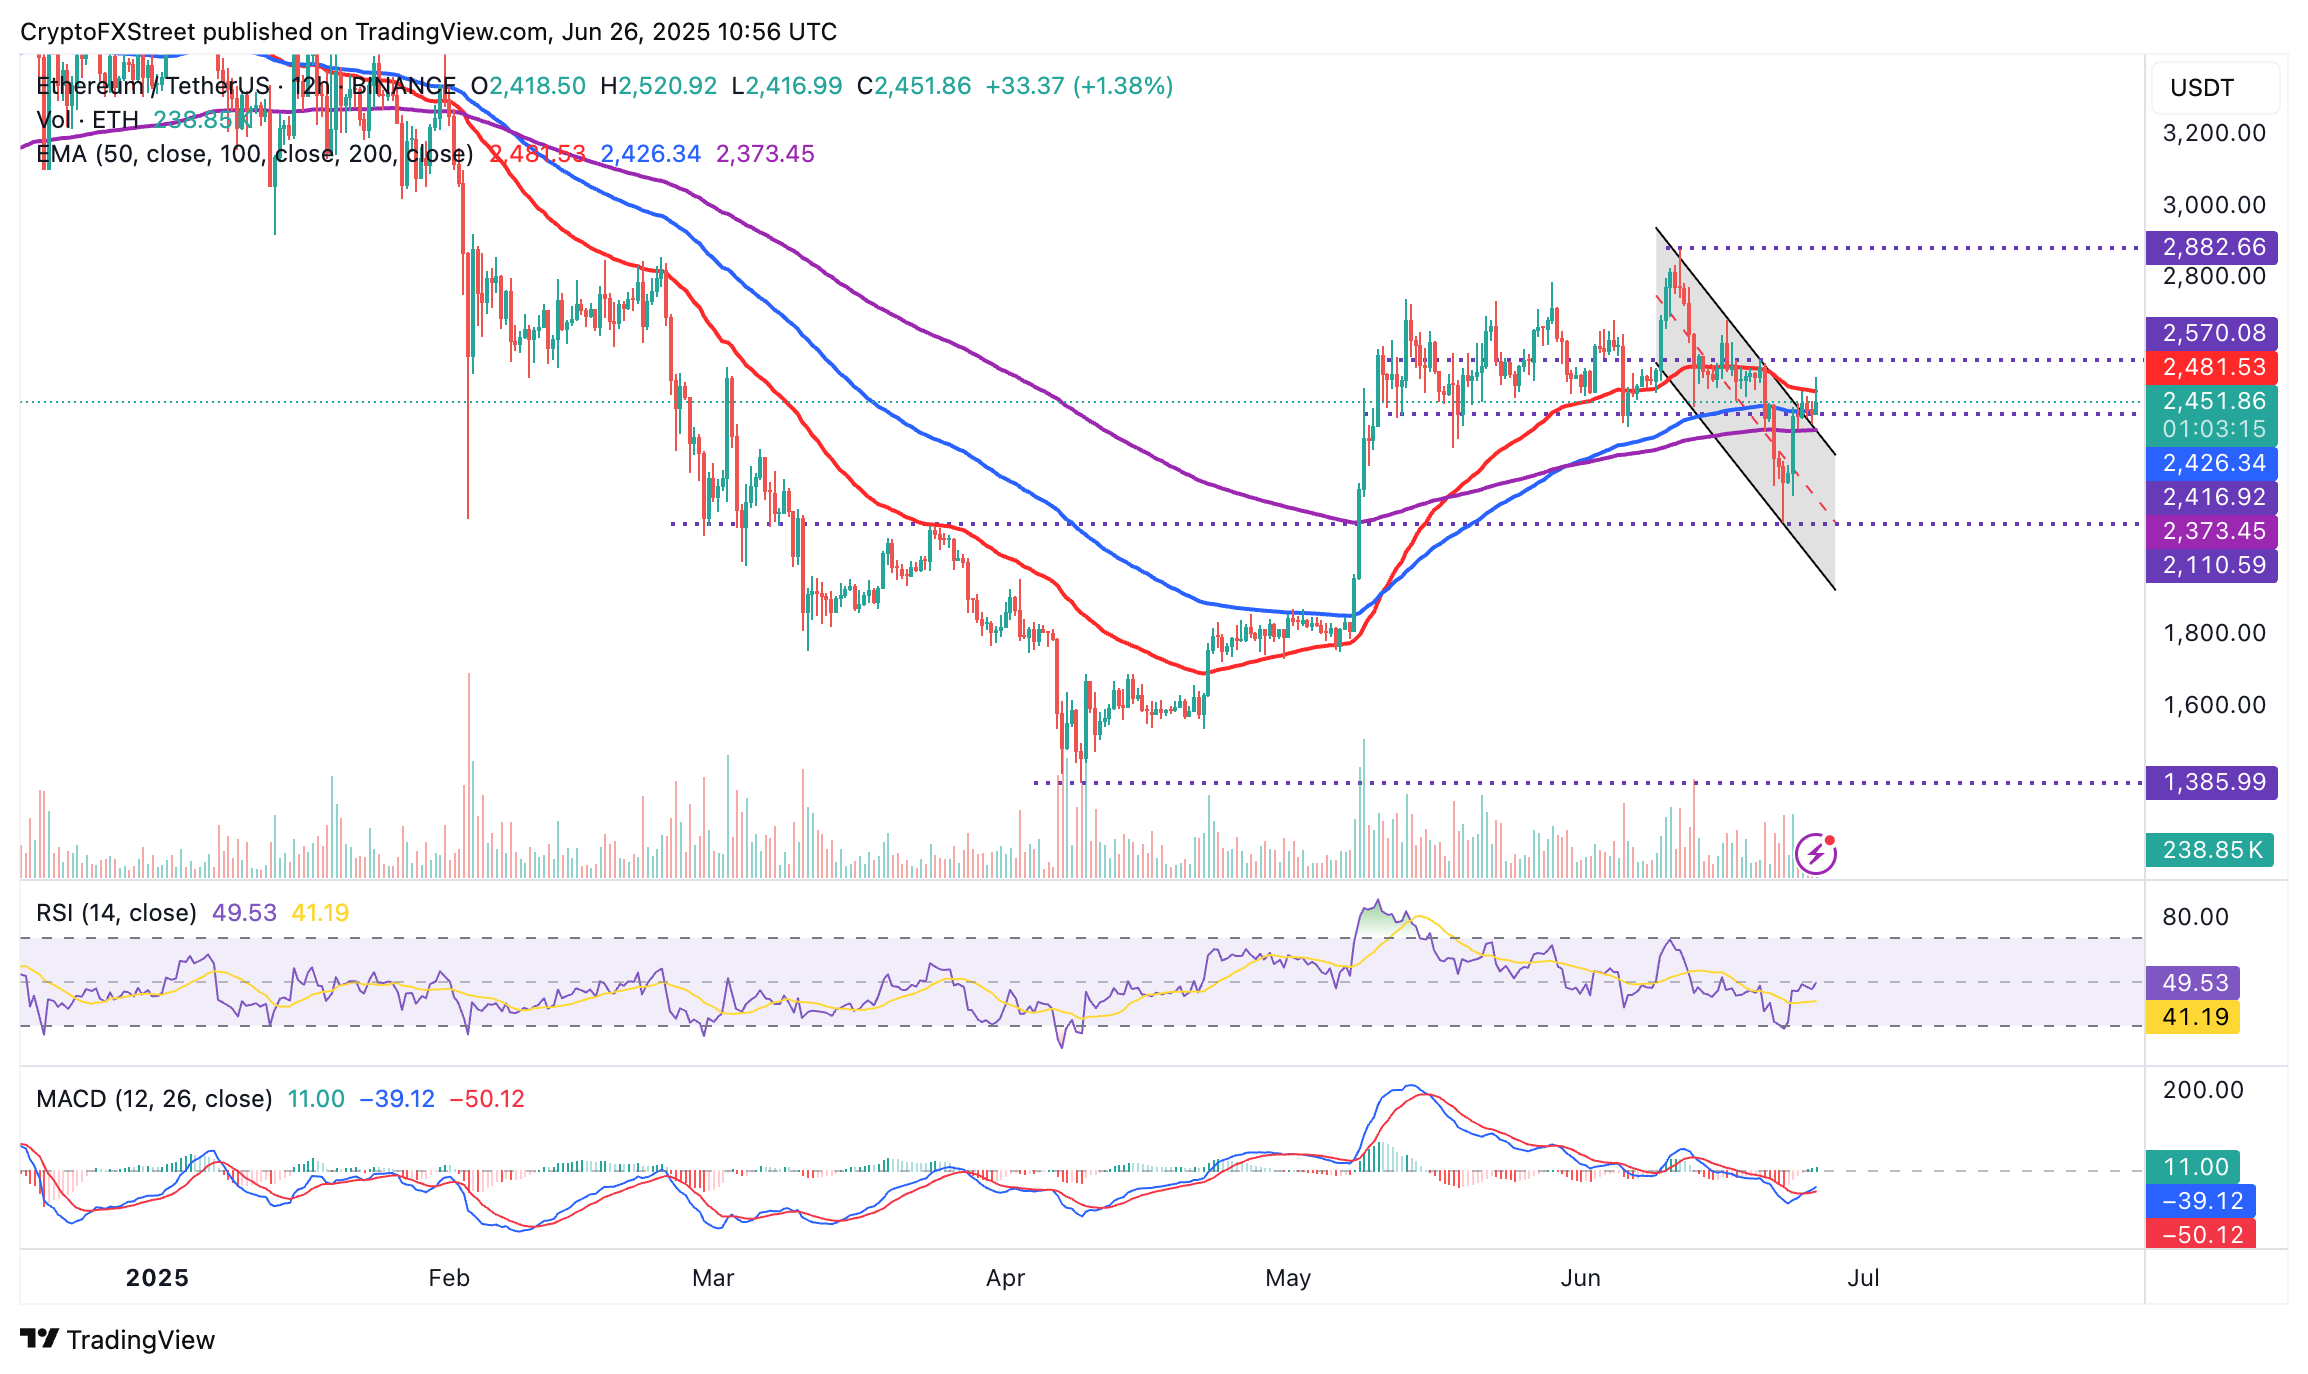
Ethereum's price holds the uptrend steady at around $2,451 at the time of writing. Its downside is protected by the 100-period EMA at $2,426 on the 12-hour chart below, in addition to the 200-period EMA at $2,373.
On the upside, Ethereum faces resistance under the 50-period EMA at $2,481 in the same time frame.
A breakout is anticipated in upcoming sessions or days, particularly due to the MACD buy signal. If traders maintain the heightened risk appetite, the tailwind could receive a boost, targeting higher levels at $2,570, as tested on Friday, and at $2,882, the resistance last tested on June 12.
ETH/USD 12-hour chart
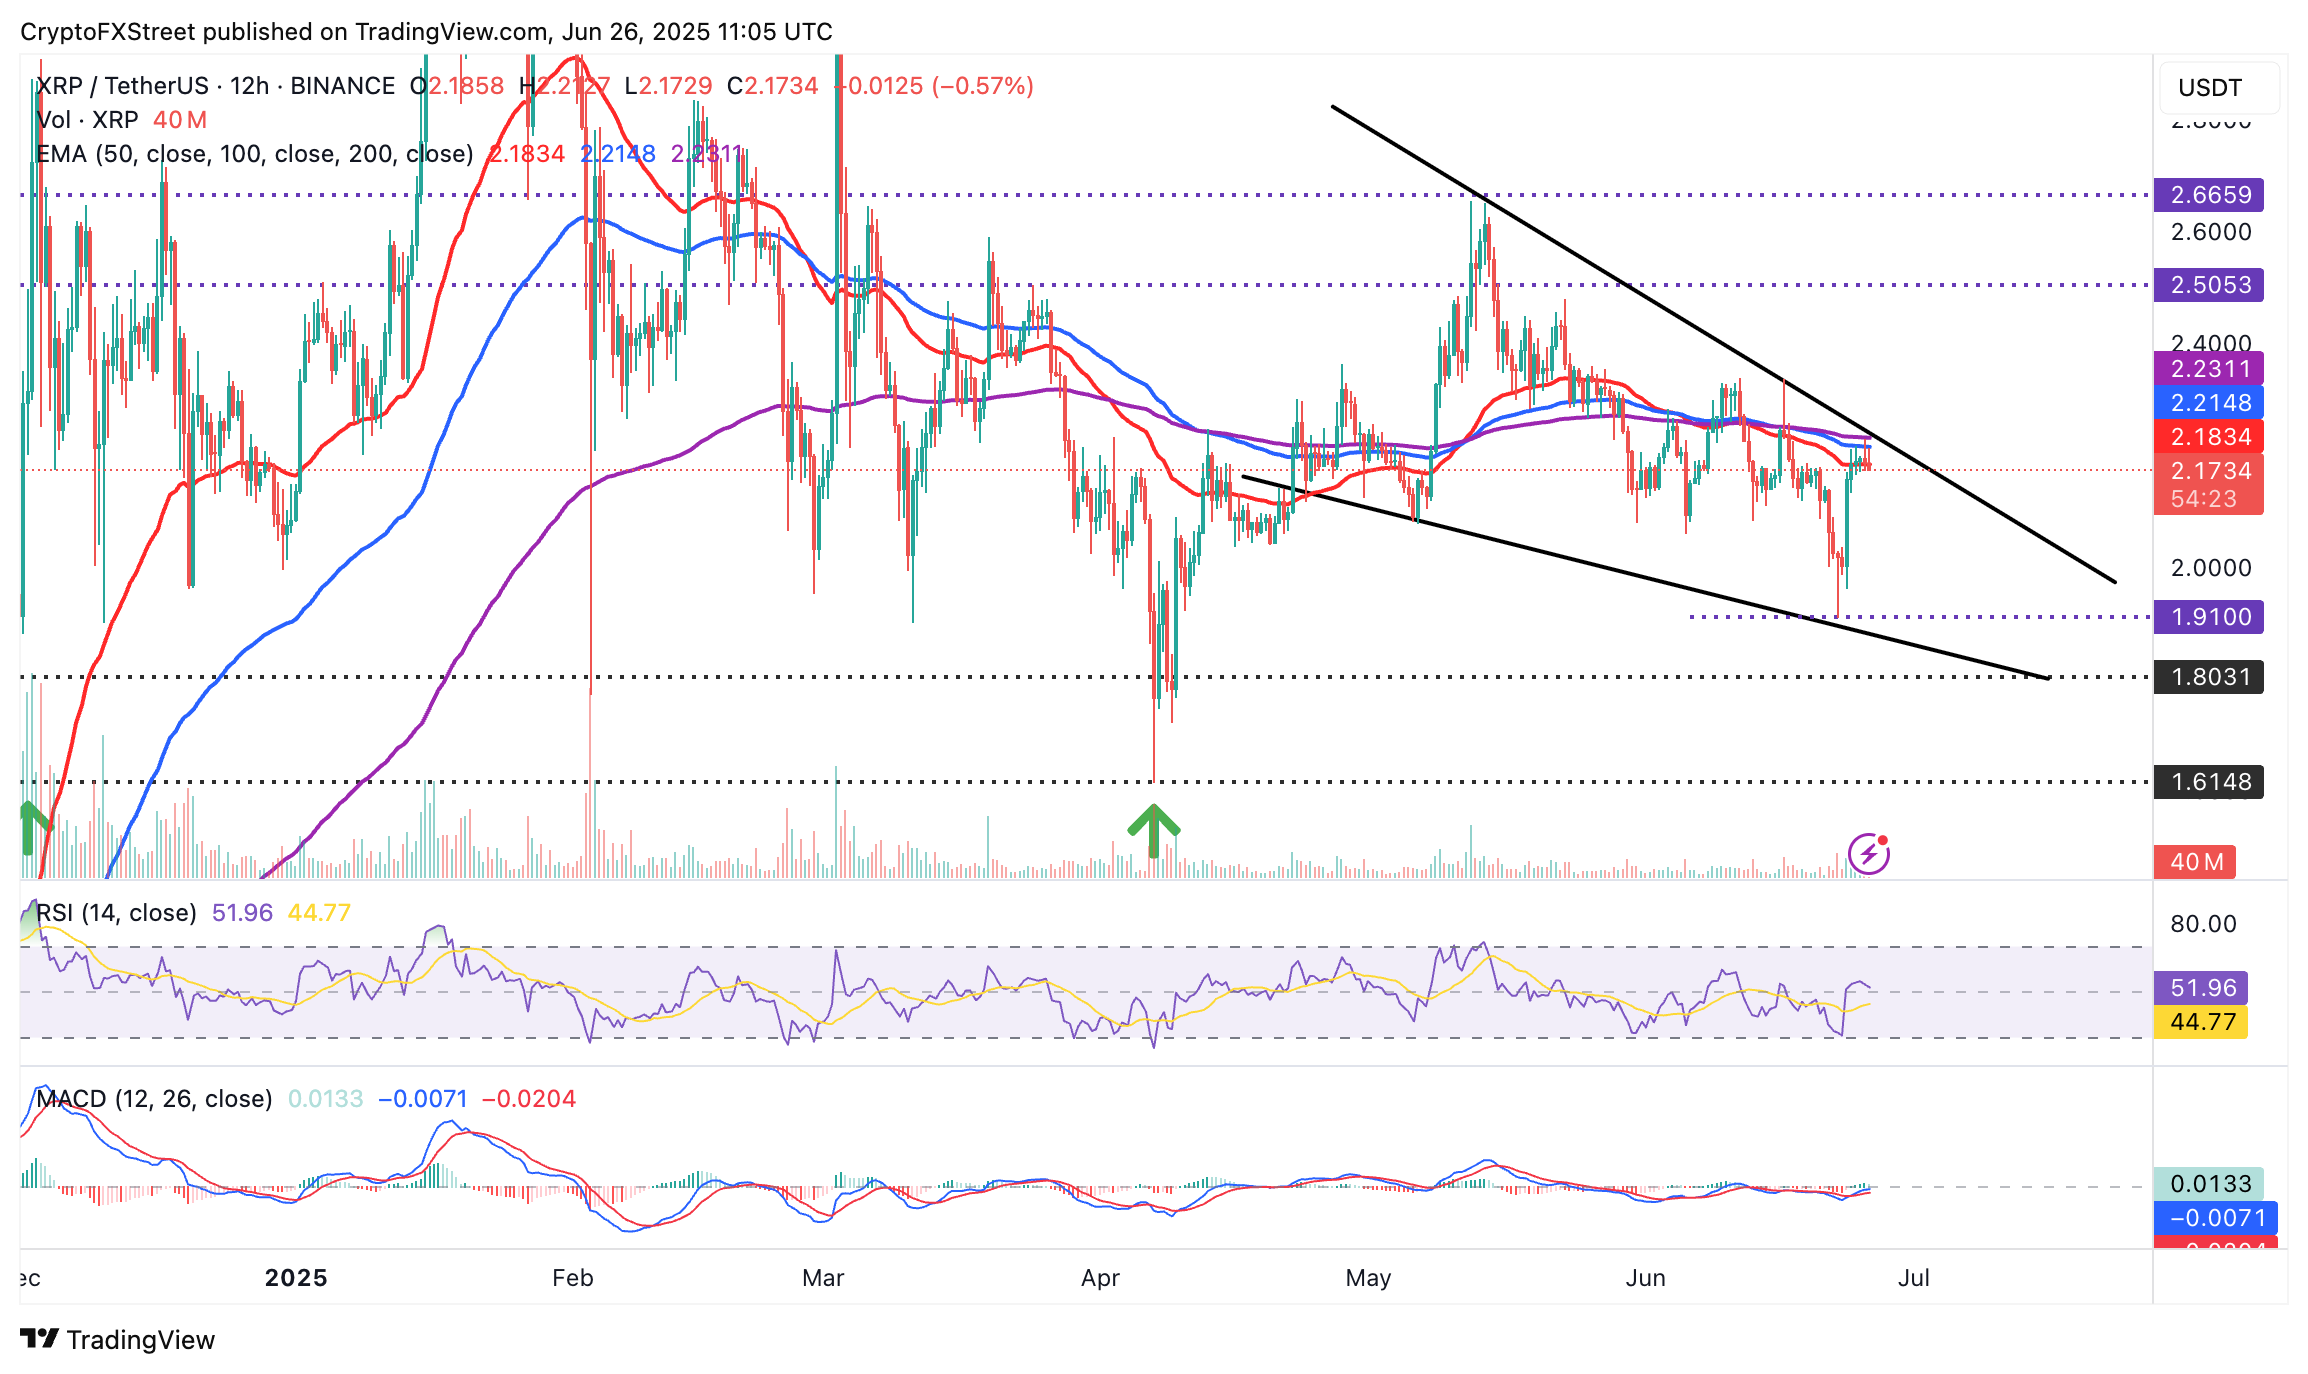
On the other hand, XRP is approaching a potential falling wedge pattern breakout as bulls persistently test resistance highlighted by the 100-period EMA at $2.21 on the 12-hour chart.
Despite the slight drawdown on Thursday to $2.17, the MACD dons a buy signal likely to keep XRP elevated as traders consider seeking exposure.
XRP/USD 12-hour chart
Still, traders may need to temper bullish expectations now that the RSI is falling toward the midline after recovering to 55 on Wednesday. If the decline accelerates below the 50-period EMA at $2.18, key levels to monitor include the round-figure level at $2.00 and the weekend low at $1.91.
Cryptocurrency prices FAQs
Token launches influence demand and adoption among market participants. Listings on crypto exchanges deepen the liquidity for an asset and add new participants to an asset’s network. This is typically bullish for a digital asset.
A hack is an event in which an attacker captures a large volume of the asset from a DeFi bridge or hot wallet of an exchange or any other crypto platform via exploits, bugs or other methods. The exploiter then transfers these tokens out of the exchange platforms to ultimately sell or swap the assets for other cryptocurrencies or stablecoins. Such events often involve an en masse panic triggering a sell-off in the affected assets.
Macroeconomic events like the US Federal Reserve’s decision on interest rates influence crypto assets mainly through the direct impact they have on the US Dollar. An increase in interest rate typically negatively influences Bitcoin and altcoin prices, and vice versa. If the US Dollar index declines, risk assets and associated leverage for trading gets cheaper, in turn driving crypto prices higher.
Halvings are typically considered bullish events as they slash the block reward in half for miners, constricting the supply of the asset. At consistent demand if the supply reduces, the asset’s price climbs.
Recommended Articles


