
Bitcoin Weekly Forecast: BTC eyes a drop toward $100,000 amid cautious sentiment as Middle East tensions escalate
- Bitcoin price edges below $105,000 on Friday after falling 4% over the last two days.
- Market sentiment sours as conflict in the Middle East escalates, with over $1.15 billion in liquidation across crypto markets.
- The demand for BTC from public companies remains strong despite the prevailing capital preservation mode in the crypto market.
Bitcoin (BTC) price edges below $105,000 at the time of writing on Friday, extending the consecutive two-day drop this week. The largest cryptocurrency by market capitalization enters a cautious stance as tensions between Israel and Iran weigh on global risk sentiment. This increase in risk aversion has triggered a wave of liquidations exceeding $1.15 billion across cryptocurrency markets. Despite the overall gloomy market mood, public companies' demand for BTC continues to strengthen as of this week.
Bitcoin tumbles as geopolitical tensions rise
Bitcoin price faces three consecutive days of pullback this week, starting on Wednesday, and reaches a low of $102,664 as of Friday. The rising conflict in the Middle East between Israel and Iran fueled this ongoing correction.
According to the New York Times report on Thursday, Israel seemed to be preparing to launch an attack soon on Iran, according to officials in the United States and Europe.
The report further explained that this step could further inflame the Middle East and derail or delay efforts by the US President Donald Trump administration to broker a deal to cut off Iran’s path to building a nuclear bomb. The rising tensions of this conflict led the US to withdraw diplomats from Iraq and authorize the voluntary departure of US military family members from the Middle East. Iran’s Defense Minister Aziz Nasirzadeh warned that any attack by Israel or the US would result in strikes on US bases in the region.
Early on Friday morning, Israel launched airstrikes against Iran’s nuclear program and military targets, reports Bloomberg.

Iran says it will respond "harshly" against Israel and the US following these attacks. These ongoing geopolitical risks have triggered risk-off flows in the market, which do not bode well for riskier assets, such as Bitcoin, which saw massive liquidations of over $448 million and a total liquidation value of $1.15 billion in the cryptocurrency markets over the last 24 hours.
Bitcoin price declines as trade uncertainty rises
Bitcoin price started the week on a positive note, following the news of the US-China trade deal in London during the first half of the week. BTC rose over 4% on Monday, closing at $110,263, just 1.56% shy of its all-time high. However, the positive development surrounding the US-China trade war proved short-lived in the wake of US President Donald Trump's fresh tariff threats on Wednesday.
Trump said he would impose unilateral tariff rates and notify trading partners within two weeks, ahead of the July 9 deadline. This added a layer of uncertainty and overshadowed the optimism led by a positive tone following US-China trade talks in London.
Trade uncertainty gave rise to a cautious investor mood in the market, resulting in a decline in the prices of riskier assets.
US macroeconomic data fail to support the Bitcoin price
Major US macroeconomic data was released this week. On Wednesday, the May US Consumer Price Index (CPI) data was released. The inflation data came in slightly softer than expected, especially the core month-on-month (MoM) reading, which the US Federal Reserve (Fed) closely watches. Markets may take this as a signal that inflation is cooling, leading to less urgency for interest rate cuts.
Later on Thursday, mild Producer Price Index (PPI) numbers, indicating easing pressures from producers, also supported the case that inflation pressures are not re-accelerating.
-1749803100503.png)
Despite these economic data releases supporting a bullish environment for Bitcoin in the coming week, macro investors may now increase their allocation to riskier assets, given the reduced inflation fears and increased likelihood of monetary easing. However, in the short term, it failed to provide support to the largest cryptocurrency by market capitalization.
Some signs of optimism
Despite the increase in risk aversion, public companies' demand for BTC remained resilient. Mercurity Fintech Holding Inc. (MFH) announced on Wednesday its plans to raise $800 million to establish a long-term Bitcoin treasury reserve.
On the same day, GameStop announced its plans to raise $1.75 billion through a private offering of 0.00% Convertible Senior Notes due 2032. Later on Thursday, GameStop announced the pricing of its $2.25 billion upsized private offering of 0.00% Convertible Senior Notes due 2032, with an option to sell an additional $450 million. The firm had added 4,710 BTC between May 3 and June 10, which followed its $1.3 billion convertible note offering issued in March.
The companies’ interest in Bitcoin indicates a growing acceptance of BTC as a strategic asset, boosting its legitimacy and potentially driving long-term adoption.
Institutional demand for Bitcoin has remained strong so far this week. According to SoSoValue data, US spot Bitcoin Exchange Traded Funds (ETFs) recorded a total inflow of $1.07 billion until Thursday, breaking their two-week streak of outflows.
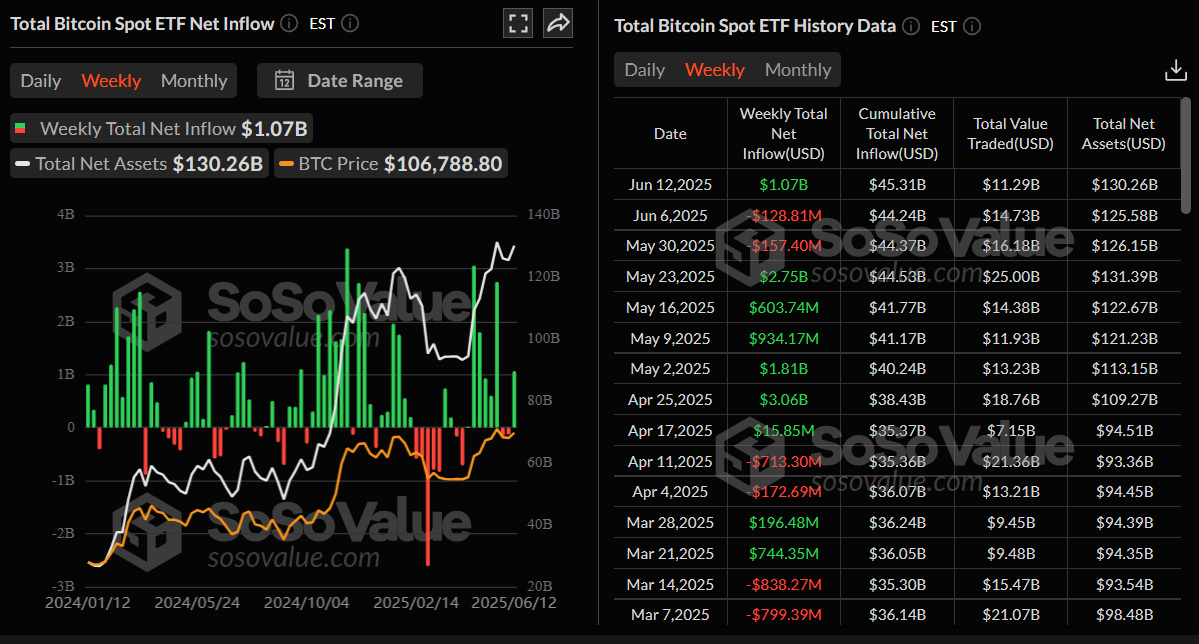
Total Bitcoin spot ETFs weekly chart. Source: SoSoValue
Is BTC out of the woods?
Bitcoin price failed to retest its all-time high of $111,980 following a sharp rally on Monday and declined slightly until Wednesday. It continued its correction on Thursday, closing below the daily support at $106,406. At the time of writing on Friday, it extends its losses and rebounds after retesting the 50-day Exponential Moving Average at $102,447.
If BTC closes below the 50-day EMA at $102,447, it could extend the decline to retest its psychologically important level of $100,000.
The Relative Strength Index (RSI) slips below its neutral level of 50, reading 47, indicating increasing bearish momentum. The Moving Average Convergence Divergence (MACD) indicator displayed a bearish crossover on Thursday, issuing a sell signal and indicating a downward trend.
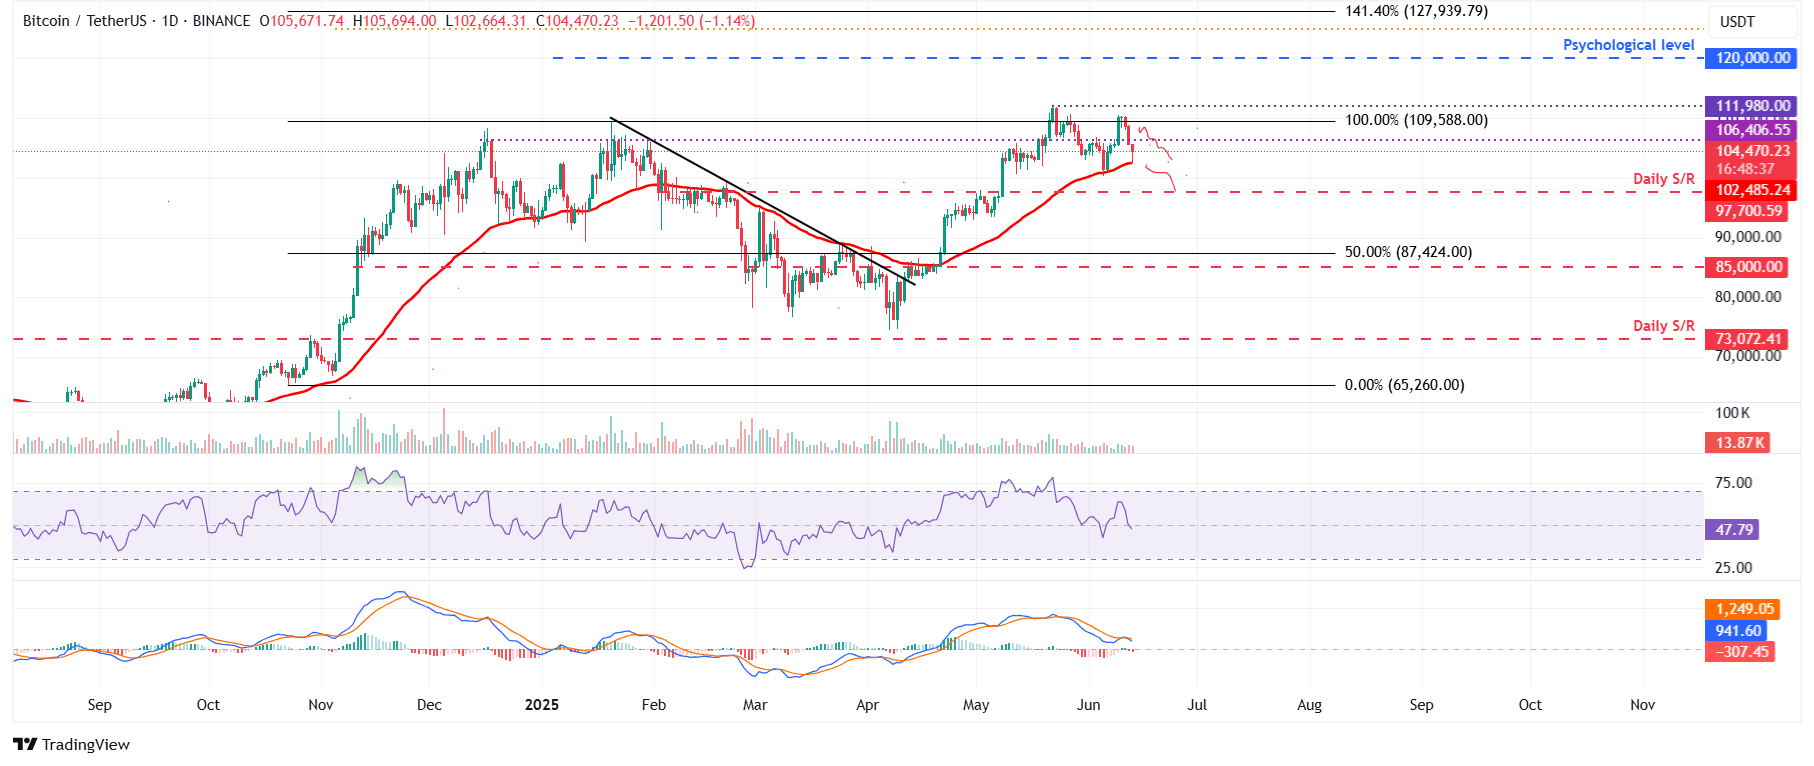
BTC/USDT daily chart
However, if BTC recovers, it could extend the recovery to retest its daily level of $106,406.
Recommended Articles


