Dogecoin, Shiba Inu, and Pepe meme coins signal fading bullish momentum

Source Fxstreet
  • Dogecoin price hovers around $0.19 after falling nearly 14% the previous week.
  • Shiba Inu closes below its 50-day EMA, suggesting a potential double-digit decline could unfold.
  • Pepe holds above critical support at $0.0000115; a decisive break lower may trigger further downside pressure.

Meme coins, Dogecoin (DOGE), Shiba Inu (SHIB), and Pepe (PEPE) are under pressure as the broader crypto market struggles to regain momentum. DOGE and SHIB exhibit signs of weakness following a close below their key levels, while PEPE clings to a crucial support level, with a breakdown likely to accelerate its ongoing correction.

Dogecoin could extend its downleg if it closes below $0.18

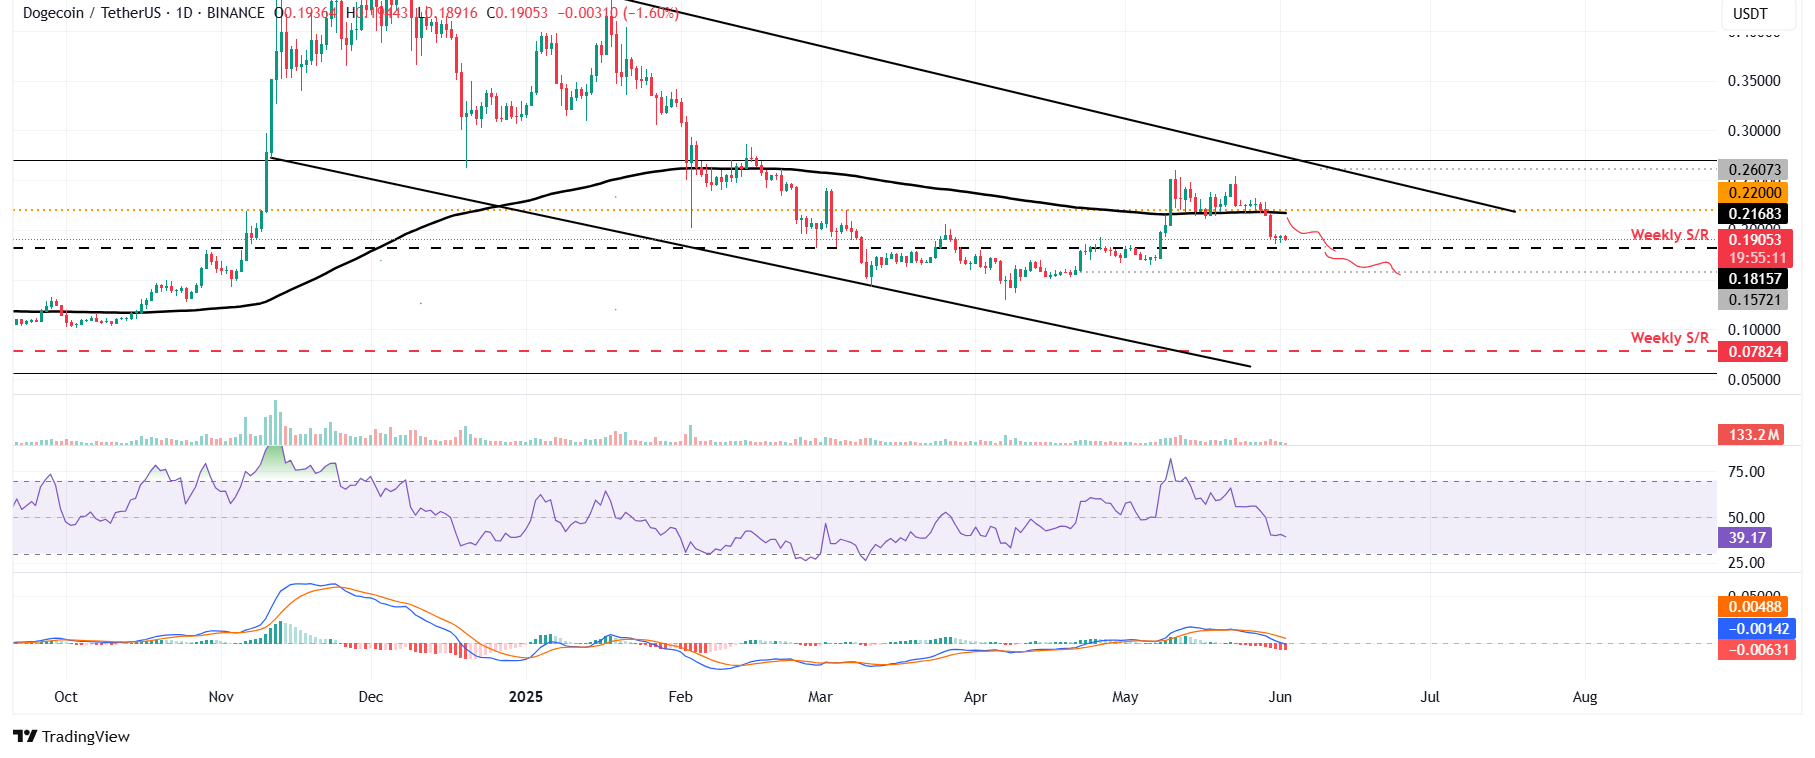
Dogecoin price closed below its 200-day Exponential Moving Average (EMA) at $0.21 on Thursday and declined by nearly 10% the next day. At the time of writing on Monday, it trades lower, approaching its weekly support at $0.18.

If DOGE corrects and closes below its weekly level at $0.18 on a daily basis, it could extend the decline to the next support level at $0.15.

The Relative Strength Index (RSI) on the daily chart reads 39, below its neutral level of 50, indicating bearish momentum. The Moving Average Convergence Divergence (MACD) indicator also displayed a bearish crossover, indicating a potential sell signal and a correction ahead.
DOGE/USDT daily chart

DOGE/USDT daily chart

If DOGE recovers, it could extend the recovery to retest its 200-day EMA at $0.21.

Shiba Inu bears could extend a 10% decline 

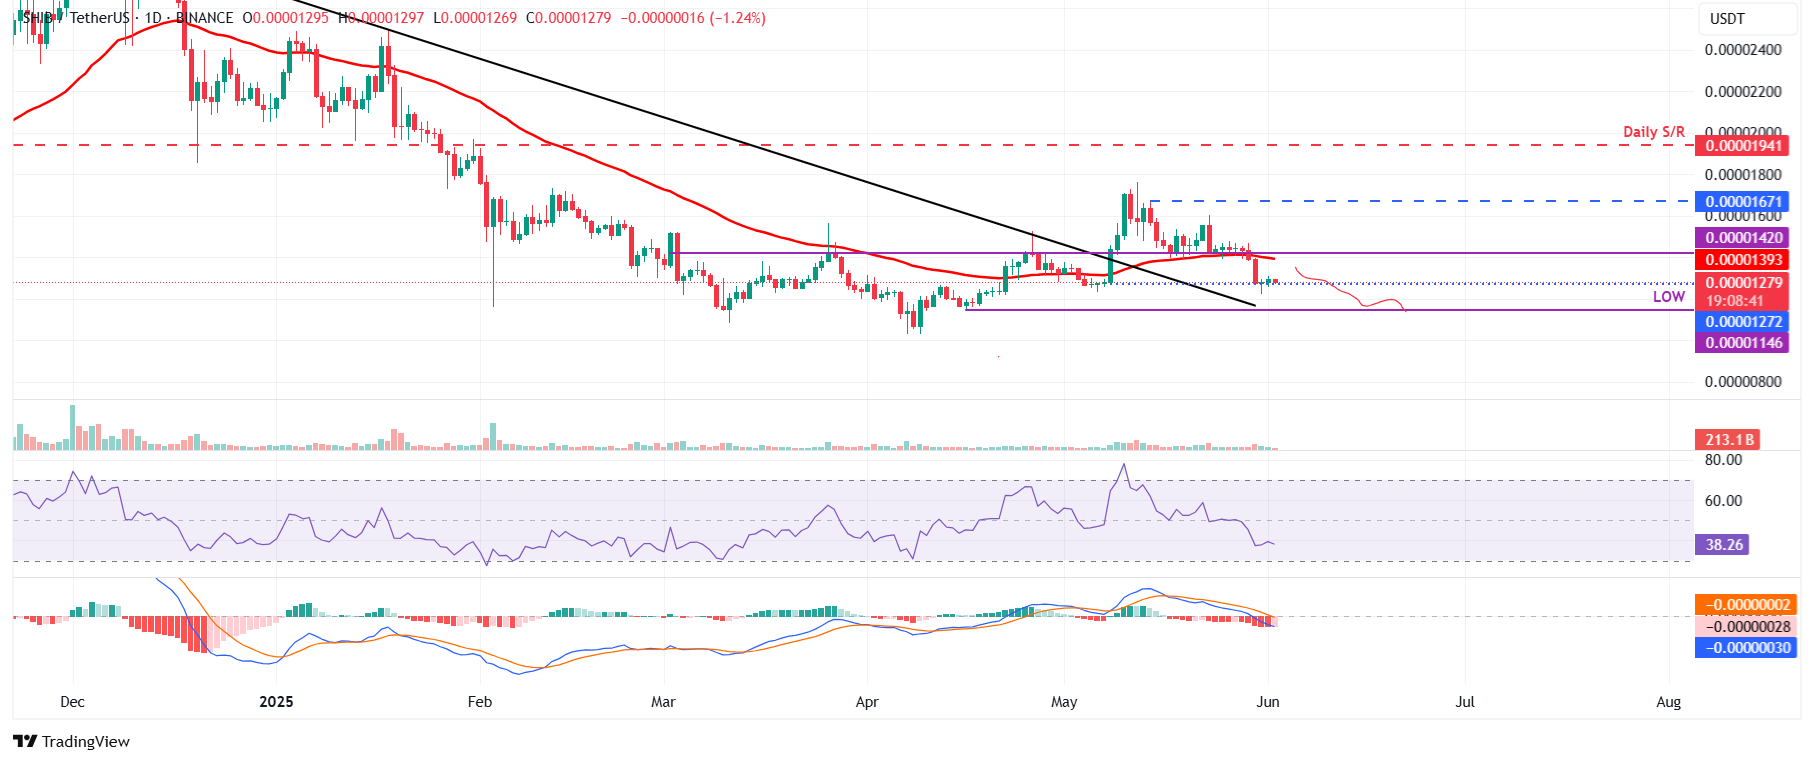
Shiba Inu price closed below its 50-day EMA at $0.0000139 on Thursday and declined by 8.13% the following day. At the time of writing on Monday, it hovers at around $0.0000127.

If the 50-day EMA holds as resistance, SHIB could extend its decline by 10% from its current levels, potentially retesting its April 16 low of $0.0000114.

The RSI on the daily chart reads 38, below its neutral level of 50, indicating bearish momentum. The MACD indicator also displayed a bearish crossover. It also shows rising red histogram bars below its neutral level, indicating a correction ahead.
SHIB/USDT daily chart

SHIB/USDT daily chart

If SHIB recovers, it could extend the recovery to retest its 50-day EMA at $0.0000139.

Pepe bearish momentum gains traction

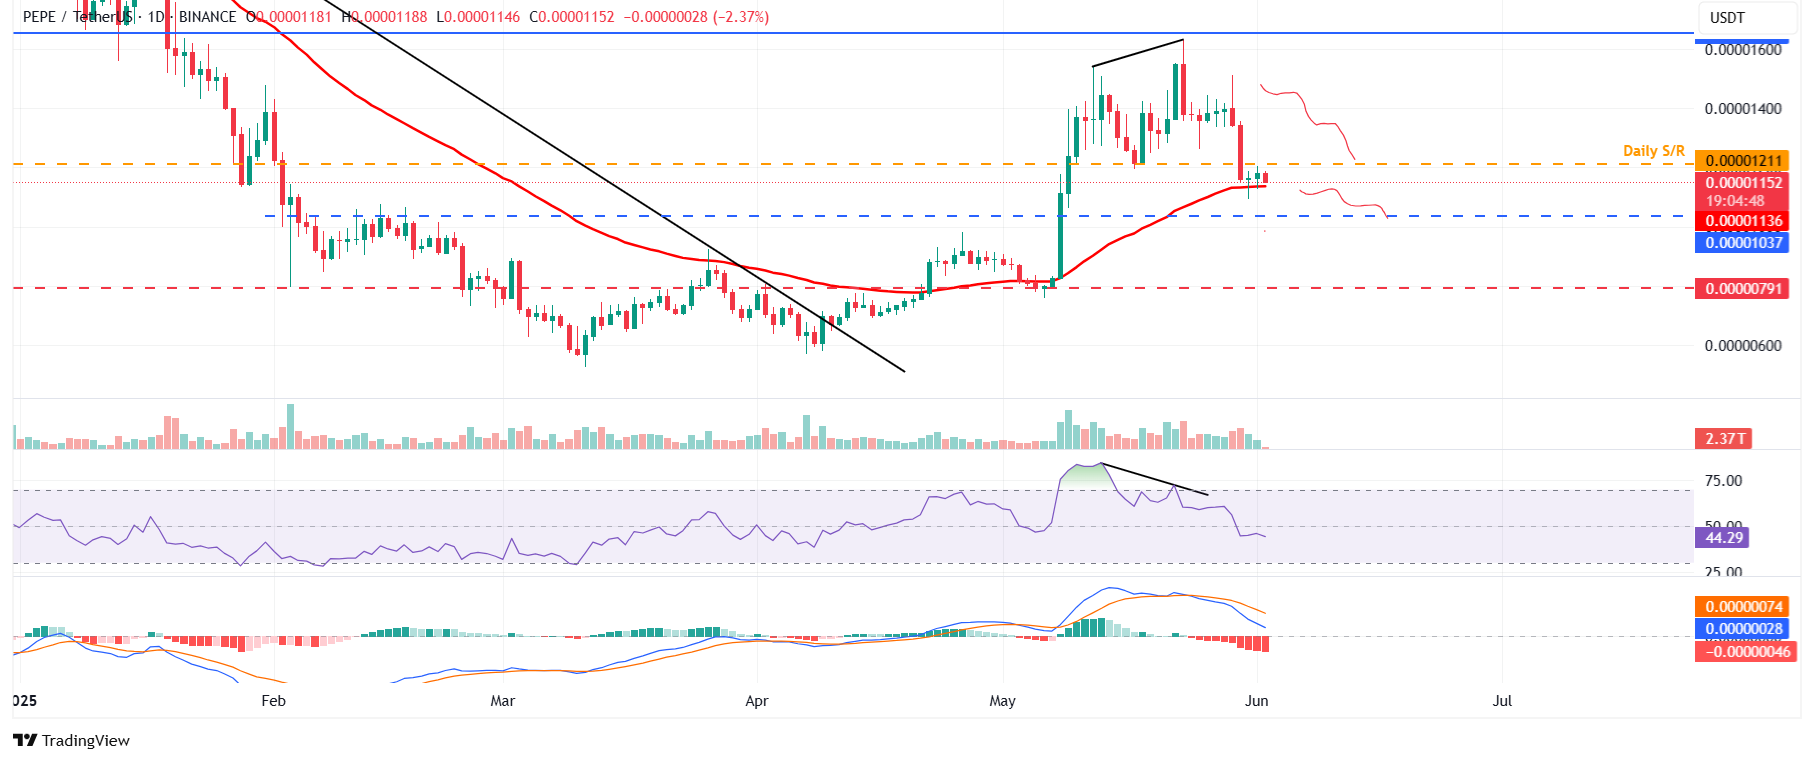
Pepe price declined by more than 13% last week as a bearish divergence played out. However, it retested and found support around its 50-day EMA at $0.0000113 on the weekend. At the time of writing, it trades around $0.0000115.

If PEPE closes below the 50-day EMA, it could extend the decline to retest its next daily support at $0.0000103.

The RSI on the daily chart reads 44, below its neutral level of 50, indicating bearish momentum. The MACD indicator also displayed a bearish crossover. It also shows rising red histogram bars below its zero line, indicating a correction ahead.
PEPE/USDT daily chart

PEPE/USDT daily chart

However, if the PEPE price finds support around its 50-day EMA at $0.0000113, it could extend the recovery to retest its daily resistance level at $0.0000121.

Disclaimer: For information purposes only. Past performance is not indicative of future results.
placeholder
EUR/USD Price Forecast: Bounces off 1.1300 neighborhood; shows resilience below 23.6% Fibo.The EUR/USD pair attracts some follow-through selling for the second straight day on Wednesday and drops to a one-week low during the Asian session. Spot prices, however, rebound a few pips from the 1.1300 neighborhood and currently trade around the 1.1380 region, still down over 0.35% for the day.
Author  FXStreet
4 Month 23 Day Wed
The EUR/USD pair attracts some follow-through selling for the second straight day on Wednesday and drops to a one-week low during the Asian session. Spot prices, however, rebound a few pips from the 1.1300 neighborhood and currently trade around the 1.1380 region, still down over 0.35% for the day.
placeholder
Bitcoin Must Clear This Critical Cost Basis Level For Continued Upside, Analyst SaysIn a recent CryptoQuant Quicktake post, contributor Crazzyblockk highlighted key Bitcoin (BTC) cost basis zones that the leading cryptocurrency must clear – or avoid breaking below – to
Author  NewsBTC
4 Month 23 Day Wed
In a recent CryptoQuant Quicktake post, contributor Crazzyblockk highlighted key Bitcoin (BTC) cost basis zones that the leading cryptocurrency must clear – or avoid breaking below – to
placeholder
US Dollar Index surges toward 99.00, rebounds from six-week lowsThe US Dollar Index (DXY), which measures the value of the US Dollar (USD) against six major currencies, has rebounded from a six-week low of 98.58 and is trading higher near 98.90 during the Asian hours on Tuesday. Traders would likely observe the release of the JOLTS Job Openings later on Tuesday.
Author  FXStreet
21 hours ago
The US Dollar Index (DXY), which measures the value of the US Dollar (USD) against six major currencies, has rebounded from a six-week low of 98.58 and is trading higher near 98.90 during the Asian hours on Tuesday. Traders would likely observe the release of the JOLTS Job Openings later on Tuesday.
placeholder
BNB Price Forecast: BNB recovery receives boost as trading volume hits $11.35 billion, highest yearly levelBNB (BNB) is extending its recovery, trading around $670 on Tuesday after rebounding from a key level over the weekend. On-chain data and technical outlook suggest a rally ahead as BNB breaks above the symmetrical triangle pattern, with ecosystem trading volume and stablecoin activity surging.
Author  FXStreet
21 hours ago
BNB (BNB) is extending its recovery, trading around $670 on Tuesday after rebounding from a key level over the weekend. On-chain data and technical outlook suggest a rally ahead as BNB breaks above the symmetrical triangle pattern, with ecosystem trading volume and stablecoin activity surging.
placeholder
Solana Down 13%, But This Indicator Just Turned BullishAn analyst has pointed out how Solana has recently formed a signal on the Tom Demark (TD) Sequential that could imply a potential reversal for the asset’s price. Solana Has Seen A TD Sequential
Author  NewsBTC
21 hours ago
An analyst has pointed out how Solana has recently formed a signal on the Tom Demark (TD) Sequential that could imply a potential reversal for the asset’s price. Solana Has Seen A TD Sequential
Related Instrument
goTop
quote