Pepe Price Forecast: PEPE at risk of a bearish holiday season as whales offload

Source Fxstreet
  • Pepe declines on Wednesday, extending the 2% loss from the previous day.
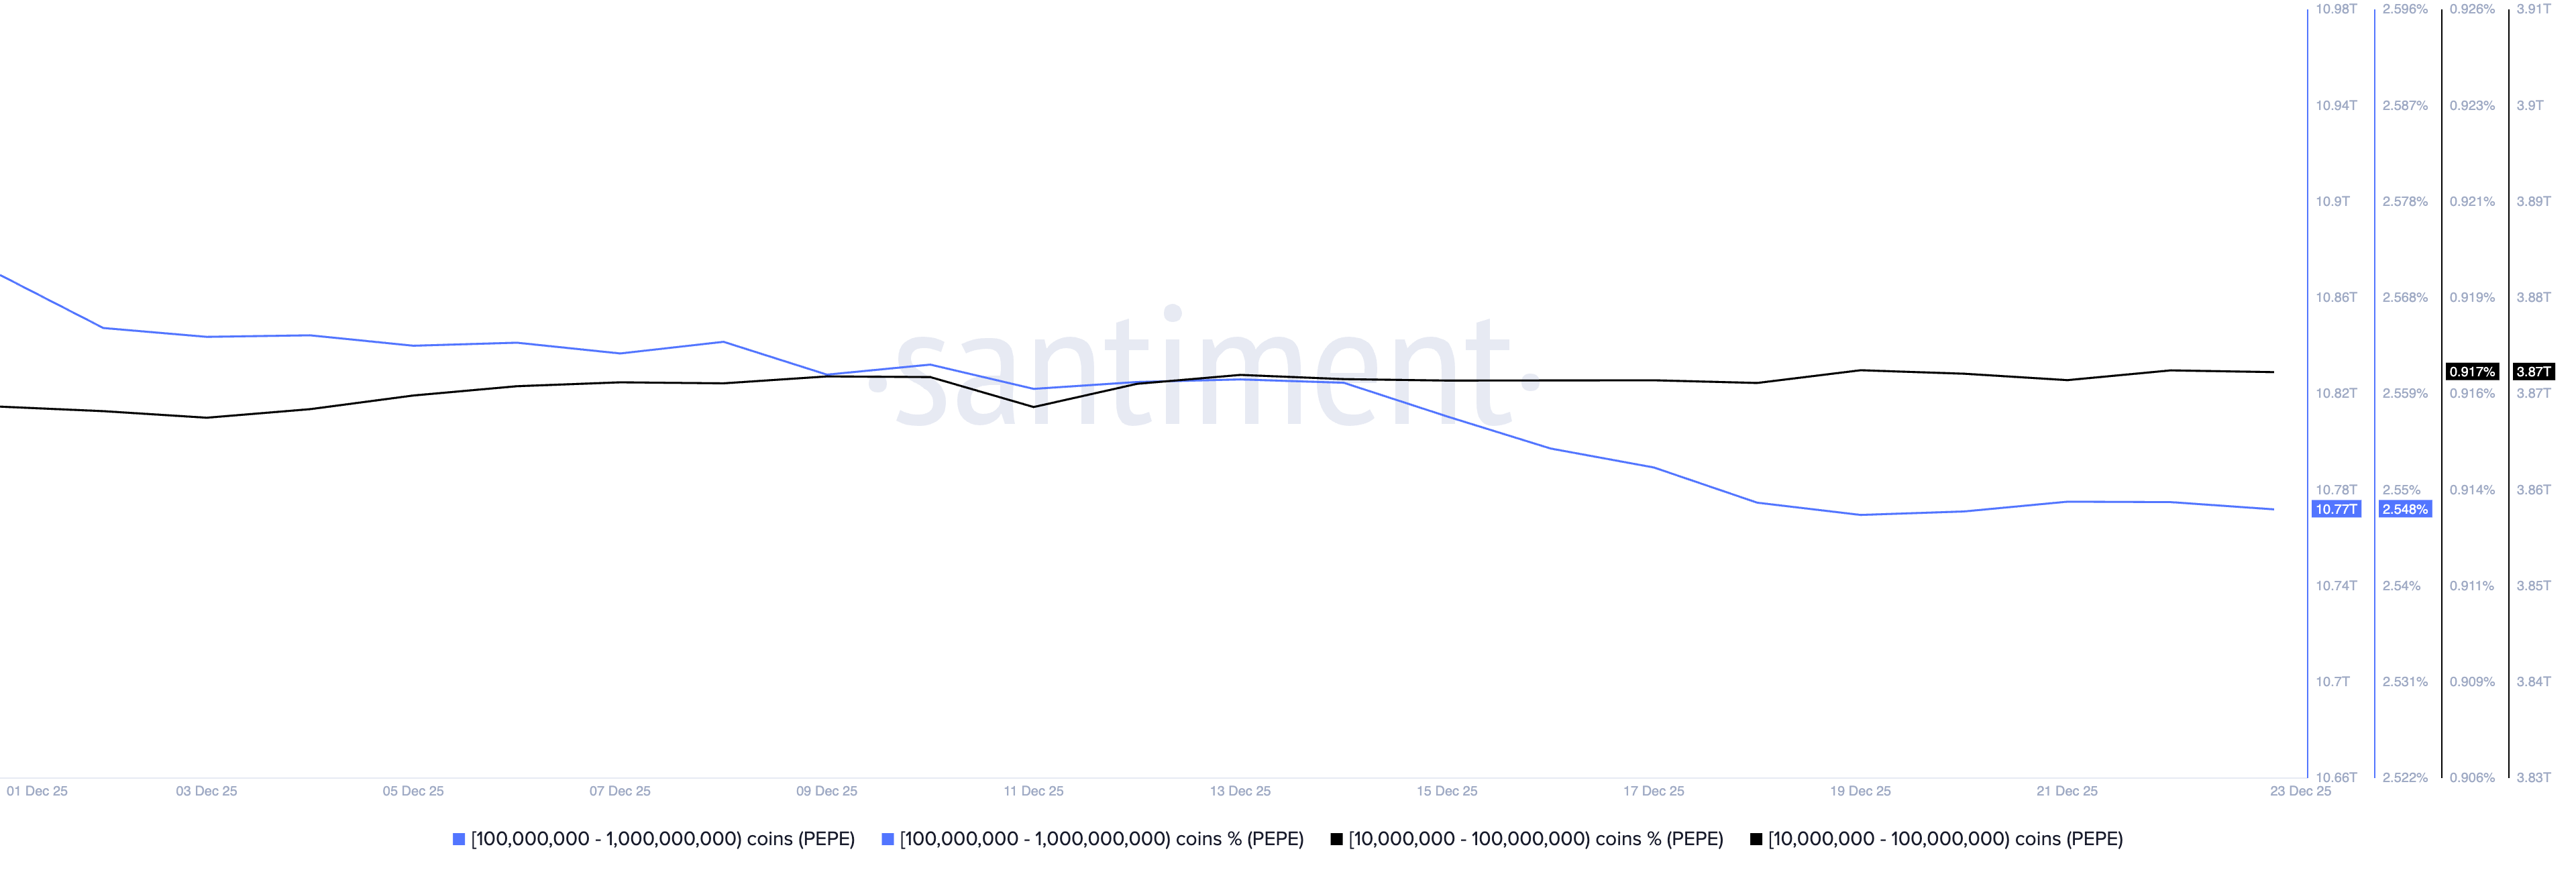
  • On-chain data shows a steady decrease in large-wallet investor holdings, indicating a loss of confidence.
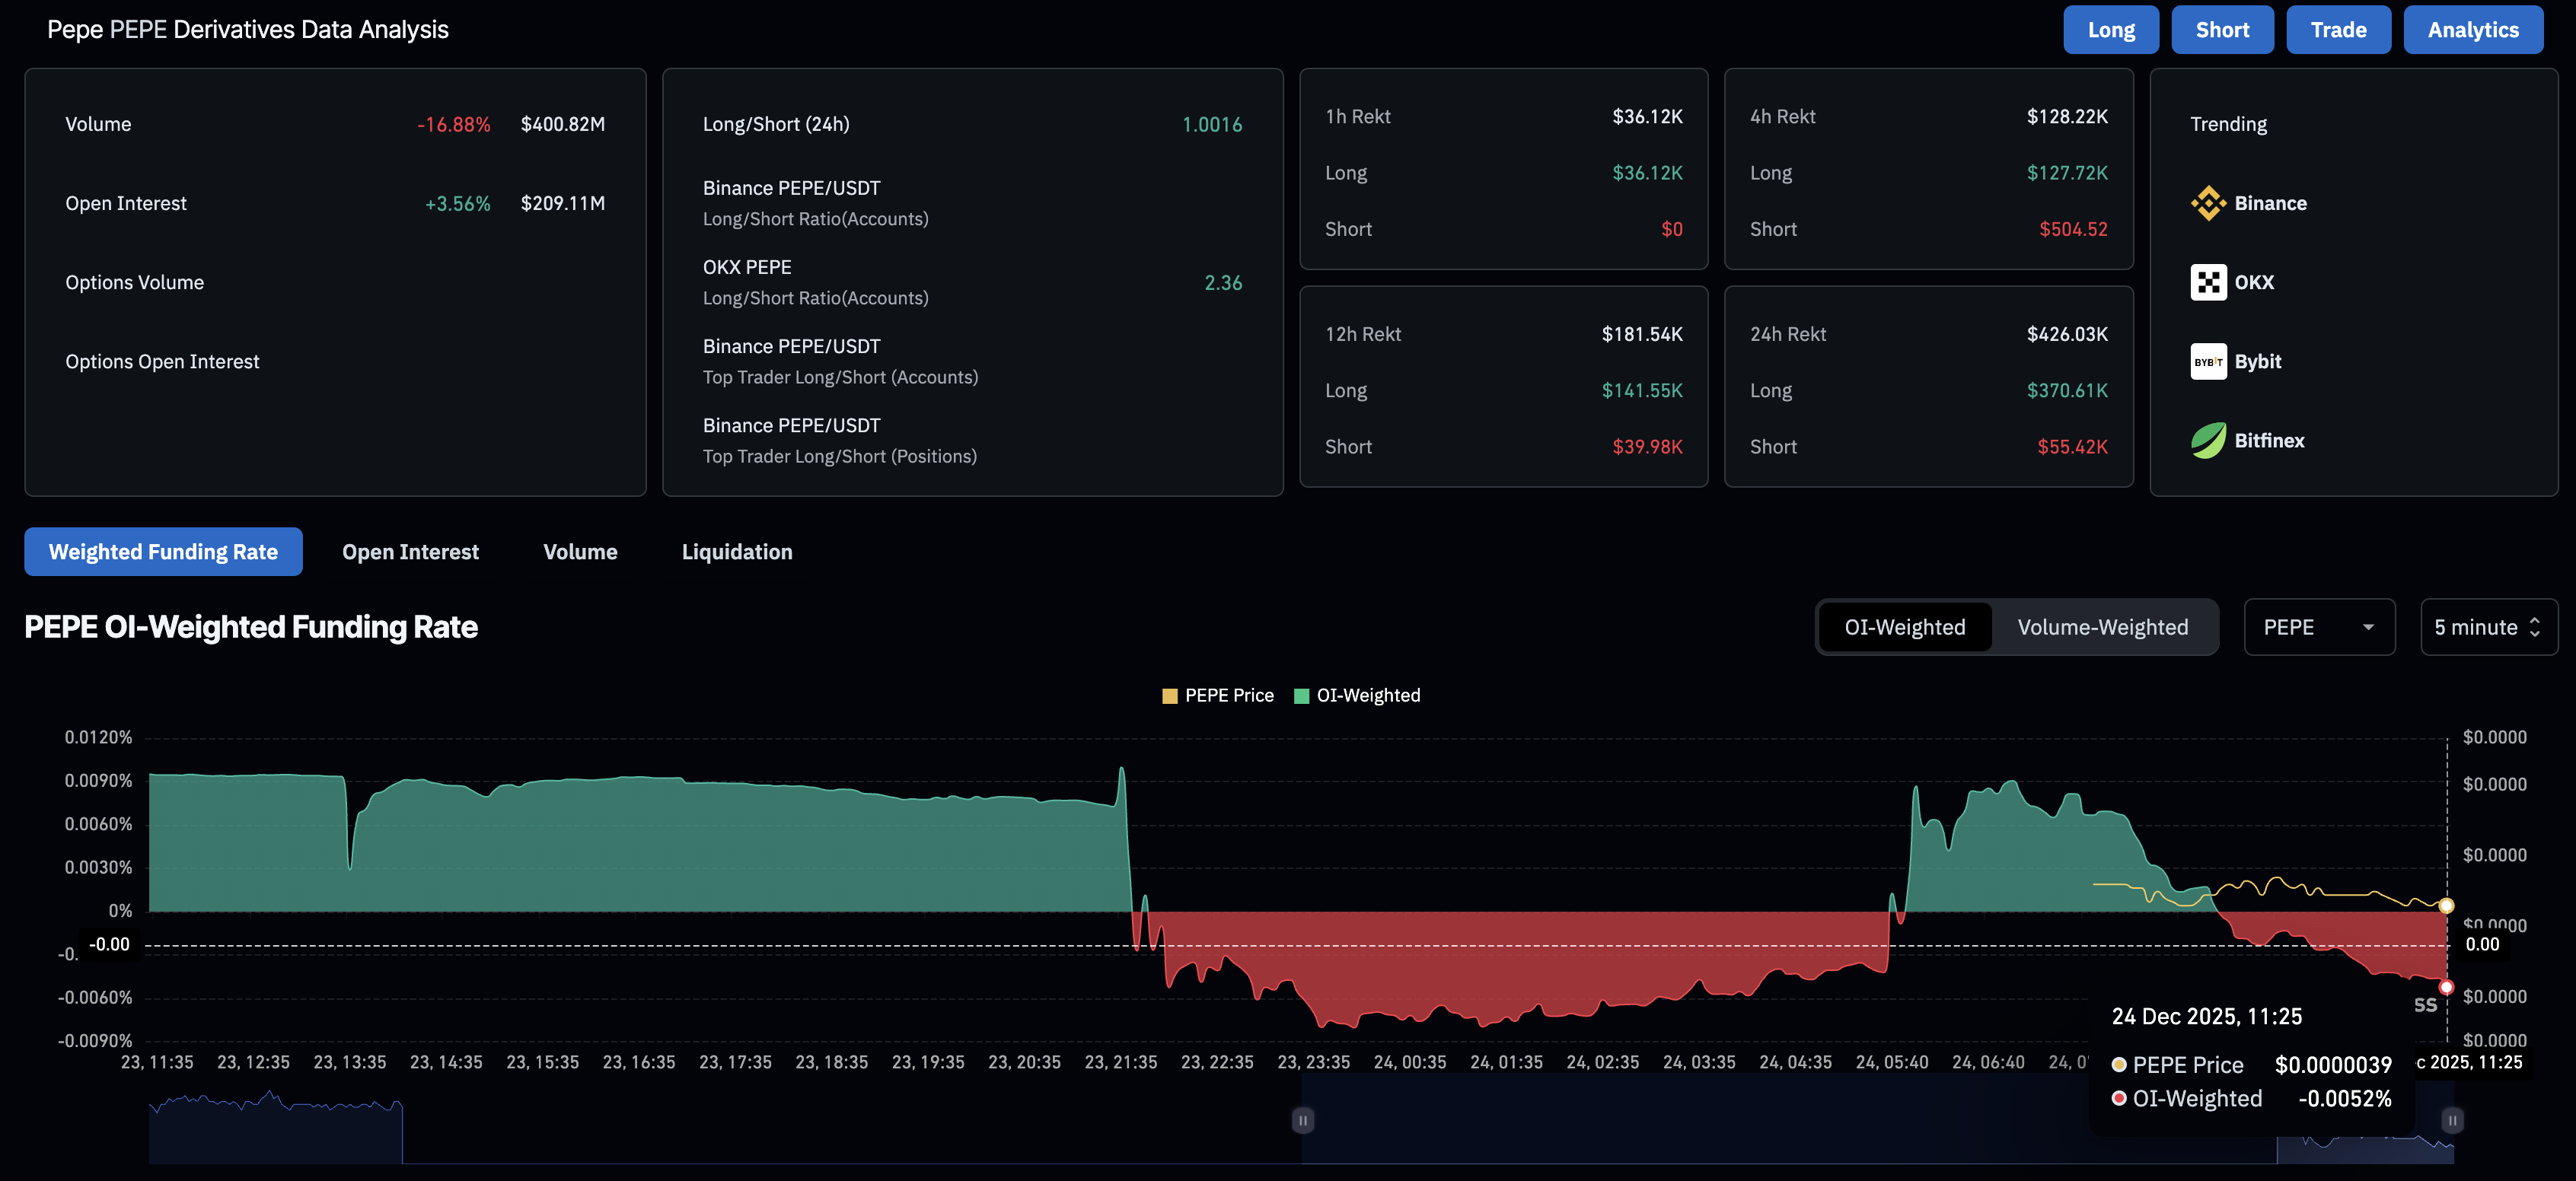
  • Derivatives data reflect a surge in Open Interest amid negative funding rates, suggesting fresh capital inflow as bearish interest persists.

Pepe (PEPE) is down 2% at press time on Wednesday, trading in the red for the fourth consecutive week with a nearly 4% loss so far this week. The frog-themed meme coin is losing support of large-wallet investors, commonly referred to as whales, while derivatives data indicate a bearish incline in traders' interest.

The technical outlook for PEPE points to potential further losses toward the December 18 low at $0.00000363.

Declining confidence among whales fuels selling pressure

Large-wallet investors are trimming their PEPE holdings, fueling the supply pressure and suggesting a decline in confidence. Santiment data shows that investors with 100 million to 1 billion PEPE hold 10.77 trillion tokens (2.54% of circulating supply), down from 10.87 trillion PEPE (2.57% of circulating supply) on December 1. 

PEPE supply distribution. Source: Santiment.

On the derivatives side, CoinGlass data shows a 3.56% increase in PEPE futures Open Interest over the last 24 hours to $209.11 million, suggesting that traders are allocating more capital, increasing their risk exposure. 

However, the negative funding rate of -0.0052% indicates a bearish tilt in traders' sentiment, as they pay a premium to hold short positions.

PEPE derivatives data. Source: CoinGlass

Technical outlook: Will PEPE exceed its December low?

Pepe extends the bearish reversal from the local resistance trendline connecting the December 9 and 22 highs on the 4-hour logarithmic chart, near $0.00000400. At the time of writing, PEPE is down 2% on Wednesday, aiming for the December 18 low at $0.00000363, close to the S1 Pivot Point at $0.00000364. 

If PEPE slips below this level, it could extend the decline to the S2 Pivot Point at $0.00000326. 

The momentum indicators on the 4-hour timeframe indicate a steady increase in selling pressure. The Relative Strength Index (RSI) is at 39, pointing lower toward the oversold zone, reversing from the halfway line as selling pressure resurfaces.

Meanwhile, the Moving Average Convergence Divergence (MACD) is in a clear downtrend, below its signal line, which indicates a rise in bearish momentum.

PEPE/USDT 4-hour logarithmic chart.

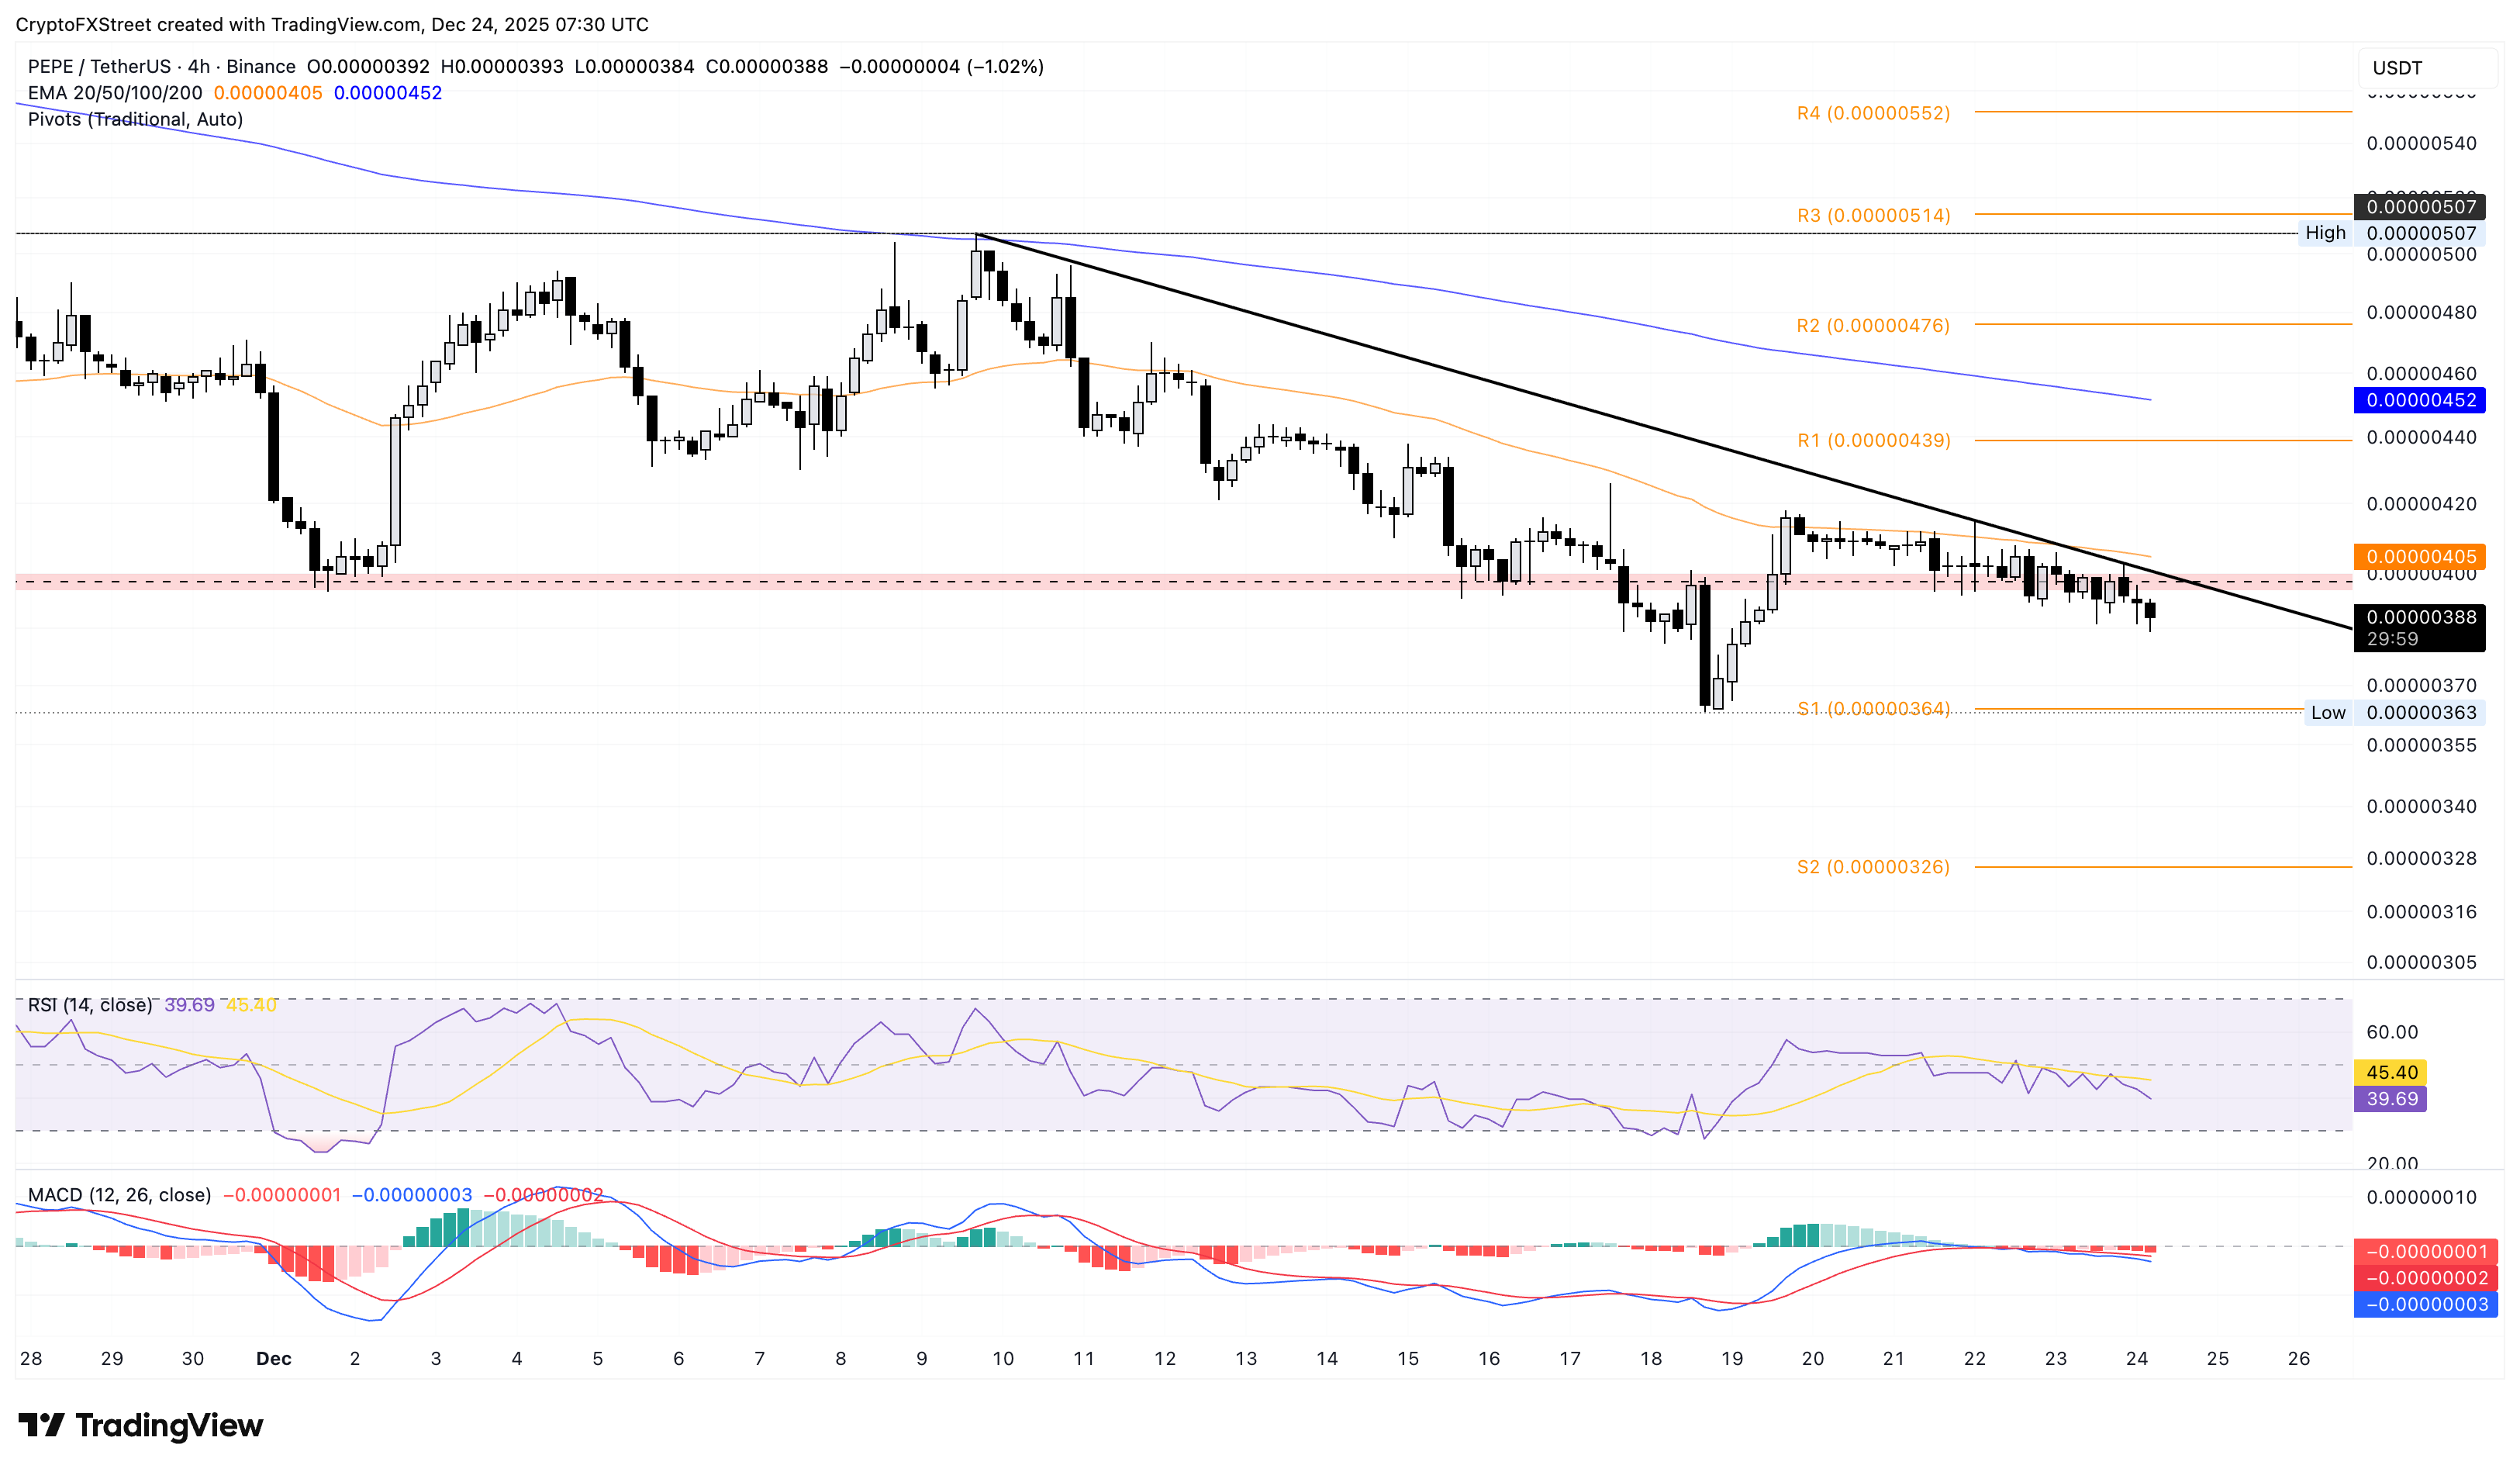
Looking up, a potential rebound in PEPE should surpass the $0.00000400 level to confirm the bullish breakout of the resistance trendline. If so, PEPE could target the R1 Pivot Point at $0.00000439.

Disclaimer: For information purposes only. Past performance is not indicative of future results.
placeholder
US Dollar's Decline Predicted in 2026: Morgan Stanley's Outlook on Currency VolatilityMorgan Stanley forecasts a 5% drop in the dollar by mid-2026, attributed to continued Fed rate cuts. A recovery may follow as growth improves and funding currency dynamics shift favorably toward the euro and Swiss franc.
Author  Mitrade
Nov 25, Tue
Morgan Stanley forecasts a 5% drop in the dollar by mid-2026, attributed to continued Fed rate cuts. A recovery may follow as growth improves and funding currency dynamics shift favorably toward the euro and Swiss franc.
placeholder
Gold's Historic 2025 Rally: Can the Momentum Last Through 2026?Following a historic surge in 2025 that saw prices climb over 60% and break records more than 50 times, gold investors are now looking ahead to assess whether the precious metal can sustain its momentum into 2026. Despite outperforming most major asset classes and heading for its best annual performance since 1979, analysts are divided on the outlook—with some seeing further room for gains and others cautioning that risks are rising.
Author  Mitrade
Dec 09, Tue
Following a historic surge in 2025 that saw prices climb over 60% and break records more than 50 times, gold investors are now looking ahead to assess whether the precious metal can sustain its momentum into 2026. Despite outperforming most major asset classes and heading for its best annual performance since 1979, analysts are divided on the outlook—with some seeing further room for gains and others cautioning that risks are rising.
placeholder
Oil Prices Surge Amid U.S. Crackdown on Venezuelan Tankers and Middle East Tensions Oil prices rose in early Asian trading as the U.S. targets Venezuelan oil tankers amid geopolitical worries over Iran. Supply disruption fears contribute to rising Brent and WTI crude prices.
Author  Mitrade
Dec 22, Mon
Oil prices rose in early Asian trading as the U.S. targets Venezuelan oil tankers amid geopolitical worries over Iran. Supply disruption fears contribute to rising Brent and WTI crude prices.
placeholder
Gold Prices Hit Record High Amid U.S.-Venezuela Tensions and Rising Geopolitical RisksGold surged to an all-time high as safe-haven demand increased due to escalating tensions between the U.S. and Venezuela, with significant gains seen in other precious metals like silver and platinum.
Author  Mitrade
Yesterday 01: 31
Gold surged to an all-time high as safe-haven demand increased due to escalating tensions between the U.S. and Venezuela, with significant gains seen in other precious metals like silver and platinum.
placeholder
Bitcoin Faces Worst Fourth Quarter Since 2018 as Market Fatigue PersistsBitcoin's recent push back toward the $90,000 mark has provided the cryptocurrency market with a short-term lift, but few analysts view the move as a meaningful turning point following one of the weakest second halves in recent years.
Author  Mitrade
Yesterday 08: 57
Bitcoin's recent push back toward the $90,000 mark has provided the cryptocurrency market with a short-term lift, but few analysts view the move as a meaningful turning point following one of the weakest second halves in recent years.
goTop
quote