Zcash Price Forecast: ZEC eyes $300 breakout rally as network activity, retail demand grow
- Zcash approaches the $300 mark after bouncing off the 20-period EMA on the 4-hour chart.
- On-chain data suggests a rise in shielded ZEC tokens, indicating a surge in adoption.
- Retail interest in the Zcash recovery run drives the futures Open Interest above $300 million.
Zcash (ZEC) recovery run towards the $300 mark gains traction on Wednesday, surviving the crypto market’s flash crash and subsequent days of high volatility. The renewed uptrend in the privacy coin points to further gains as retail demand and on-chain activity surge.
Retail and on-chain demand fuel the ZEC rally
Zcash provides privacy to users by collecting deposits into transparent pools, such as Sprout, and transferring them to anonymous pools, like Sapling or Orchard pool, using zero-knowledge proof-based high-level encryption technology. This transfer is called shielding.
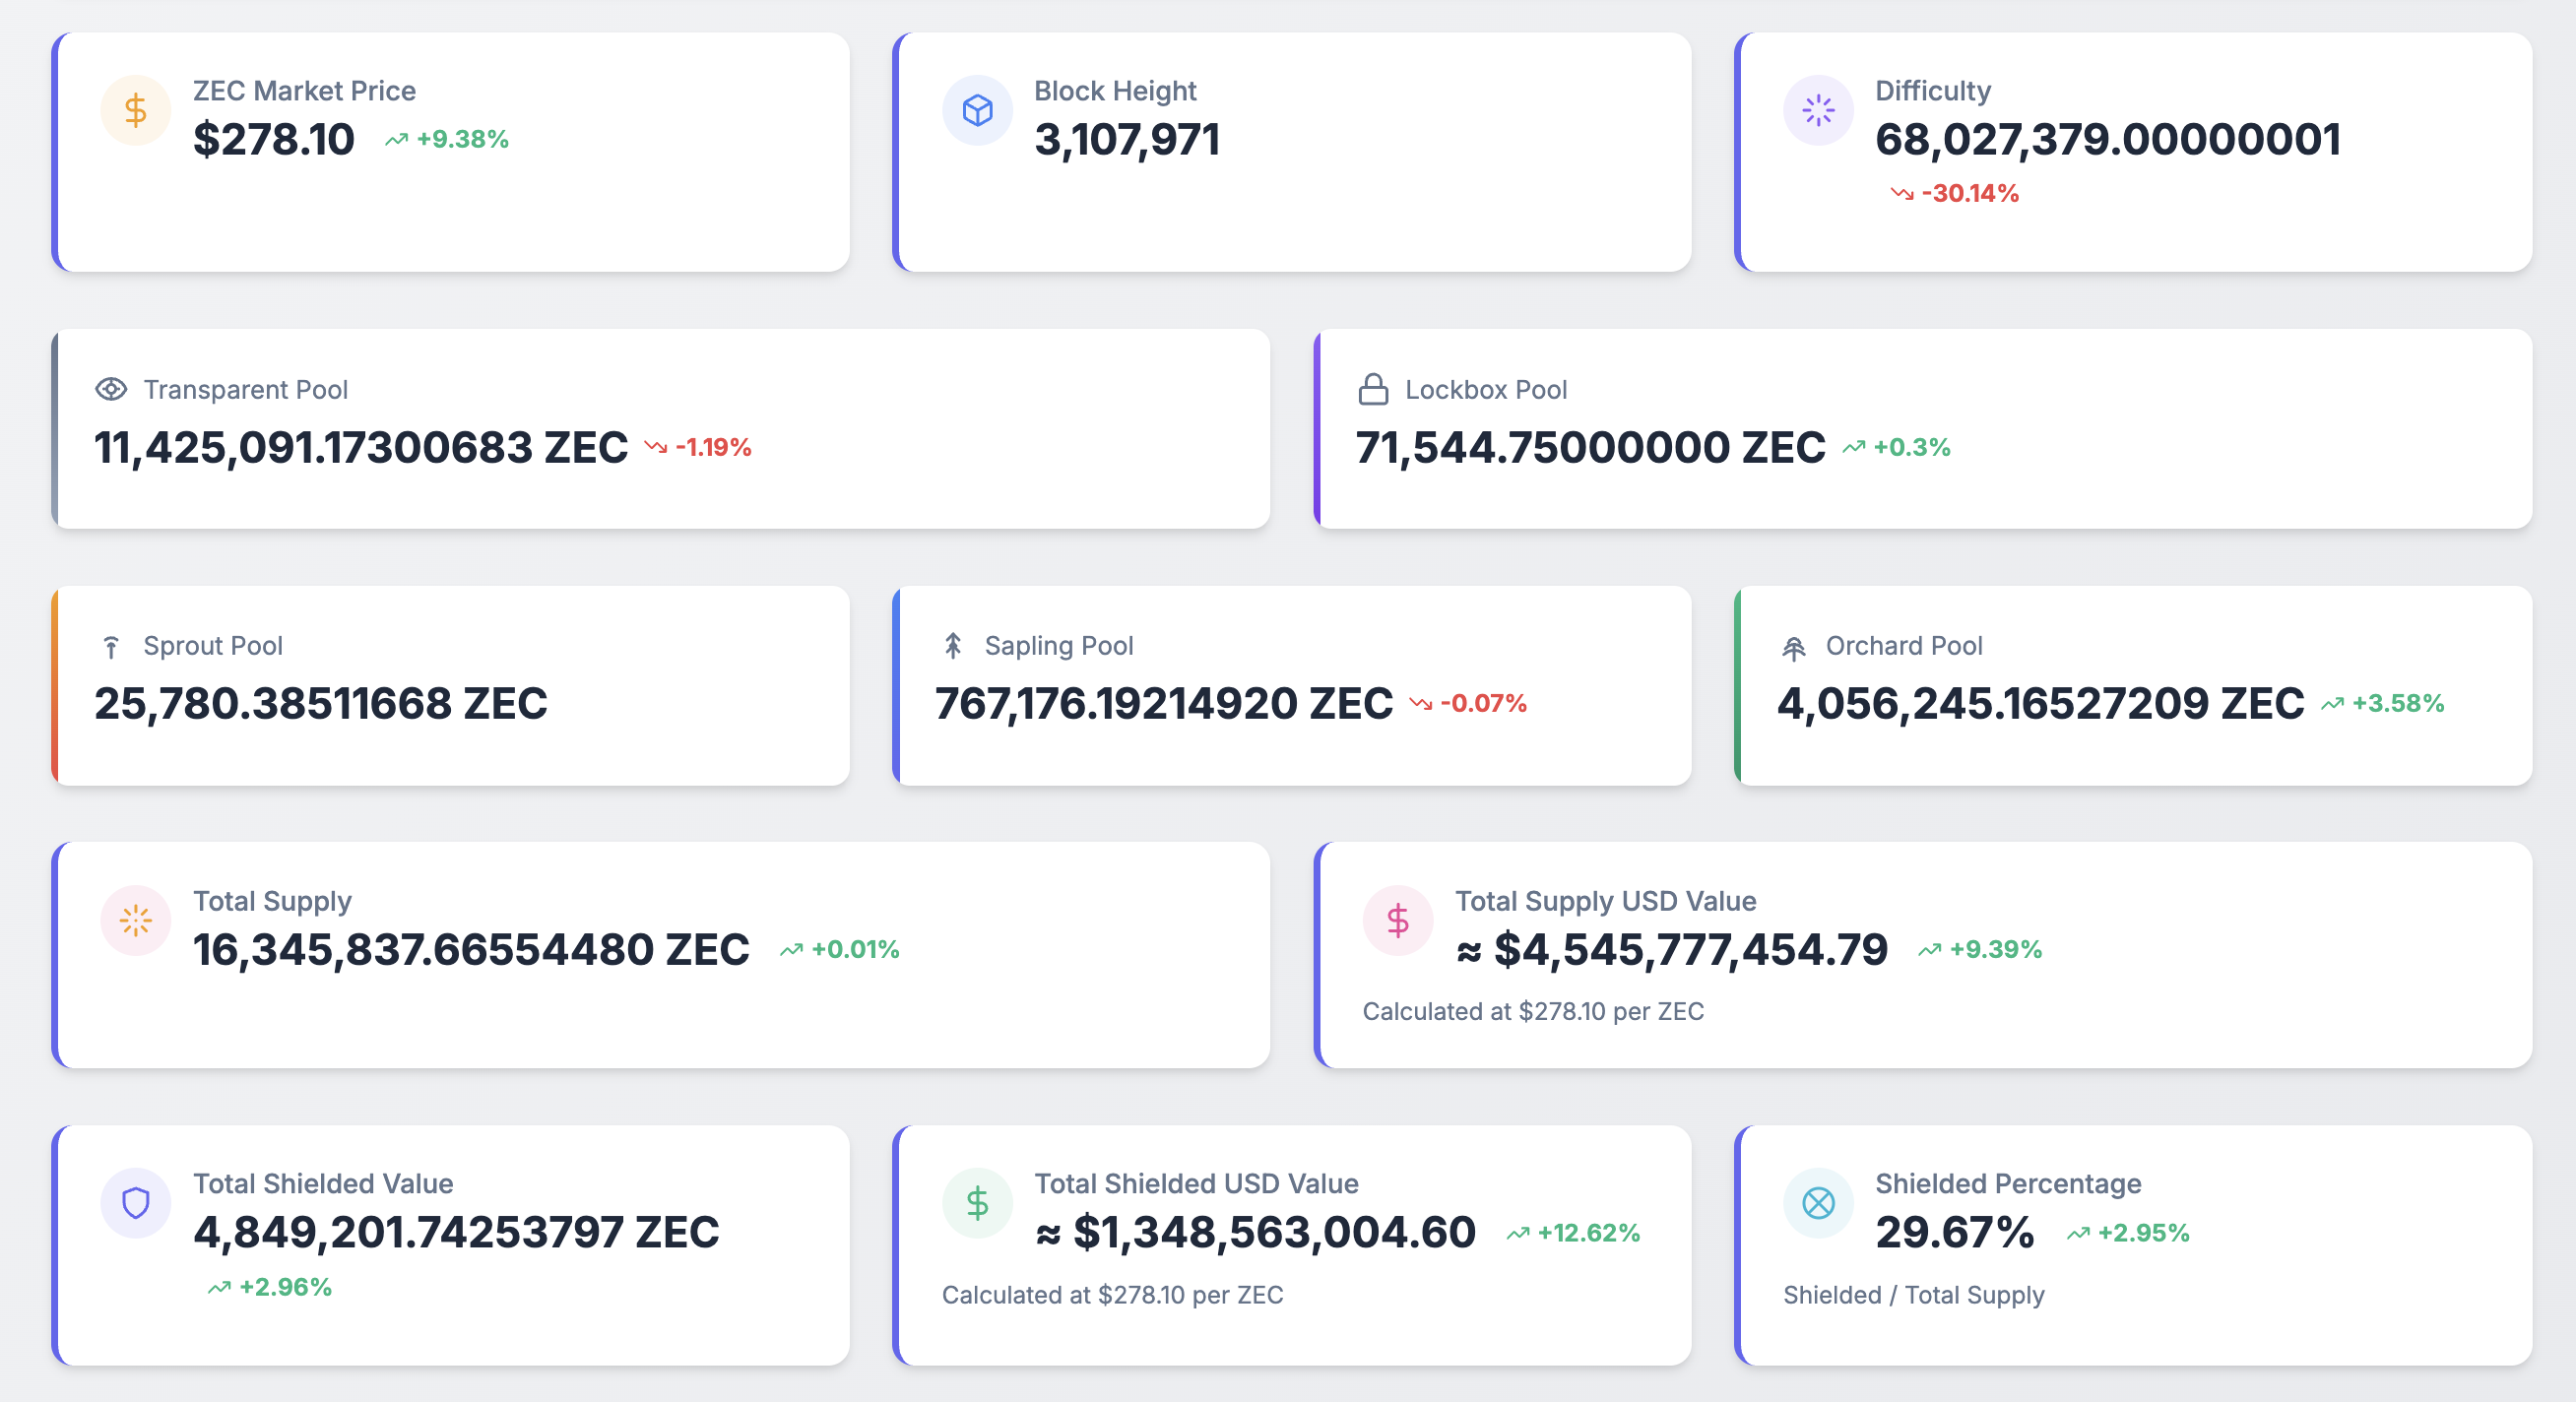
An increase in shielding signals a rise in on-chain privacy use, suggesting heightened user adoption. According to zkp.baby, a Zcash on-chain metrics dashboard, over 4.84 million ZEC tokens have been shielded, accounting for nearly 30% of the total supply and leading to a surge in demand for the unshielded ZEC tokens (70% of the total supply).

Zcash shielding metrics. Source: zkp.baby
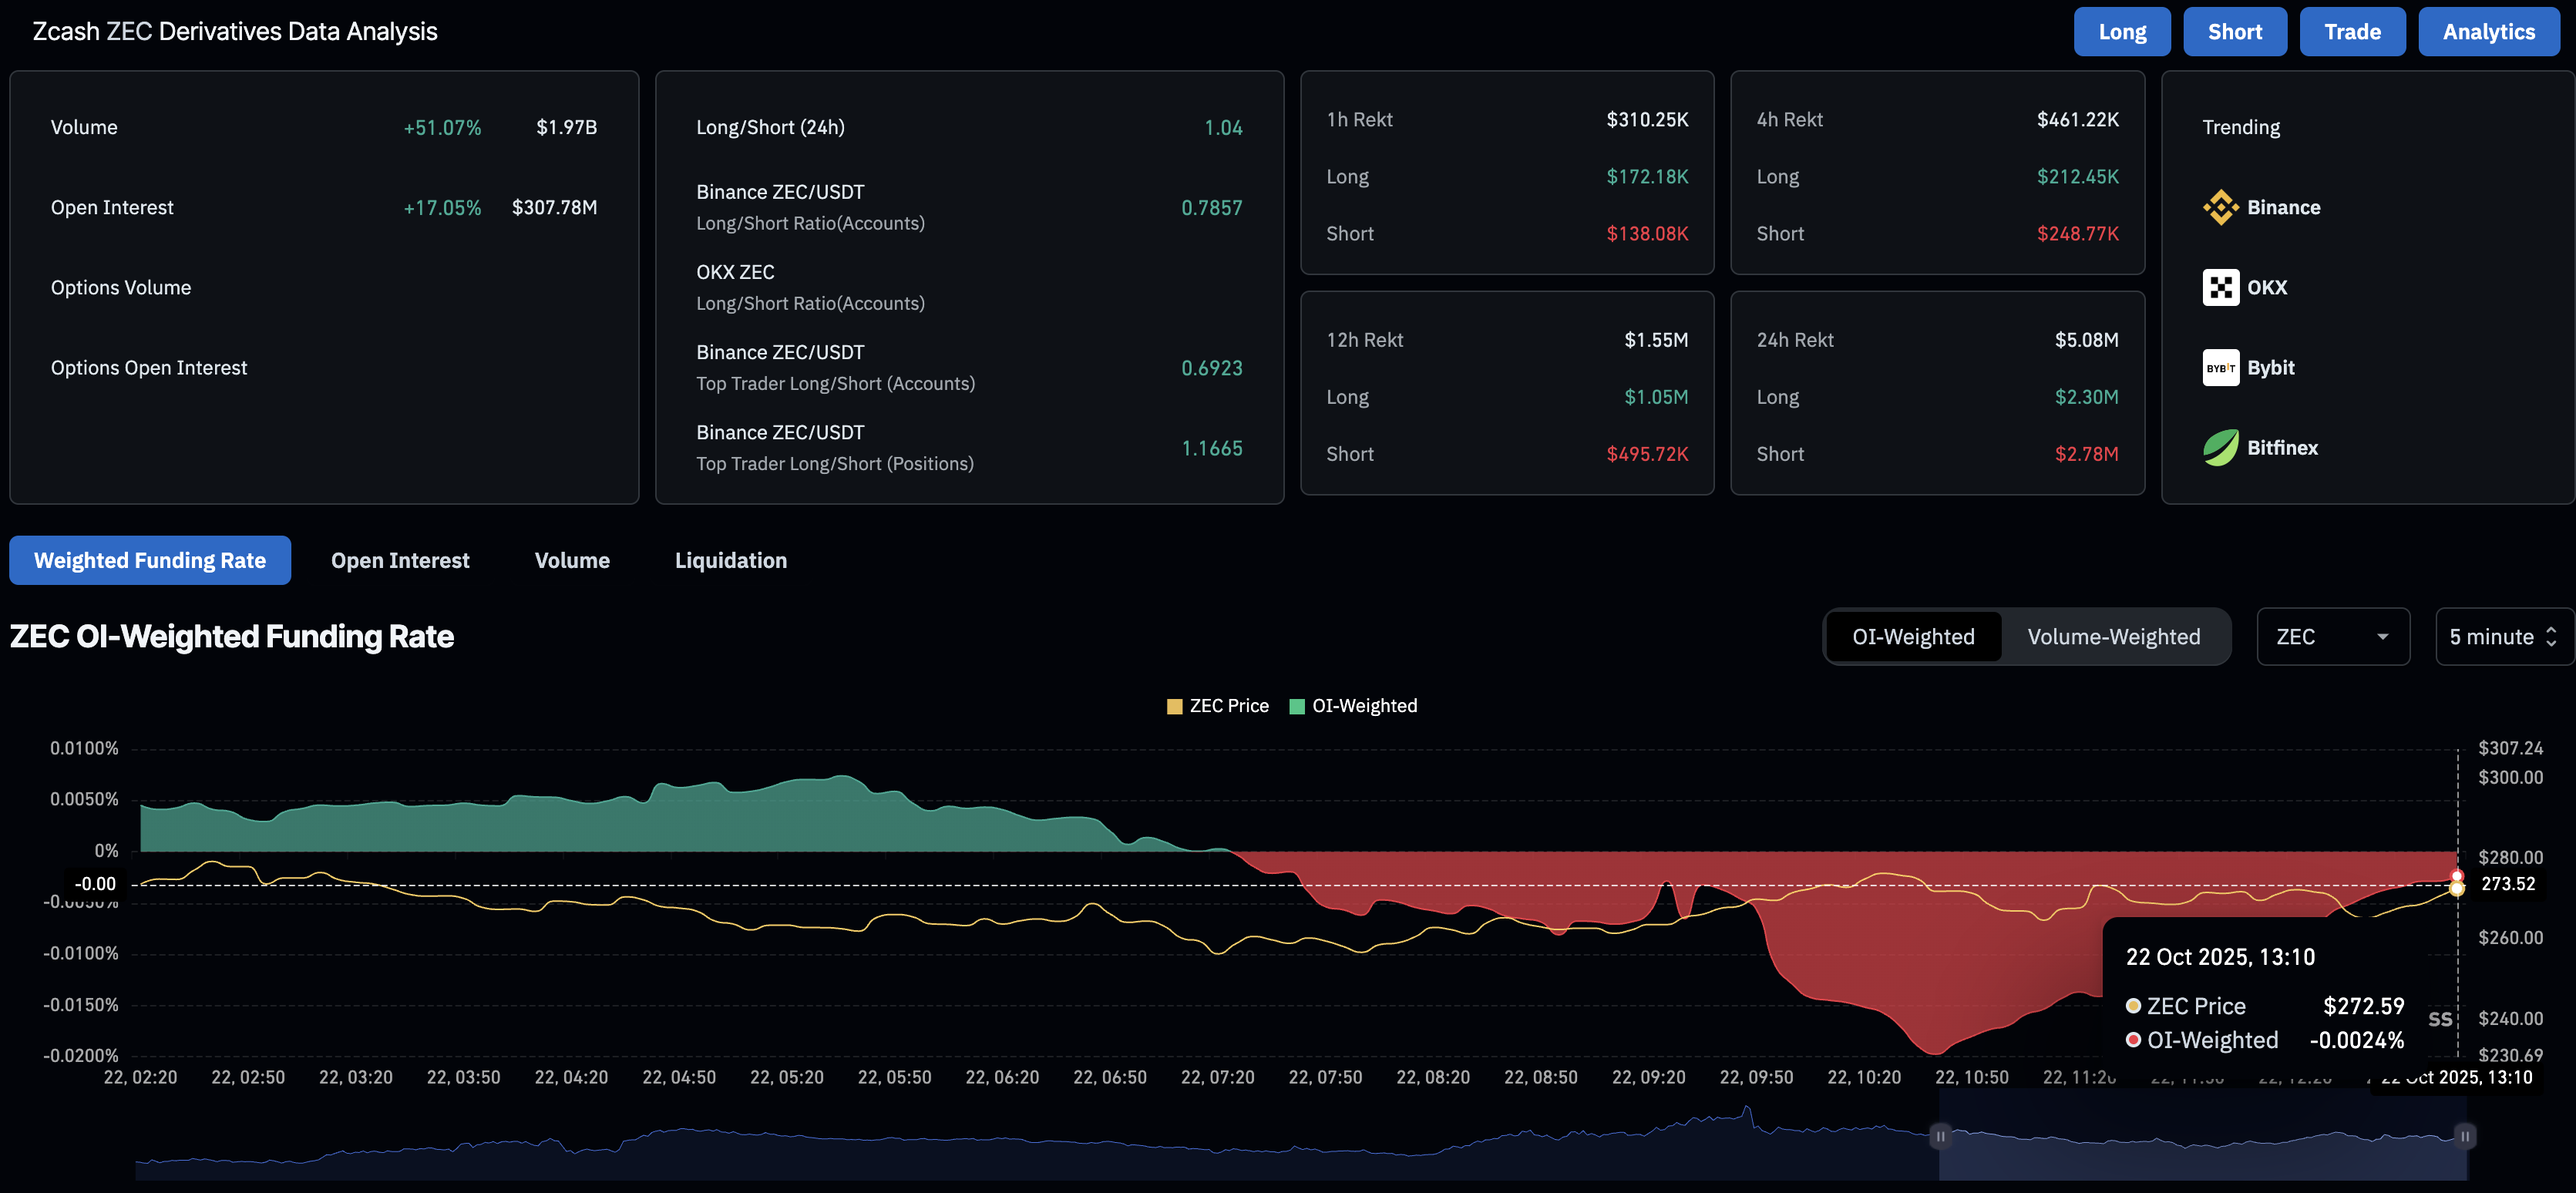
Apart from on-chain demand, the retail demand for ZEC is also on the rise as traders anticipate further recovery. CoinGlass data shows that the ZEC futures Open Interest (OI) has increased by 17.05% in the last 24 hours, reaching $307.78 million. An increase in OI refers to a rise in the notional value of all outstanding ZEC futures contracts, suggesting a risk-on sentiment shift to the privacy coin while the broader market suffers from liquidation waves.
Corroborating this demand surge, the OI-weighted funding rate, at -0.0024%, is up from -0.0197% earlier in the day, indicating a decline in traders’ willingness to hold short positions.

Zcash derivatives data. Source: CoinGlass
Technical outlook: Zcash rally eyes $300 breakout
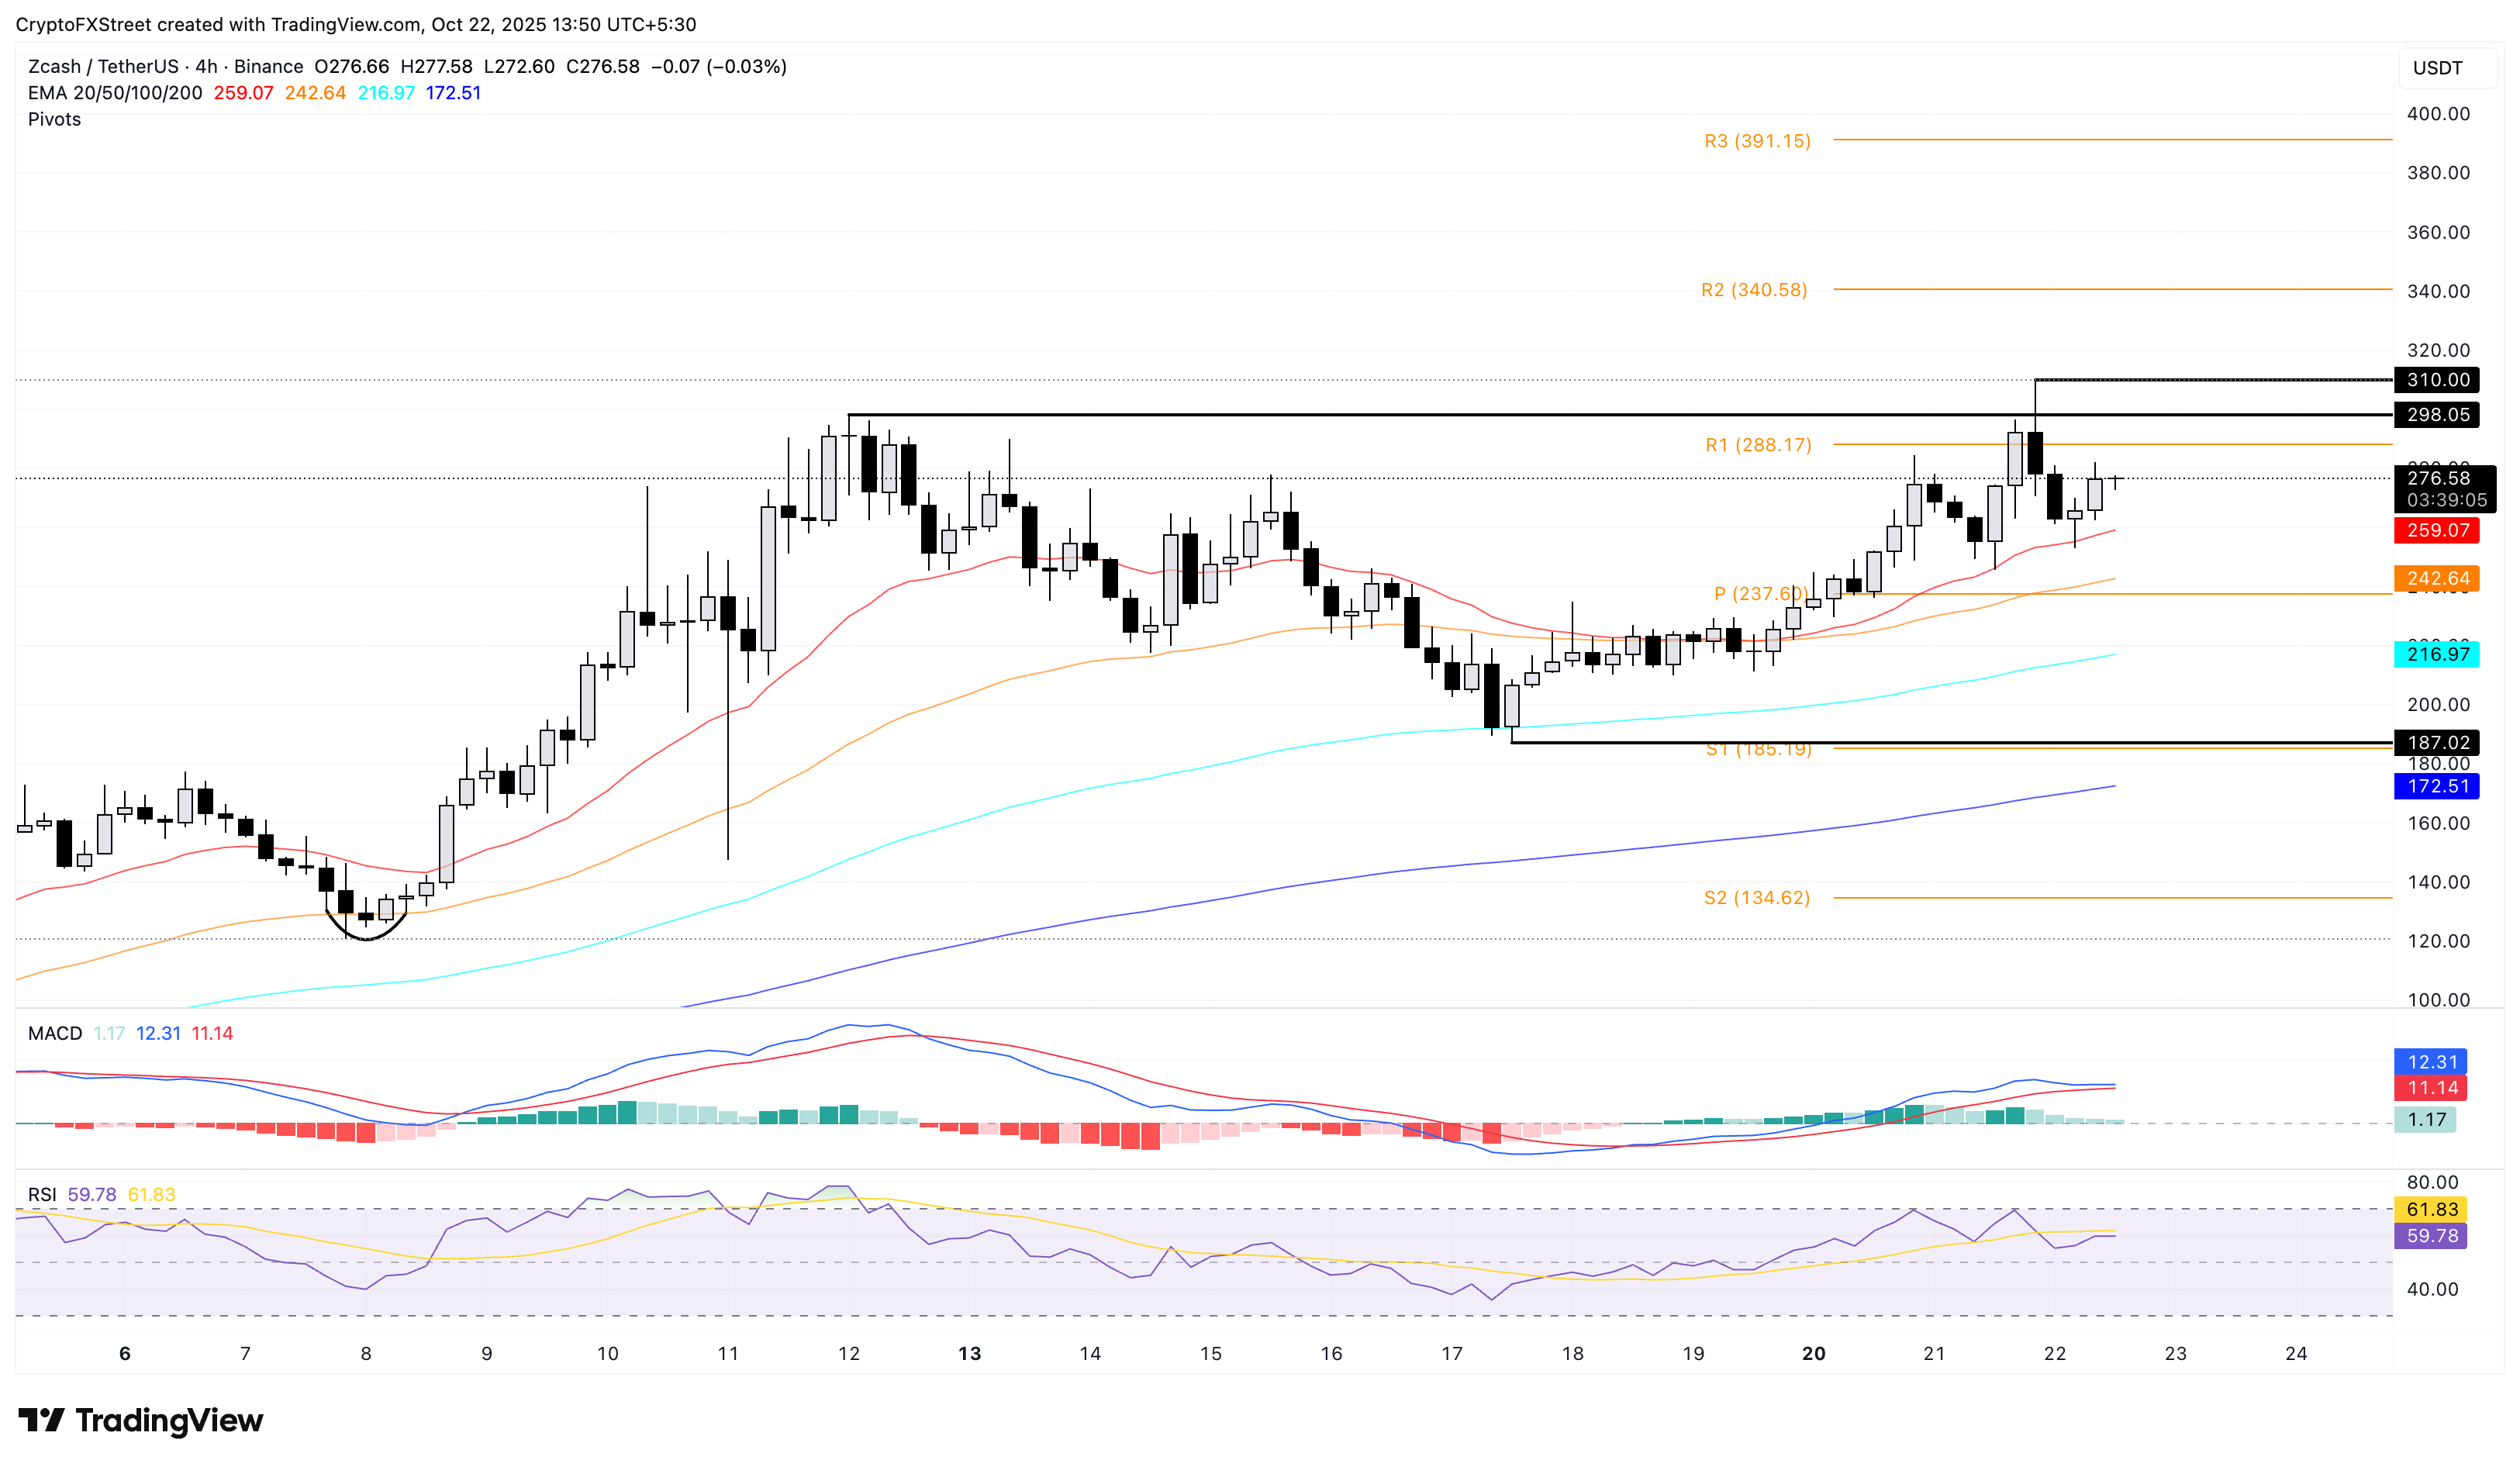
Zcash edges higher by 4% at press time on Wednesday, bouncing off the 20-period Exponential Moving Average (EMA) on the 4-hour price chart. The imminent resistance for the privacy coin is at the $298 level, marked by the October 11 high.
A successful potential close above this level could refresh the bullish rally in the privacy coin, allowing it to reclaim the $300 mark and target the R2 Pivot Point on the 4-hour price chart at $340.
The momentum indicators remain divided on the same chart as the Moving Average Convergence Divergence (MACD) approaches the signal line, risking a potential crossover that would signal a bearish shift in trend momentum.
On the other hand, the Relative Strength Index (RSI) reads 59, sloping upwards, with space for further growth before reaching the overbought zone.

ZEC/USDT 4-hour price chart.
Looking down, if ZEC reverses from the $298 resistance, the 20-period, 50-period, and 100-period EMAs at $259, $242, and $216 could act as immediate support levels.


