
Tron Price Forecast: TRX bulls hit yearly high as transactions top 11.1 billion
- Tron price trades near $0.35 on Friday after an eight-week rally totaling over 35%.
- On-chain data show TRX transactions surpassing 11.1 billion, while Open Interest hits a record high.
- Technical outlook points to further gains, with bulls eyeing the $0.45 all-time high.
Tron (TRX) is riding strong bullish momentum, holding near $0.359 on Friday after an eight-week rally of more than 35% and reaching a new yearly high the previous day. On-chain metrics paint a supportive picture for further upside, with transactions surpassing 11.1 billion and open interest hitting record levels. Technical indicators suggest the rally could extend toward TRX’s all-time high of $0.45.
Tron’s Open Interest hit record highs
CoinGlass futures’ OI in Tron at exchanges rose to $610.47 million on Friday, the new all-time high, and has been constantly rising since July. Rising OI represents new or additional money entering the market and new buying, which could fuel the current TRX price rally.
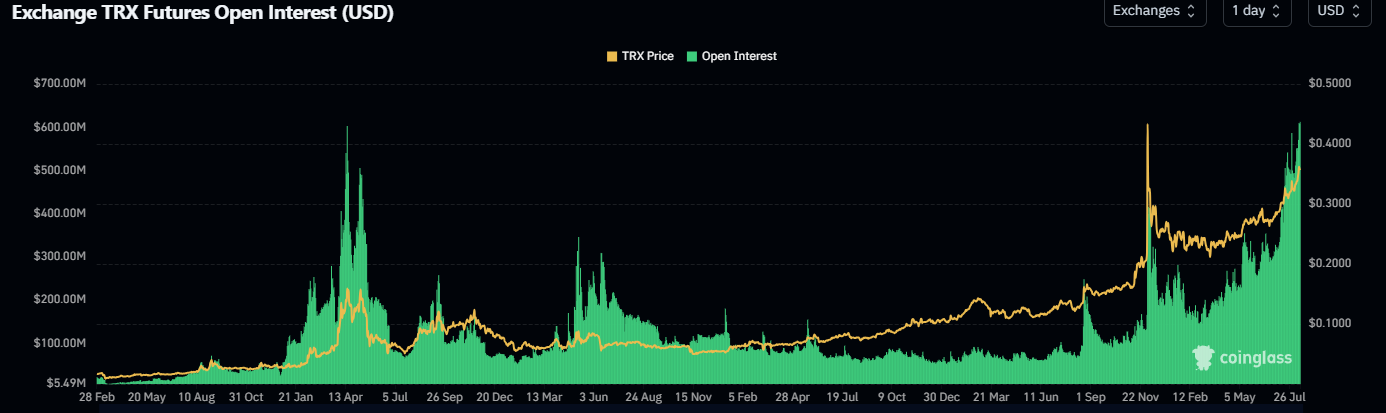
TRX open interest chart. Source: CoinGlass
CryptoQuant data shows that the Tron Transaction Count has surpassed 11.1 billion, highlighting a growing network. The historical comparison shows that the current daily run rate is approximately 7–9 million transactions per day, with peaks approaching 10 million; this is significantly higher than the levels seen in early 2024, suggesting a strong growth compared to the previous cycle.
-1755236541899-1755236541901.webp)
TRON Transaction Count chart. Source: CryptoQuant
Tron Price Forecast: TRX hits new yearly high
Tron price reached a new yearly high of $0.37 on Thursday after rallying nearly 35% since mid-June. At the time of writing on Friday, it trades around $0.35.
If TRX continues its upward momentum, it could extend the rally toward its record high of $0.45, set on December 4, 2024.
The Relative Strength Index (RSI) on the daily chart reads 73, placing it in overbought territory, pointing upward, indicating strong bullish momentum. The MACD showed a bullish crossover on Monday, and with rising green histogram bars, further supports the bullish thesis.
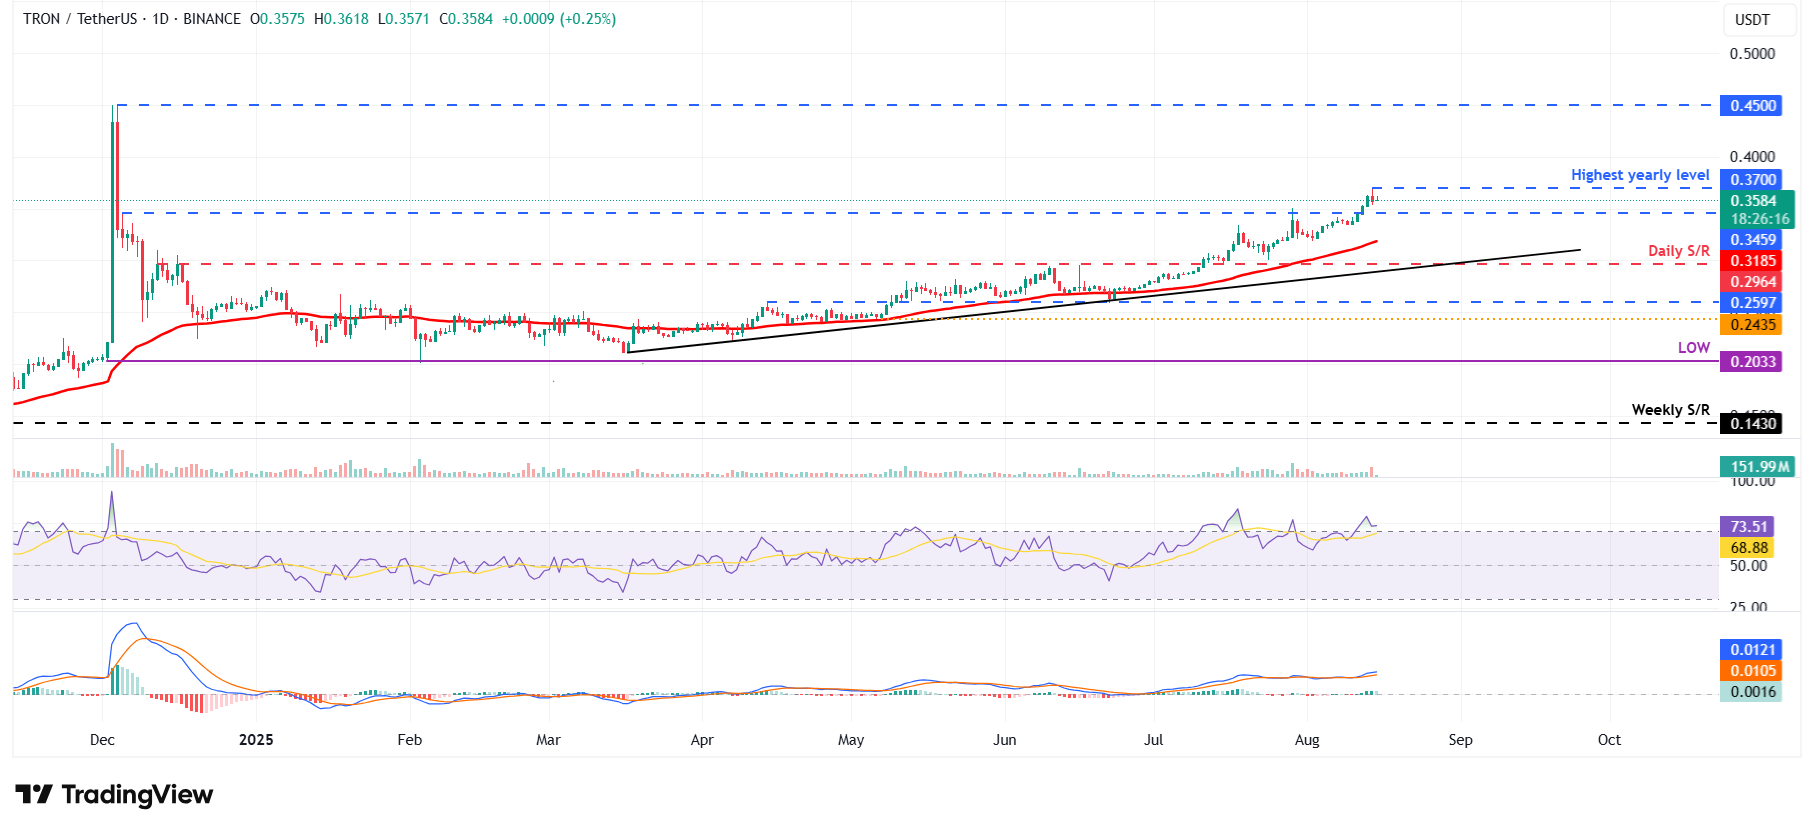
TRX/USDT daily chart
If TRX faces a correction, it could extend the decline toward its next support at $0.34.
Recommended Articles


