


The Battle for Oil Market Share: Can OPEC Reclaim Ground from U.S. Shale Producers?
TradingKey - In the global oil market, both OPEC, the traditional oil cartel, and the United States, powered by its shale revolution, hold significant influence over pricing. In May 2025, OPEC announced it would increase production for the third consecutive month, signaling a shift in strategy aimed at regaining the market share it has lost over the past decade — reigniting interest in the evolving dynamics of global oil geopolitics.
Thanks to technological breakthroughs in shale extraction, the rise of U.S. shale oil has become one of the most transformative developments in the energy industry this century. It has enabled the U.S. to transition from a net importer to a net exporter of crude oil, surpassing OPEC in terms of market share and significantly weakening the cartel’s pricing power.
After years of cutting output to support prices — only to see rivals gain ground — OPEC is now adopting a new strategy: a prolonged price war to reclaim dominance.
A Familiar Oil Price War
Historically, the Middle East has been the world's key oil-producing region. At its peak, OPEC commanded nearly 40% of global oil supply when it was founded in 1960.
Traditionally led by Saudi Arabia, OPEC maintained control through coordinated production cuts to stabilize prices. However, the rise of U.S. shale diluted the effectiveness of these cuts, prompting OPEC to consider an alternative strategy — a price war, where the winner is the producer who can survive longer at lower prices.
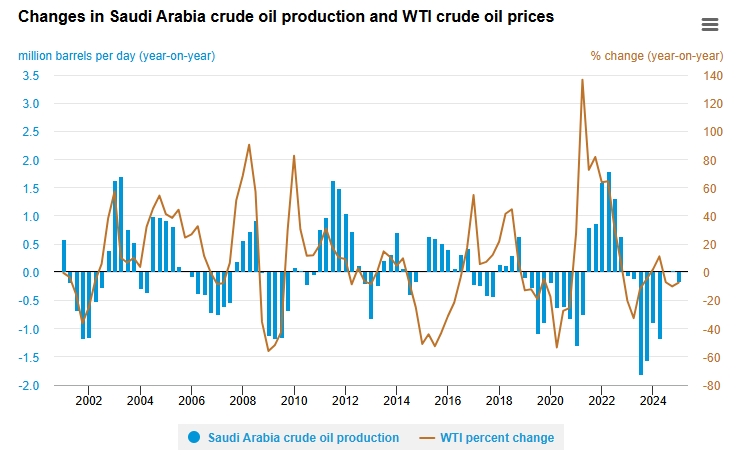
Changes in Saudi Arabia crude oil production and WTI oil prices, Source: EIA
Between 2014 and 2016 , OPEC refused to cut output despite falling prices, allowing crude to drop from around $100 per barrel to $30. The goal was to pressure U.S. shale producers into bankruptcy.
While hundreds of U.S. shale firms did go under during that period, OPEC members like Iran and Venezuela also suffered severe fiscal strain. Ultimately, OPEC realized it couldn't eliminate shale oil entirely and formed OPEC+ with Russia and others in 2016 to better manage global supply.
The Oil Market Landscape
According to EIA, between 2014 and 2024, U.S. oil production surged over 60% to reach 22.71 million barrels per day (bpd), while OPEC production slightly declined to 32.39 million bpd.
OPEC’s market share has dropped from 40% a decade ago to under 25% today, while the U.S. share has risen from 14% to 20%. OPEC+ collectively accounts for nearly 48% of global oil production.
How the U.S. Gained Oil Leverage
For decades, the U.S. was the world’s largest consumer and importer of oil. By 2005, it imported 40% of its oil from OPEC, compared to 85% in the 1970s.
The shale revolution, starting around 2008, along with policy support and geopolitical shifts, allowed the U.S. to become the world’s top oil producer since 2014 (except in 2016).
In 2020, the U.S. became a net oil exporter for the first time since 1949 .
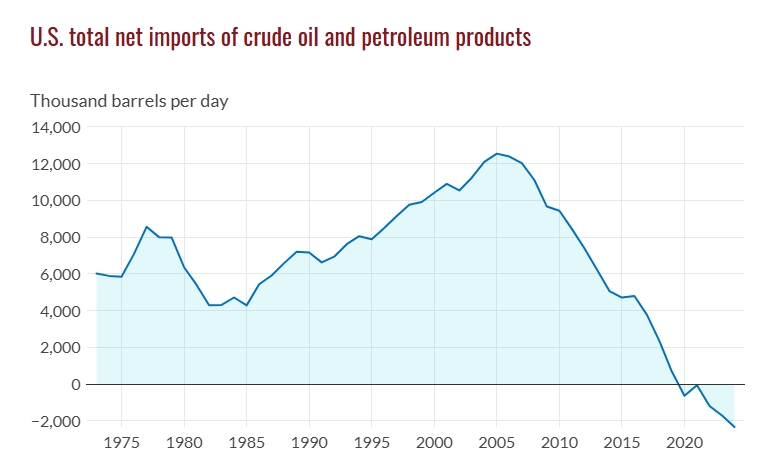
U.S. net petroleum imports, Source: GIS
U.S. Shale Advantages Over OPEC
Factor | OPEC | U.S. Shale |
Technology | Relies on conventional methods, slower updates | Advanced horizontal drilling and fracking; high digitalization |
Cost | High break-even costs due to fiscal needs | Low breakeven points, especially in basins like Permian |
Flexibility | Slow decision-making, political coordination needed | Fast adjustments to price changes |
Policy Support | Political instability in many regions | Strong government backing and market-driven operations |
Source: TradingKey
1. Technological Breakthroughs & Efficiency Gains
Over the past decade, innovations in horizontal drilling and hydraulic fracturing have made U.S. shale more economically viable. With big data and automation, efficiency in exploration and production has improved dramatically.
2. Flexible Production & Cost Competitiveness
Shale wells can be brought online within months, unlike conventional fields that take years. This allows U.S. producers to quickly adjust to price fluctuations. In major areas like the Permian Basin, production costs have fallen to $30–$40 per barrel, undercutting many OPEC nations that require $40–$50 per barrel just to balance budgets.
3. Policy Support & Geopolitical Factors
Both the Trump and Biden administrations emphasized energy independence and boosted domestic oil exports. Mergers and acquisitions among U.S. energy firms have strengthened resilience.
Geopolitical conflicts have also weakened some OPEC competitors — such as sanctions against Iran, civil war in Libya, and Yemeni attacks on Saudi infrastructure. Meanwhile, growing tensions between Russia and Saudi Arabia highlight the fragility of the OPEC+ alliance.
OPEC’s Opportunities to Regain Market Share
With Trump returning to the White House, OPEC has announced several months of increased oil output, aiming to regain lost ground. Several factors may help OPEC win the price war:
- High U.S. inflation and plateauing shale output
- Improved internal coordination within OPEC
- Slower U.S. capital investment due to financial discipline
- Depletion of resources in the Permian Basin
- Higher input costs for the U.S. due to tariffs on steel and aluminum
OPEC holds significant spare capacity, while U.S. shale faces production limits. According to Occidental Petroleum(OXY, U.S. oil output could peak between 2027 and 2030, then decline.
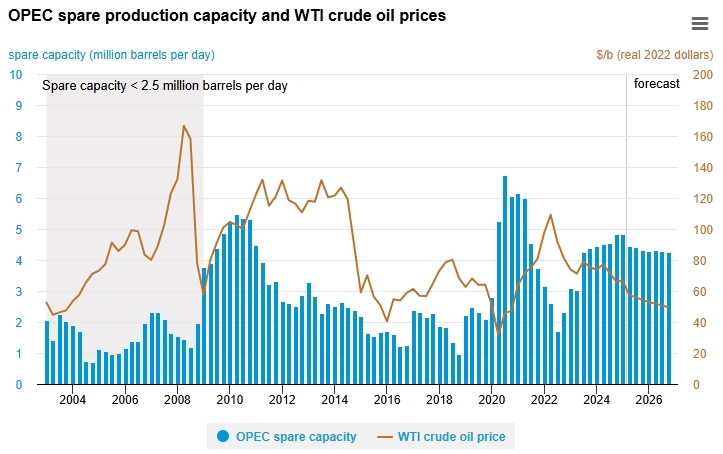
OPEC spare production capacity, Source: EIA
OPEC's Key Opportunities
Opportunity | Details |
Global Demand Growth | OPEC forecasts 1.3 million bpd demand growth in 2025 and 2026; IEA expects 730K bpd in 2025 and 690K bpd in 2026 |
Cost Advantage | Saudi Arabia produces at $3–$5/bbl, Russia at $10–$20/bbl, vs. U.S. shale’s $65/bbl breakeven |
Price Control Ability | OPEC+ controls the world’s largest spare capacity and can actively adjust supply to influence prices |
U.S. Shale Slowdown | Expected slowdown in Permian output growth by 25% in 2025 (250K–300K bpd) |
Summer Demand Peak | Northern Hemisphere summer (August–September) offers a window to capture seasonal demand spikes |
Source: TradingKey
Challenges Facing OPEC
Despite these opportunities, OPEC still faces substantial obstacles:
Challenge | Details |
Slowing Global Demand | World Bank, IMF, and OECD have all downgraded economic growth forecasts for 2025, raising concerns about oil demand |
Strong Trump Administration Support for U.S. Oil | Trump has pledged to deregulate the energy sector, promoting the slogan “Drill, baby, drill” |
Energy Transition Trends | China and Europe are accelerating efforts toward renewable energy, reducing reliance on fossil fuels |
OPEC Internal Disunity | Member states often fail to strictly adhere to agreed production quotas |
Asian Buyers Diversifying Supply | Major importers like China and India are seeking diversified sources beyond OPEC |
Source: TradingKey
Outlook for Global Oil Prices
Overall, major oil organizations and Wall Street institutions remain bearish on oil prices for 2025 and 2026, despite short-term volatility caused by geopolitical tensions.
In its May report, the IEA warned that rising trade uncertainty would weigh on global economic growth, dampening oil demand. Some independent producers said they would opt to trim rig counts and shave up to 9% off previous 2025 capital expenditure guidance.
Even amid rising geopolitical tensions, J.P. Morgan maintains its base case forecast of $60/bbl for 2025 and $60/bbl for 2026. Goldman Sachs projects Brent crude at $60/bbl in 2025 and $56/bbl in 2026.
According to a June survey of 28 banks conducted by law firm Haynes and Boone, the average WTI forecast for 2025 is $58.30/bbl, down about 6% from December 2024 expectations.
Recommended Articles


