Solana Price Forecast: SOL flashes bearish signals, risks double-digit crash

FXStreet
Updated
Mitrade
coverImg
Source: DepositPhotos

  • Solana price trades red on Monday, nearing the 200-day EMA at $162.42; a decisive close below could trigger further downside.

  • Bearish sentiment spikes, with CoinGlass data showing short positions at their highest level over a month.

  • Momentum indicators show growing weakness, with a potential downside target near $141.41 if support fails.

Solana (SOL) price shows early signs of a potential breakdown as it trades lower at $165.40 on Monday. SOL is approaching a key support level that could determine its next major move. Technical indicators flash red, and bearish sentiment intensifies, with short positions hitting a monthly high. If SOL closes below its critical support level, the selling pressure could accelerate, potentially driving the token into a double-digit decline toward the $141 mark.

Solana shows a bearish bias in momentum indicators

Solana price faced rejection around the $184.13 daily resistance level on May 14 and declined nearly 10% until Saturday. However, it recovered slightly the next day after finding support around its 200-day EMA at $162.42. This level roughly coincides with the daily support at $160 and the ascending trendline (drawn by joining multiple low levels since April 7), and a breakdown indicates a bearish trend. At the time of writing on Monday, it trades down at around $165.40, approaching its critical support zone.

If SOL continues its correction and closes below $160 on a daily basis, it could extend the decline by 14.6% from its current levels to retest its May 6 low of $141.41.

The Relative Strength Index (RSI) on the daily chart reads 54, pointing toward its neutral level of 50, indicating fading bullish momentum. If the RSI moves below its neutral level of 50, it would give rise to strong bearish momentum and a sharp fall in Solana prices. The Moving Average Convergence Divergence (MACD) indicator is also switching to a bearish crossover on the daily chart. If the crossover occurs, it would confirm another sell signal.
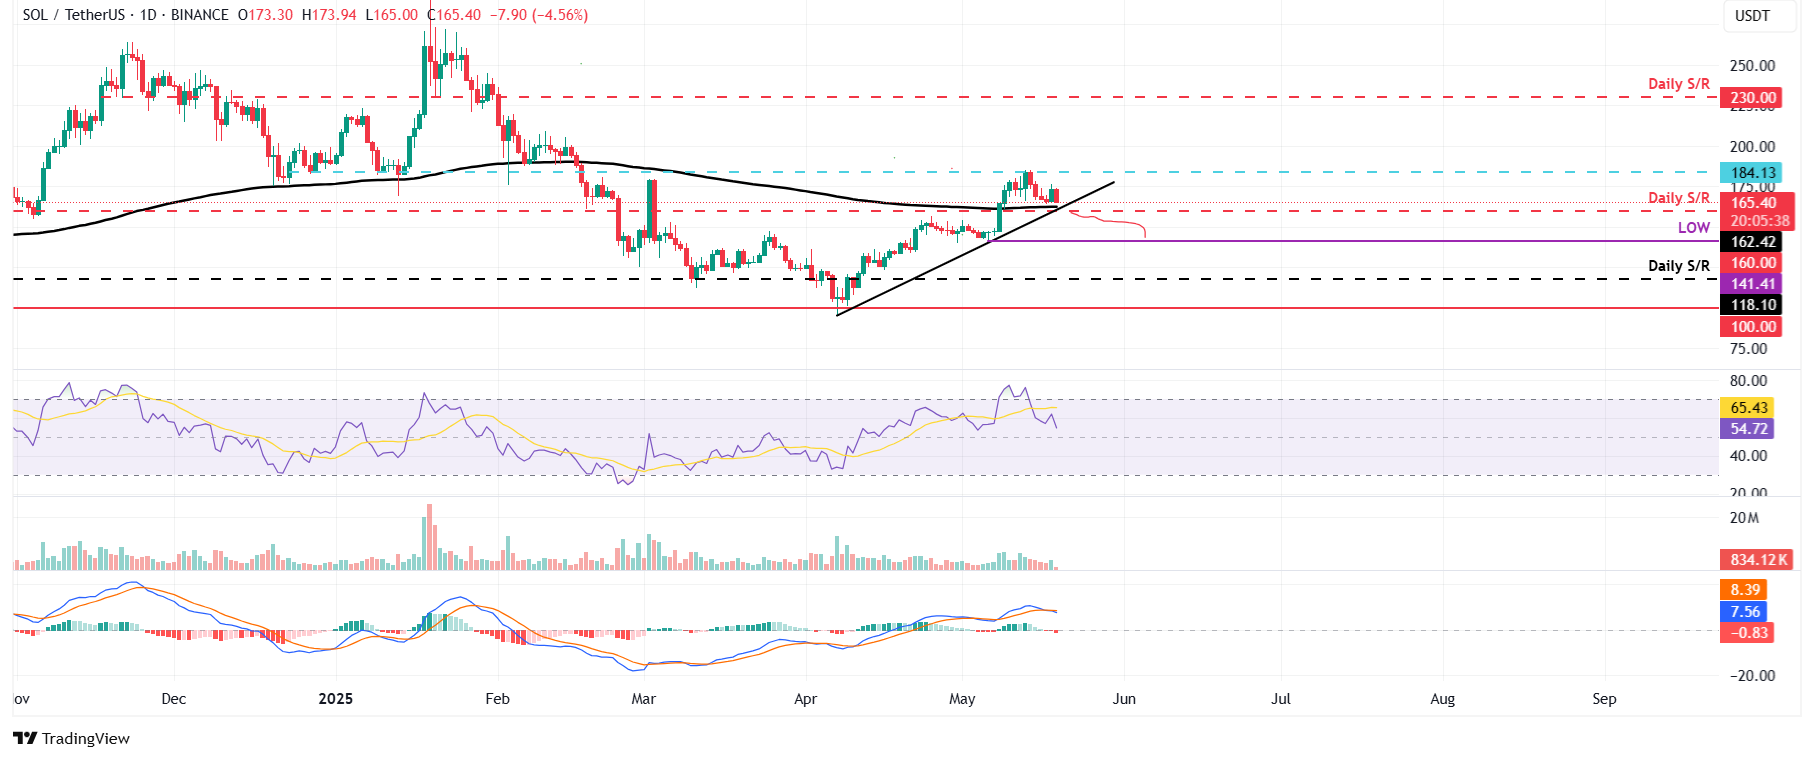
SOL/USDT daily chart

SOL/USDT daily chart

Another sign of a bearish outlook. According to Coinglass’s data, SOL’s long-to-short ratio reads 0.85, the lowest level over a month. This ratio below one reflects bearish sentiment in the markets as more traders are betting on Solana's price to fall.

Solana Long-to-short ratio chart. Source: Coinglass

Solana Long-to-short ratio chart. Source: Coinglass

However, if SOL finds support around the daily level at $160 and recovers, it could extend the recovery toward the next daily resistance at $184.13.

* The content presented above, whether from a third party or not, is considered as general advice only.  This article should not be construed as containing investment advice, investment recommendations, an offer of or solicitation for any transactions in financial instruments.

goTop
quote
Do you find this article useful?
Related Articles
placeholder
Chainlink Price Forecast: LINK rebounds as Real-World utility and bullish bets surgeChainlink (LINK) price continues to trade in green on Tuesday after rebounding from its key support level the previous week.
Author  FXStreet
23 hours ago
Chainlink (LINK) price continues to trade in green on Tuesday after rebounding from its key support level the previous week.
placeholder
AAVE eyes $300 breakout as Avara’s founder visits the White House Aave (AAVE) edges higher to $289, recording over 15% gains in the last 24 hours at press time. The increasing risk-on sentiment in the broader crypto market, with Bitcoin (BTC) hitting $110,000 on Monday, boosts the Decentralized Finance (DeFi) tokens.
Author  FXStreet
23 hours ago
Aave (AAVE) edges higher to $289, recording over 15% gains in the last 24 hours at press time. The increasing risk-on sentiment in the broader crypto market, with Bitcoin (BTC) hitting $110,000 on Monday, boosts the Decentralized Finance (DeFi) tokens.
placeholder
Meme Coins Rally Begins: Dogecoin, Shiba Inu, Pepe regain momentum as risk-on sentiment thrivesMeme coins market capitalization surged over 6% on Tuesday, surpassing $62 billion. Dogecoin (DOGE) and Shiba Inu (SHIB) recorded a rise of over 5% on Monday, while Pepe (PEPE) experienced a jump of over 8%.
Author  FXStreet
23 hours ago
Meme coins market capitalization surged over 6% on Tuesday, surpassing $62 billion. Dogecoin (DOGE) and Shiba Inu (SHIB) recorded a rise of over 5% on Monday, while Pepe (PEPE) experienced a jump of over 8%.
placeholder
Dogecoin (DOGE) Gains Bearish Momentum: A Buying Opportunity or Warning Sign?Dogecoin started a fresh decline from the $0.20 zone against the US Dollar. DOGE is now consolidating losses and might recover if it clears $0.180. DOGE price started a fresh decline below the
Author  NewsBTC
6 Month 06 Day Fri
Dogecoin started a fresh decline from the $0.20 zone against the US Dollar. DOGE is now consolidating losses and might recover if it clears $0.180. DOGE price started a fresh decline below the
placeholder
Altcoins crash as Bitcoin falls to $100K: LDO, JUP, and FET take the double-digit hitsA sharp pullback characterized the broader cryptocurrency market on Thursday, leading to a bearish pattern break in Bitcoin (BTC) to briefly test the $100k levels.
Author  FXStreet
6 Month 06 Day Fri
A sharp pullback characterized the broader cryptocurrency market on Thursday, leading to a bearish pattern break in Bitcoin (BTC) to briefly test the $100k levels.
Real-time Quote