
Silver Price Forecast: XAG/USD retreats from multi-week peak, slides below mid-$36.00s
- Silver corrects from its highest level since February 2012 set on Monday.
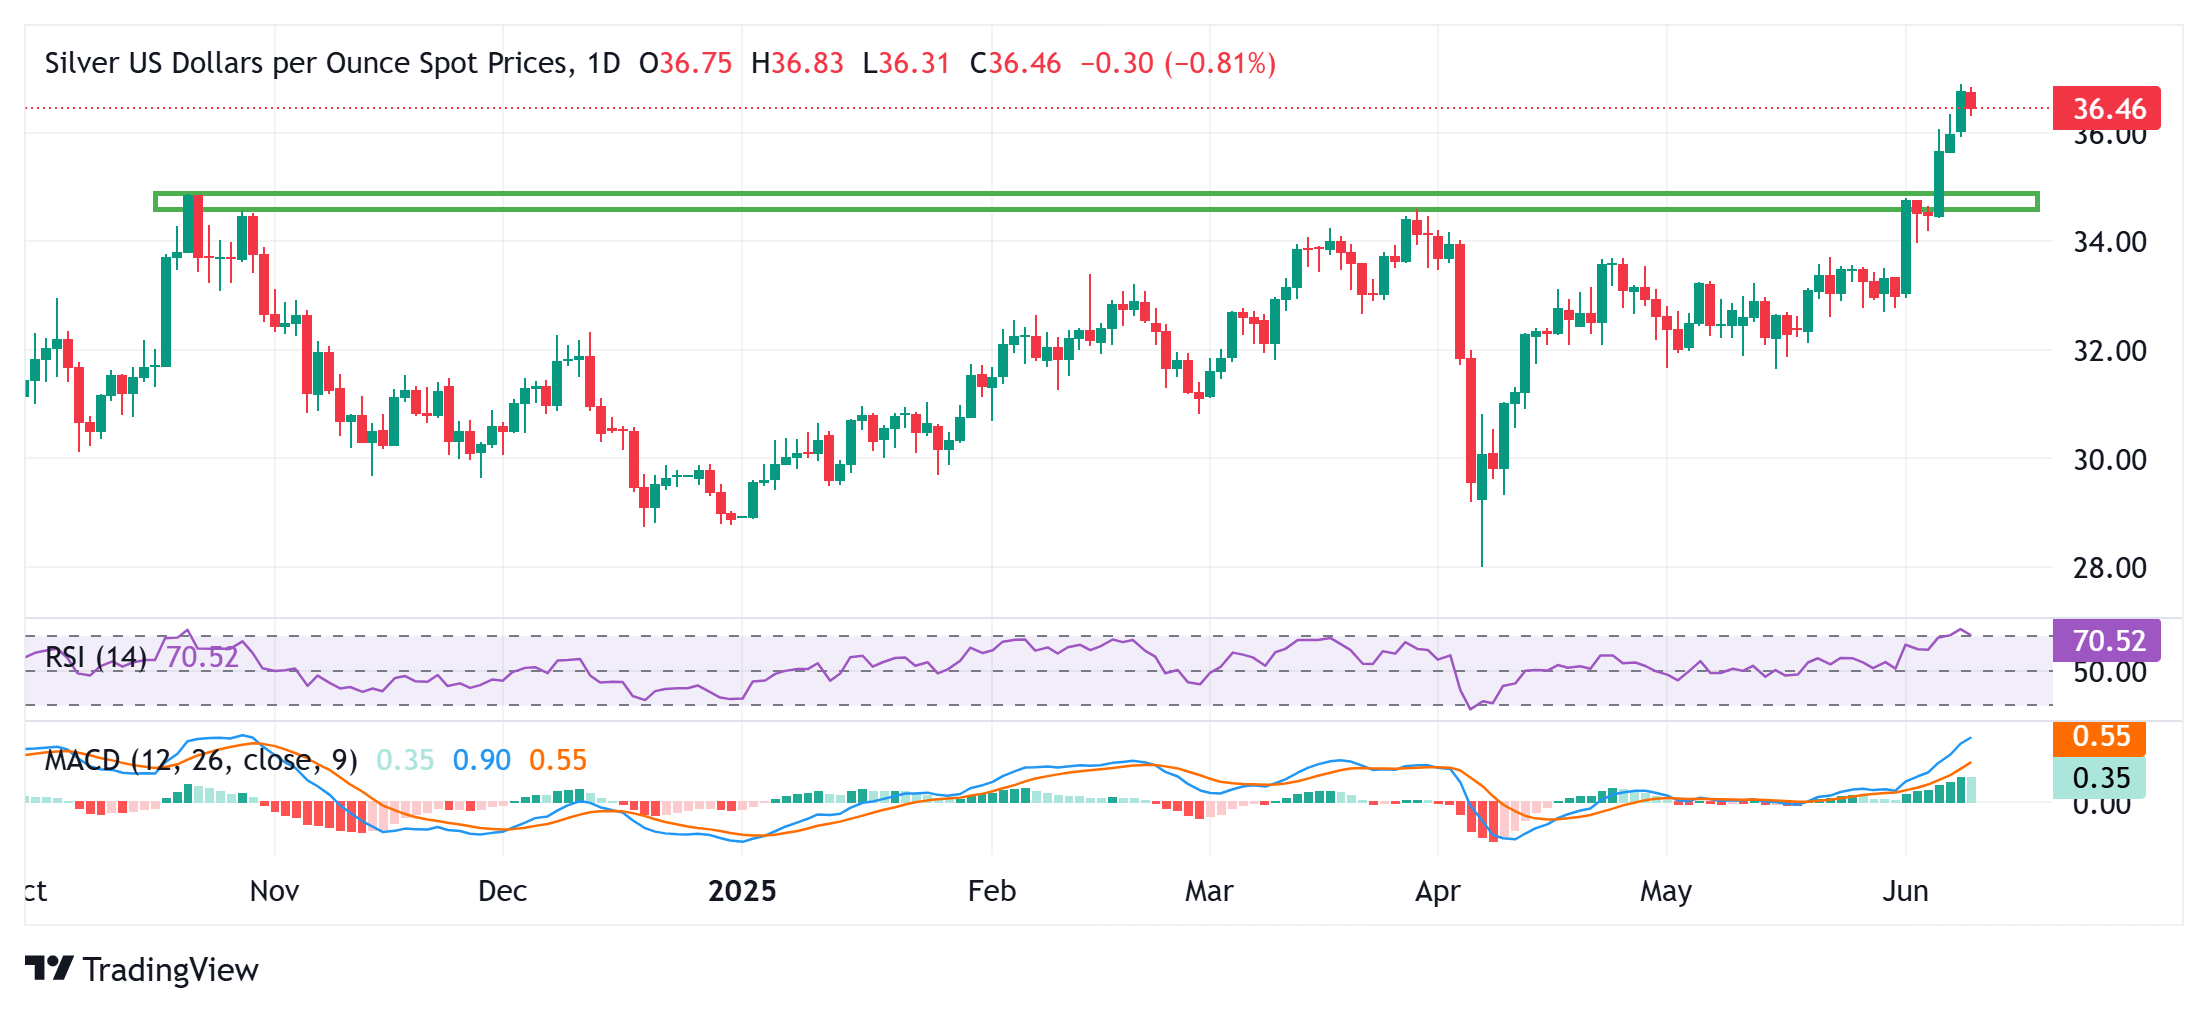
- A slightly overbought RSI prompts the XAG/USD bulls to lighten their bets.
- Any further slide could be seen as a buying opportunity and remain limited.
Silver (XAG/USD) sticks to modest intraday losses through the early European session on Tuesday and for now, seems to have snapped a three-day winning streak to the $37.00 neighborhood, or its highest level since February 2012. The white metal currently trades below mid-$36.00s, down 0.80% for the day.
The daily Relative Strength Index (RSI) is flashing slightly overbought conditions and prompts the XAG/USD bulls to take some profits off the table. However, the recent breakout through the previous multi-year peak and the subsequent move up favor suggests that any meaningful corrective pullback could be seen as a buying opportunity.
From current levels, the $36.00-$35.90 area could offer immediate support, below which the XAG/USD could extend the slide to the next relevant support near the $35.60 region en route to levels below the $35.00 psychological mark. The latter should act as a key pivotal point and a convincing break below would negate the constructive outlook. This, in turn, would shift the near-term bias in favor of bearish traders and pave the way for some meaningful downside.
On the flip side, bulls might now await a move beyond the $37.00 round figure before placing fresh bets and positioning for an extension of over a one-week-old uptrend. The XAG/USD might then retest the 2012 yearly swing high, around mid-$37.00s, before aiming to reclaim the $38.00 mark for the first time since September 2011.
Silver daily chart
Silver FAQs
Silver is a precious metal highly traded among investors. It has been historically used as a store of value and a medium of exchange. Although less popular than Gold, traders may turn to Silver to diversify their investment portfolio, for its intrinsic value or as a potential hedge during high-inflation periods. Investors can buy physical Silver, in coins or in bars, or trade it through vehicles such as Exchange Traded Funds, which track its price on international markets.
Silver prices can move due to a wide range of factors. Geopolitical instability or fears of a deep recession can make Silver price escalate due to its safe-haven status, although to a lesser extent than Gold's. As a yieldless asset, Silver tends to rise with lower interest rates. Its moves also depend on how the US Dollar (USD) behaves as the asset is priced in dollars (XAG/USD). A strong Dollar tends to keep the price of Silver at bay, whereas a weaker Dollar is likely to propel prices up. Other factors such as investment demand, mining supply – Silver is much more abundant than Gold – and recycling rates can also affect prices.
Silver is widely used in industry, particularly in sectors such as electronics or solar energy, as it has one of the highest electric conductivity of all metals – more than Copper and Gold. A surge in demand can increase prices, while a decline tends to lower them. Dynamics in the US, Chinese and Indian economies can also contribute to price swings: for the US and particularly China, their big industrial sectors use Silver in various processes; in India, consumers’ demand for the precious metal for jewellery also plays a key role in setting prices.
Silver prices tend to follow Gold's moves. When Gold prices rise, Silver typically follows suit, as their status as safe-haven assets is similar. The Gold/Silver ratio, which shows the number of ounces of Silver needed to equal the value of one ounce of Gold, may help to determine the relative valuation between both metals. Some investors may consider a high ratio as an indicator that Silver is undervalued, or Gold is overvalued. On the contrary, a low ratio might suggest that Gold is undervalued relative to Silver.
Recommended Articles


