WTI Price Forecast: WTI Crude Oil holds gains above $62, momentum builds for further upside

Source Fxstreet
  • WTI trades around $62.80 on Thursday, up 1.20% but below the session high of $63.30.
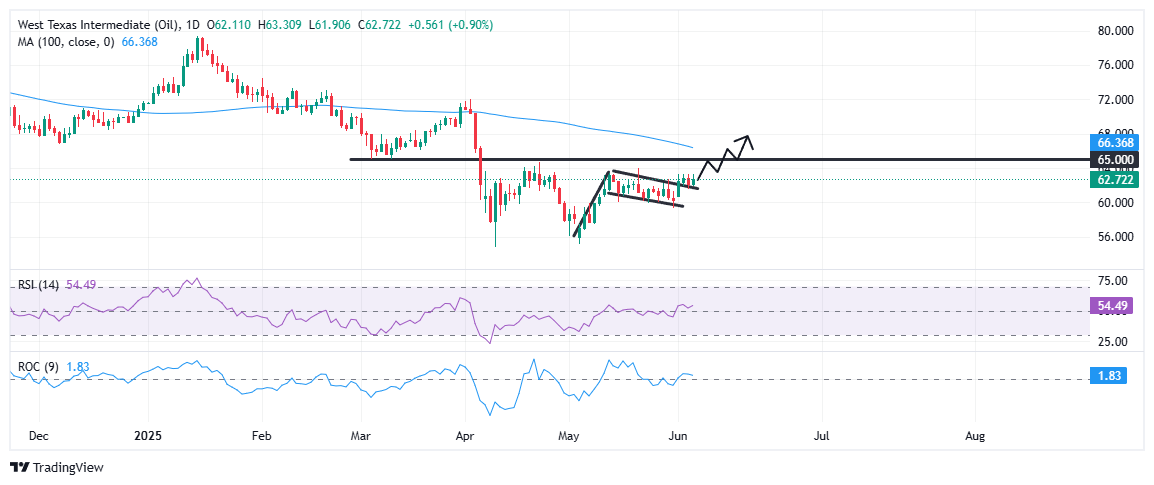
  • Price action breaks out of bullish flag pattern, confirming short-term upside bias.
  • Immediate resistance seen at $63.00–$63.50; sustained break could target $65.00 and $66.37 (100-day SMA).
  • Support rests at $62.00; a break below may drag prices back to $60.00.

West Texas Intermediate (WTI) crude oil extends its recovery on Thursday, building on early week gains as bulls capitalize on a bullish flag breakout. At the time of writing, WTI is trading around $62.80, up nearly 1.20% on the day, and slightly below the intraday high of $63.30. The recent price action reflects a healthy consolidation phase following Monday’s sharp 3% rally, suggesting that the upward momentum remains intact as traders eye key resistance levels ahead.

From a technical standpoint, the recent breakout from a bullish flag formation adds weight to the ongoing upside bias. This continuation setup emerged after Monday’s strong rally and was followed by a modest, downward-sloping pullback — a typical sign of profit-taking within an uptrend. 

The breakout has so far held above the $62.00 level, but bulls now face a near-term test at the $63.00–$63.50 resistance zone. This range, just shy of the week’s high, has acted as a short-term cap and needs to be cleared decisively to confirm bullish control and open the path toward the $65.00 psychological barrier, which has capped gains since mid-April. Furthermore, the 100-day Simple Moving Average (SMA) at $66.37 serves as the next major technical target.

On the downside, if WTI fails to hold above $62.00, prices could fall back into the flag pattern, with key support near the $60.00 round figure at the lower end of the channel. A break below that would weaken the bullish outlook.

Momentum indicators continue to support the upside setup. The 14-day Relative Strength Index (RSI) is gradually rising and currently stands at 54.49 — comfortably above the neutral 50 mark, indicating bullish momentum without flashing overbought conditions. The Rate of Change (ROC) indicator also holds in positive territory, signaling persistent upward pressure. As long as the price holds above $62.00, the bullish breakout remains valid. However, a sustained drop below this threshold would raise the risk of a false breakout, with a potential slide back into the flag channel and the $60.00 area emerging as critical support at the lower end of the pattern.
Disclaimer: For information purposes only. Past performance is not indicative of future results.
placeholder
Ripple May Be Releasing XRP Liquidity Via Backdoor, Claims Crypto PunditA provocative claim by crypto researcher “Darkhorse” has reignited debate over whether Ripple Labs is quietly sidestepping a federal court injunction through a newly disclosed $300 million XRP
Author  NewsBTC
10 hours ago
A provocative claim by crypto researcher “Darkhorse” has reignited debate over whether Ripple Labs is quietly sidestepping a federal court injunction through a newly disclosed $300 million XRP
placeholder
Dogecoin (DOGE) Gains Bearish Momentum: A Buying Opportunity or Warning Sign?Dogecoin started a fresh decline from the $0.20 zone against the US Dollar. DOGE is now consolidating losses and might recover if it clears $0.180. DOGE price started a fresh decline below the
Author  NewsBTC
10 hours ago
Dogecoin started a fresh decline from the $0.20 zone against the US Dollar. DOGE is now consolidating losses and might recover if it clears $0.180. DOGE price started a fresh decline below the
placeholder
Altcoins crash as Bitcoin falls to $100K: LDO, JUP, and FET take the double-digit hitsA sharp pullback characterized the broader cryptocurrency market on Thursday, leading to a bearish pattern break in Bitcoin (BTC) to briefly test the $100k levels.
Author  FXStreet
10 hours ago
A sharp pullback characterized the broader cryptocurrency market on Thursday, leading to a bearish pattern break in Bitcoin (BTC) to briefly test the $100k levels.
placeholder
Bitcoin Network Activity Booming Despite A Quiet Market—DataBitcoin’s price has barely moved in the last week, but other signs point to growing activity on the network. On June 5, Bitcoin traded around $104,300, down 0.50% in 24 hours and off 2.5% over the
Author  NewsBTC
10 hours ago
Bitcoin’s price has barely moved in the last week, but other signs point to growing activity on the network. On June 5, Bitcoin traded around $104,300, down 0.50% in 24 hours and off 2.5% over the
placeholder
Gold price trades with positive bias below $3,400, multi-week top ahead of US NFPGold price (XAU/USD) attracts some dip-buying during the Asian session on Friday and reverses a part of the previous day's retracement slide from levels just above the $3,400 mark or over a four-week peak.
Author  FXStreet
10 hours ago
Gold price (XAU/USD) attracts some dip-buying during the Asian session on Friday and reverses a part of the previous day's retracement slide from levels just above the $3,400 mark or over a four-week peak.
Related Instrument
goTop
quote