


GBP/USD steadies near 1.3165 as markets brace for key US jobs data
- GBP/USD steady as markets await first US jobs report since government reopening.
- Fed cut odds fall to 43% amid hawkish commentary, lifting DXY to 99.52 and denting risk sentiment.
- UK investors relieved as Chancellor Reeves rules out tax hikes; soft CPI could cement December BoE cut.
The Pound Sterling remains firm during the North American session as traders prepare for the first jobs report from the US, which would be released on Thursday, a day which usually features Initial Jobless Claims. At the time of writing, the GBP/USD trades at 1.3166, virtually unchanged.
Sterling holds firm while hawkish Fed commentary lifts the Dollar and BoE expectations hinge on upcoming UK inflation
The Greenback is recovering some ground after last week, most of the Federal Reserve officials struck hawkish commentary, triggering a re-pricing of a rate cut by the central bank at the December meeting. Data from the CME FedWatch Tool shows odds at 43% for a 25 basis points cut.
Consequently, the US Dollar Index (DXY), which tracks the performance of the buck against a basket of six currencies, is up 0.25% at 99.52. In addition of a hawkish Fed, market player fears of a possible AI bubble, triggered a sell-off in US equity markets.
US Treasury yields are slightly down, with the 10-year note yielding 4.137% down one and a half basis points.
In the UK, investor are relieved by reports that Chancellor Rachel Reeves has no plans to hike income tax rates in the Autmn budget, contrarily to what investors had been anticipating due to the fiscal hole.
The UK’s economy has begun to show signs of weakness following last week’s GDP figures. Now is the time for the release of the Consumer Price Index (CPI), which is expected to open the door for the Bank of England (BoE) to cut rates at the December meeting.
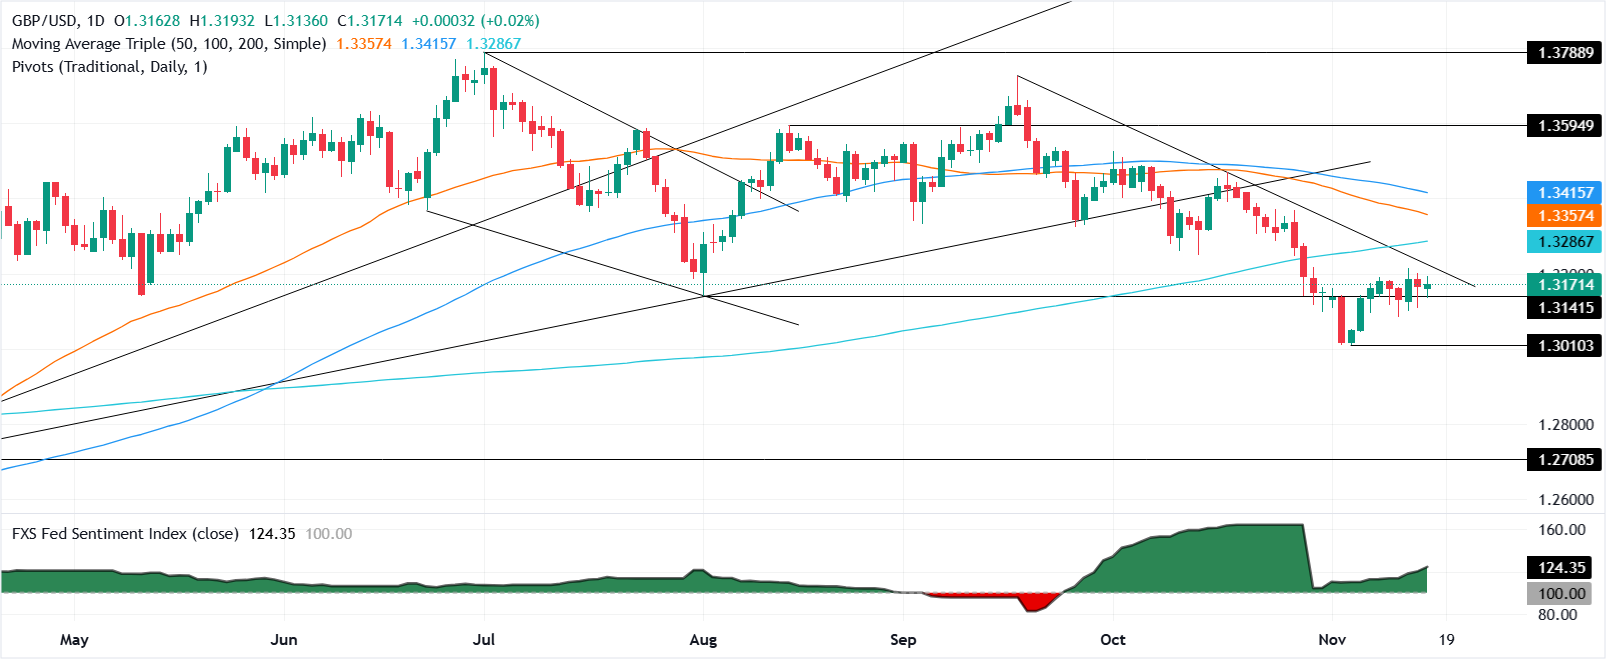
GBP/USD Price Forecast: Technical outlook
The technical picture indicated the GBP/USD is consolidated, trapped within the November 13 low/high of 1.3100/1.3193 unable to decisive clear either side of the range, an indication of indecision. The Relative Strength Index (RSI) suggests that momentum is bearish, with the index standing below the 50 neutral level.
If buyers reclaim the 20-day SMA at 1.3197, further upside lies ahead, up next with the 200-day SMA at 1.3284. A breach of the latter clears the way for 1.3300. Conversely if GBP/USD drops below 1.3100, a resumption of the downtrend could put in play the November 5 swing low of 1.3010.
Pound Sterling Price Today
The table below shows the percentage change of British Pound (GBP) against listed major currencies today. British Pound was the strongest against the Australian Dollar.
| USD | EUR | GBP | JPY | CAD | AUD | NZD | CHF | |
|---|---|---|---|---|---|---|---|---|
| USD | 0.18% | -0.01% | 0.36% | 0.06% | 0.53% | 0.22% | 0.15% | |
| EUR | -0.18% | -0.21% | 0.18% | -0.13% | 0.34% | 0.03% | -0.02% | |
| GBP | 0.01% | 0.21% | 0.35% | 0.07% | 0.53% | 0.22% | 0.17% | |
| JPY | -0.36% | -0.18% | -0.35% | -0.30% | 0.17% | -0.14% | -0.20% | |
| CAD | -0.06% | 0.13% | -0.07% | 0.30% | 0.47% | 0.15% | 0.09% | |
| AUD | -0.53% | -0.34% | -0.53% | -0.17% | -0.47% | -0.31% | -0.36% | |
| NZD | -0.22% | -0.03% | -0.22% | 0.14% | -0.15% | 0.31% | -0.05% | |
| CHF | -0.15% | 0.02% | -0.17% | 0.20% | -0.09% | 0.36% | 0.05% |
The heat map shows percentage changes of major currencies against each other. The base currency is picked from the left column, while the quote currency is picked from the top row. For example, if you pick the British Pound from the left column and move along the horizontal line to the US Dollar, the percentage change displayed in the box will represent GBP (base)/USD (quote).
Recommended Articles


