
Top 3 Crypto Price Prediction: Bitcoin, Ethereum, and Ripple– Weekend gains at risk amid US-China trade talks


Bitcoin risks slipping below $105,000 on Monday amid the US-China trade talks, potentially setting the tone for the week.
Ethereum’s fluctuation around the 200-day EMA could continue as it edges below $2,500.
Ripple’s XRP struggles to exceed the 50-day EMA with a double bottom reversal, risks a pullback to $2.00.
The broader cryptocurrency market edges marginally higher on Monday as underlying weakness gradually takes effect. Bitcoin (BTC), Ethereum (ETH), and Ripple’s XRP are facing headwinds after a minor recovery over the weekend, risking a reversal similar to the flash crash on Thursday.
The US-China trade talks scheduled for Monday in London are a highly volatile catalyst, with the potential to cause sharp movements, as seen in the previous discussion on May 12 in Geneva. The 90-day pause in tariffs sparked a quick recovery in the S&P 500 and a delayed reaction in Bitcoin.
Ahead of the discussions between Trade Secretary Scott Bessent and Vice Premier He Lifeng, the short-term weakness in the crypto market warns of speculation-based corrective measures. This suggests the investors cashing out to mitigate the risks of any pushback in the top officials' meeting.
Bitcoin risks a double top reversal to $100K
Bitcoin consolidates above $105,000 for two days as it recovers from the sharp drop witnessed on Thursday. At the time of writing, BTC trades at $105,621, failing to overcome the $106,058 resistance level, December’s highest closing price.
The price action movement warns of a double top reversal alongside a short-term resistance trendline, adding headwinds. Traders anticipating a bullish trend must await a daily closing above $106,058 to avoid any traps.
A potential breakout could prolong Bitcoin’s trend towards its all-time high at $111,980.
Investors must look out for a buy signal from the Moving Average Convergence/Divergence (MACD) indicator. The blue line crossing above the red line concurrent with a rise of the green histogram bar above the zero line signals an uptrend.
However, the Relative Strength Index (RSI) at 53 is turning sideways near the halfway line, aligning with the uncertainty in BTC. Notably, a lack of divergence between the two recent RSI peaks and a potential double top in Bitcoin limit the bearish risk.
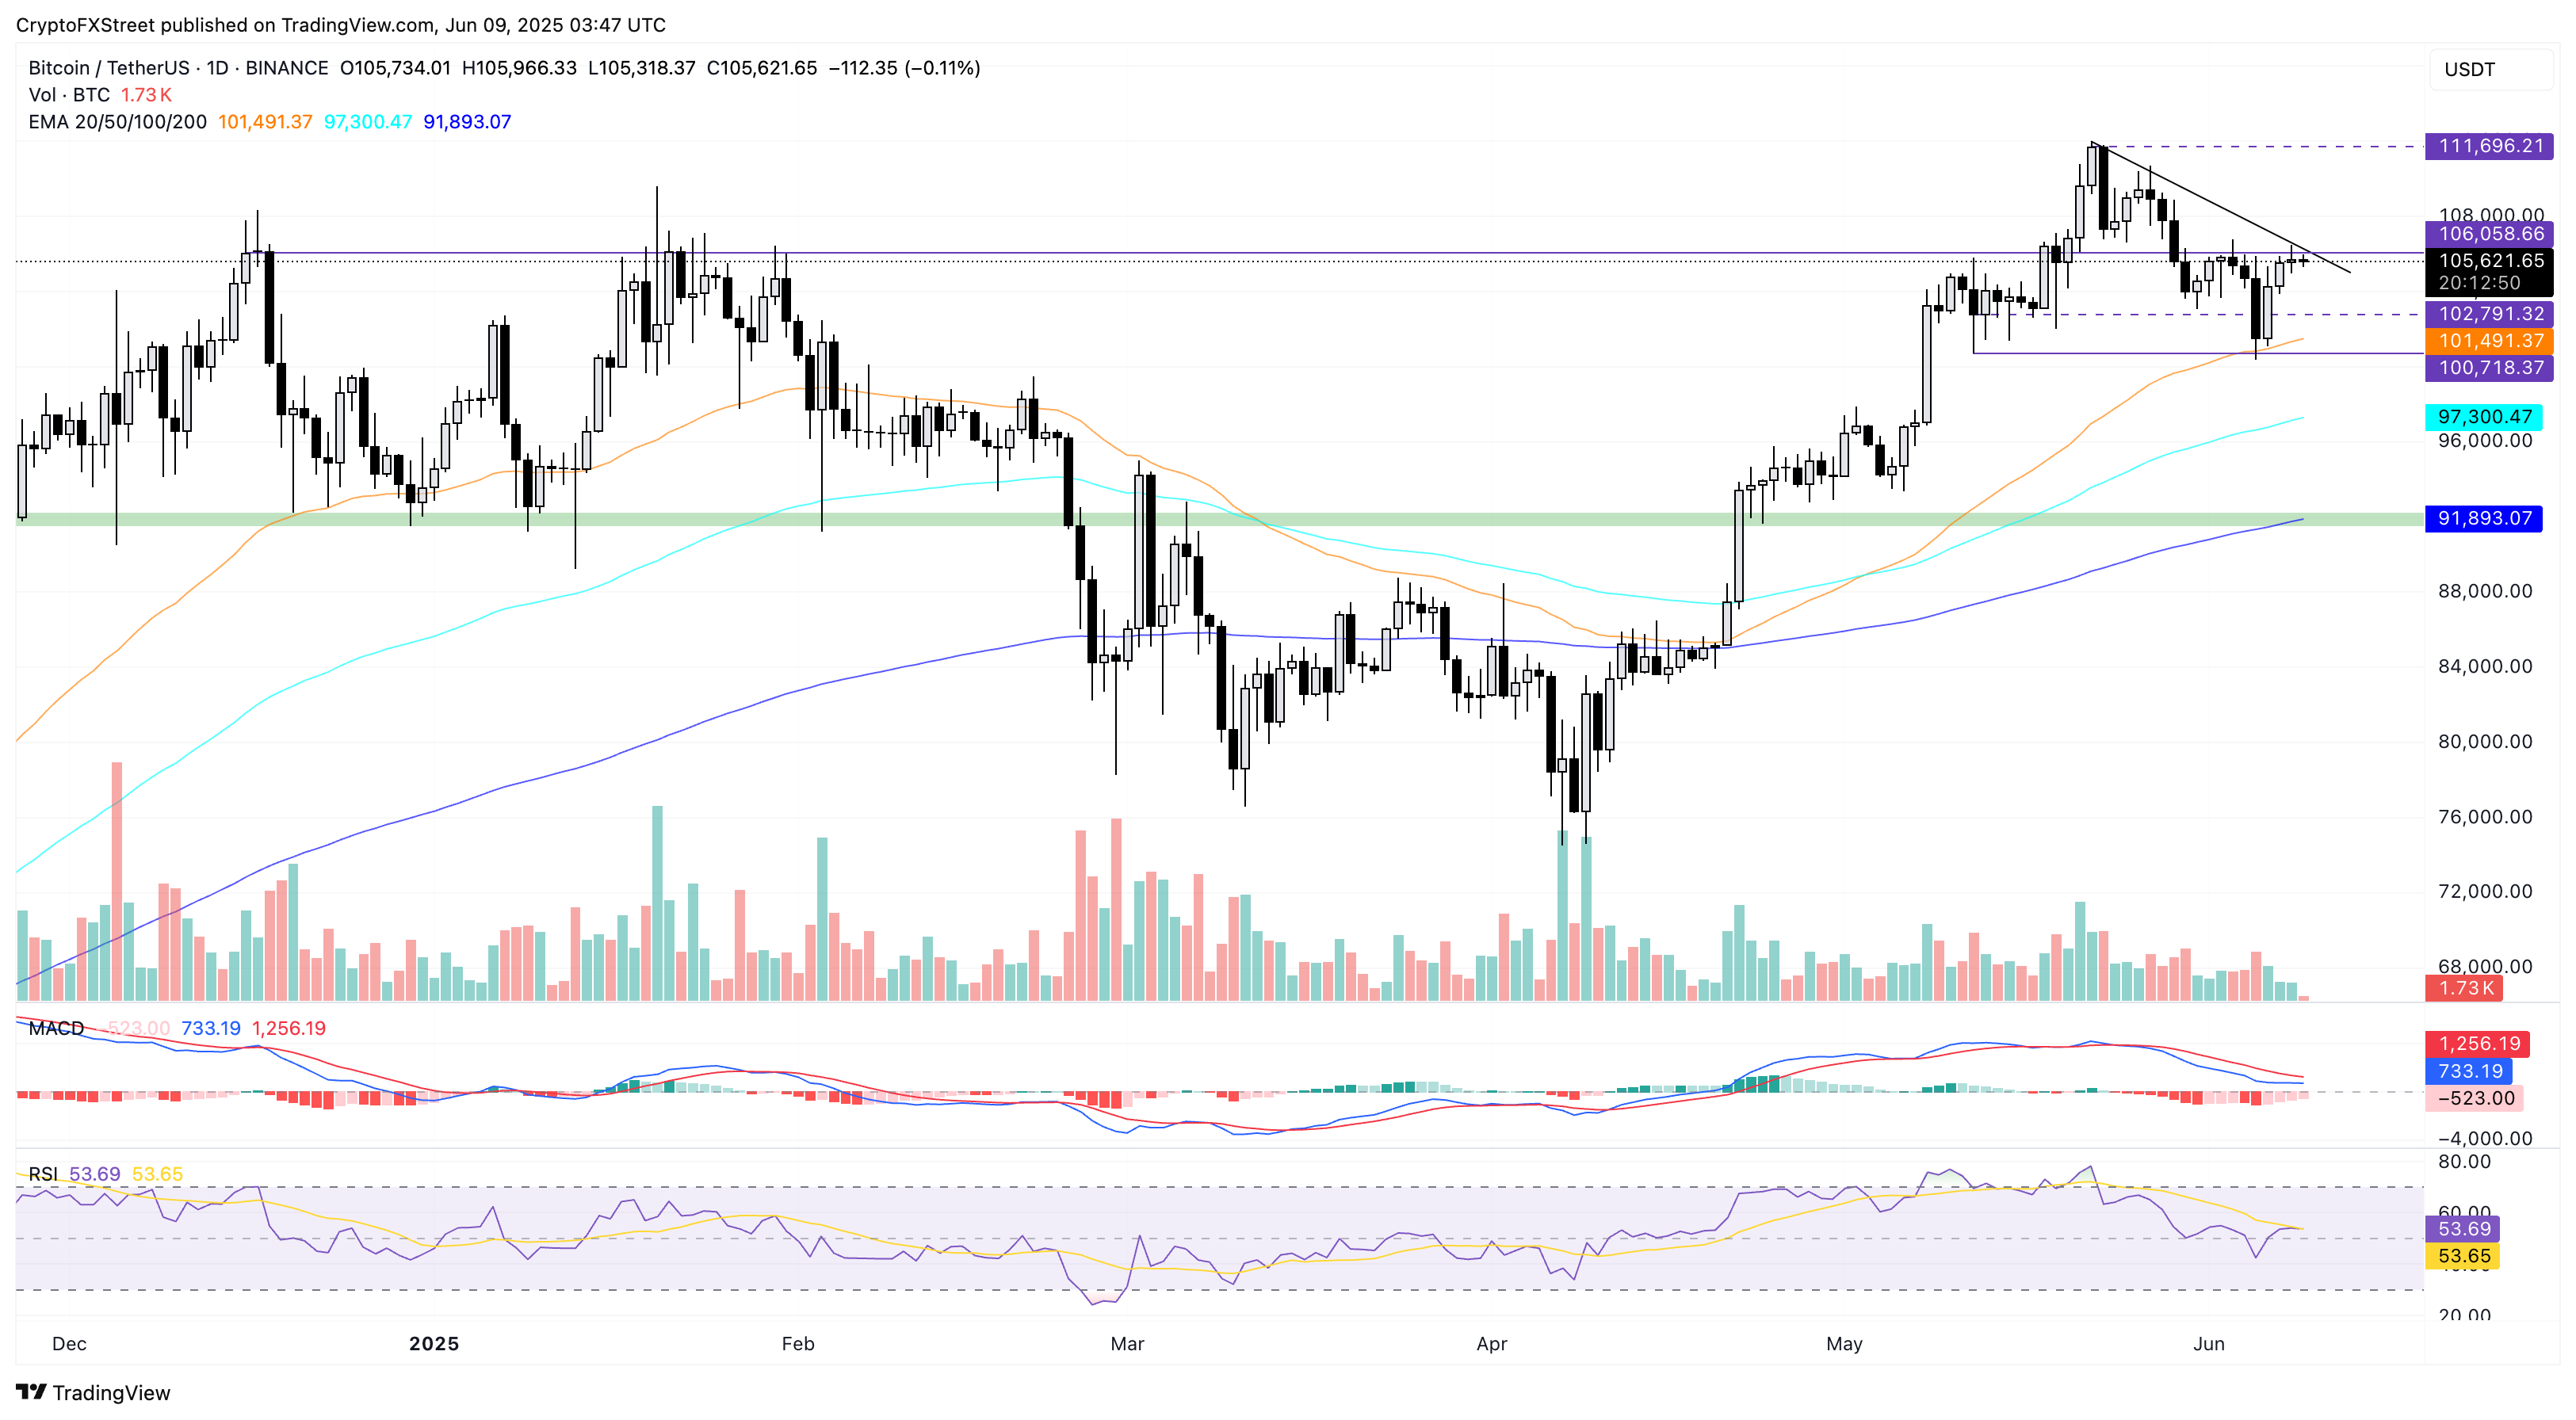
BTC/USDT daily price chart. Source: Tradingview
On the other hand, amid the rising uncertainty due to the scheduled talks in London, Bitcoin could retest the $100,718 support floor, last tested by the low on Thursday.
Ethereum’s grip loosening over the 200-day EMA
Ethereum extends its losses below $2,500 with a nearly 1% drop at press time on Monday. The price action warns of a reversal with an evening star pattern, characterized by a 2% rise on Saturday, followed by a Doji candle on Sunday.
Notably, Ethereum failed to reclaim the lost $2,600 floor during the Thursday crash, projecting strong headwinds overhead. Furthermore, investors must remain cautious as the momentum indicators signal rising selling pressure.
The MACD and its signal line decline towards the zero line, while the red histograms surge below this line, indicating a downtrend is in play. The daily RSI line steps towards the halfway line, diverging from the sideways trend in Ethereum. This marks a bearish divergence, warning of a steeper correction.
Traders can find selling opportunities if the biggest altcoin closes below the 200-day Exponential Moving Average (EMA) at $2,461, with the next support at $2,357, the 50-day EMA.
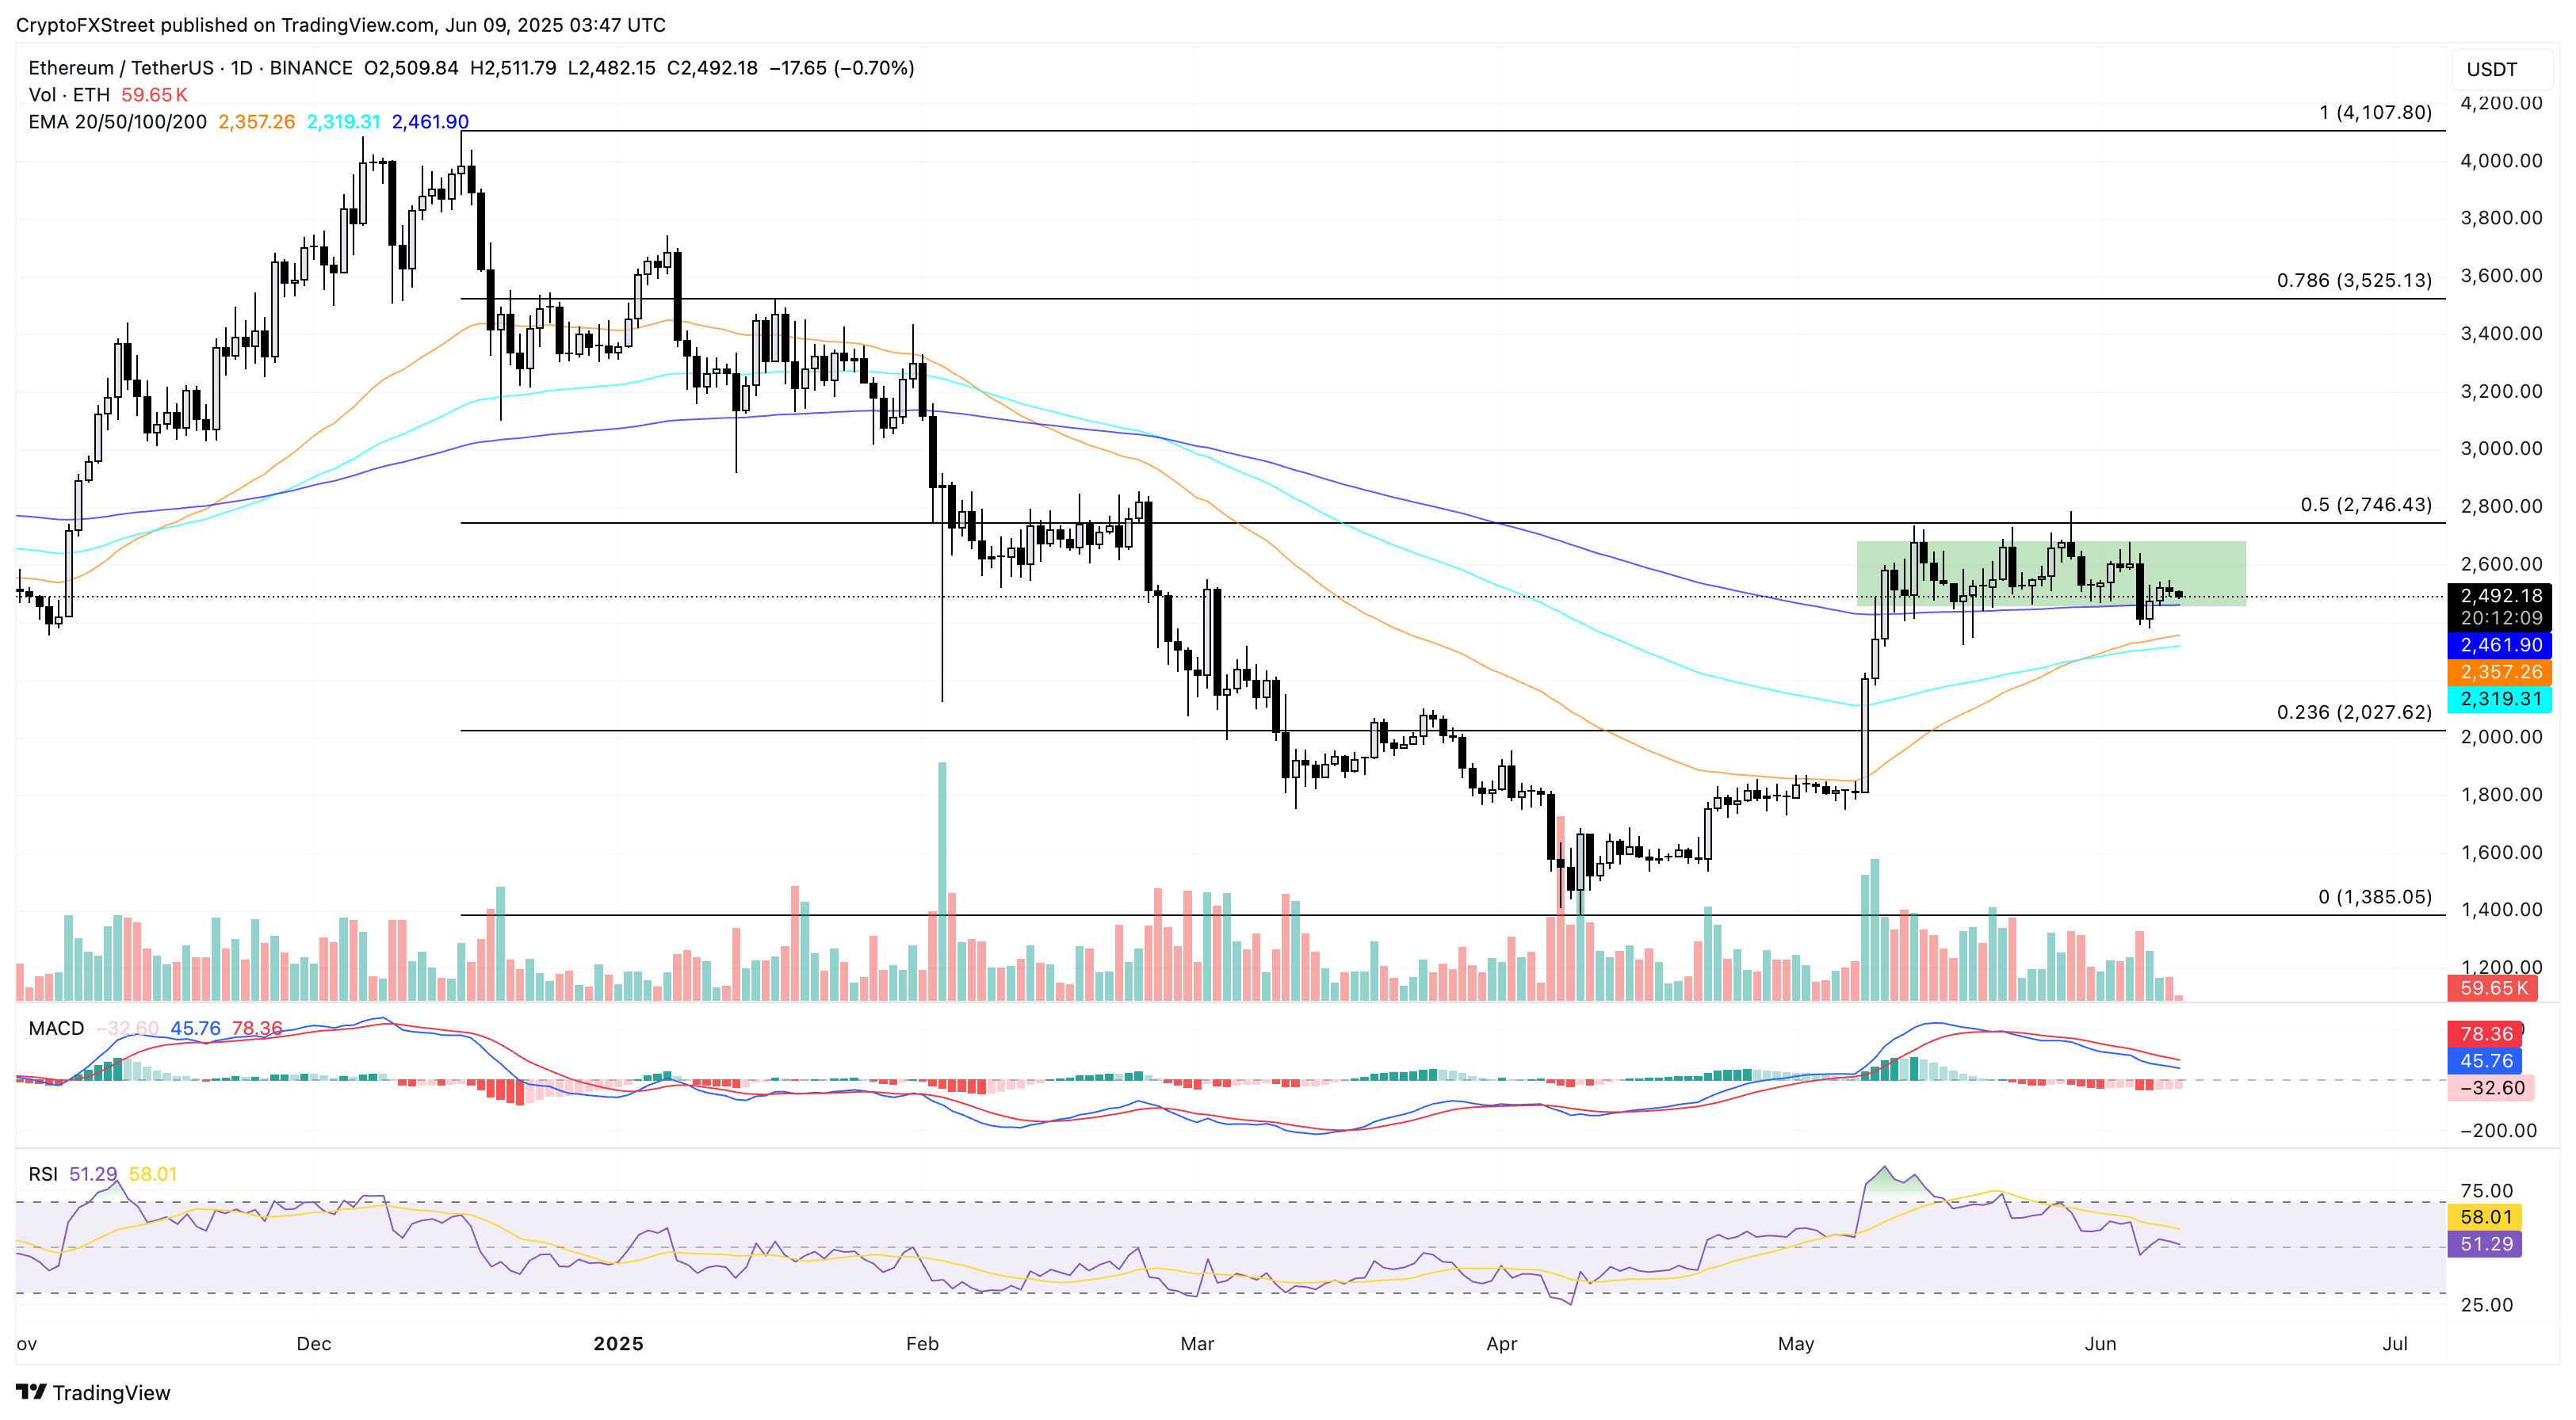
ETH/USDT daily price chart. Source: Tradingview
Conversely, a bullish reversal could encounter resistance at the $2,700 barrier, potentially leading to multiple peaks formed in May.
Ripple’s XRP struggles to exceed the 50-day EMA
XRP is down almost 2% at the time of writing on Monday, failing to overcome the dynamic resistance of the 50-day EMA. For nearly two weeks, XRP has remained trapped between the 200-day EMA and the 50-day EMA.
The consolidation range witnesses a failed double bottom reversal despite the 4% surge on Sunday. With the intraday fall, XRP retraces lower towards the 200-day EMA at $2.08, indicating another pullback in the coming days.
However, investors must pay close attention to the MACD indicator on the verge of triggering a buy signal as the blue line nears crossing the red line. Further up, the RSI at 48 bounces back towards the halfway line, indicating recovery in bullish momentum.
A potential daily close above the 50-day EMA at $2.25 could propel XRP to May’s highest closing at $2.58.
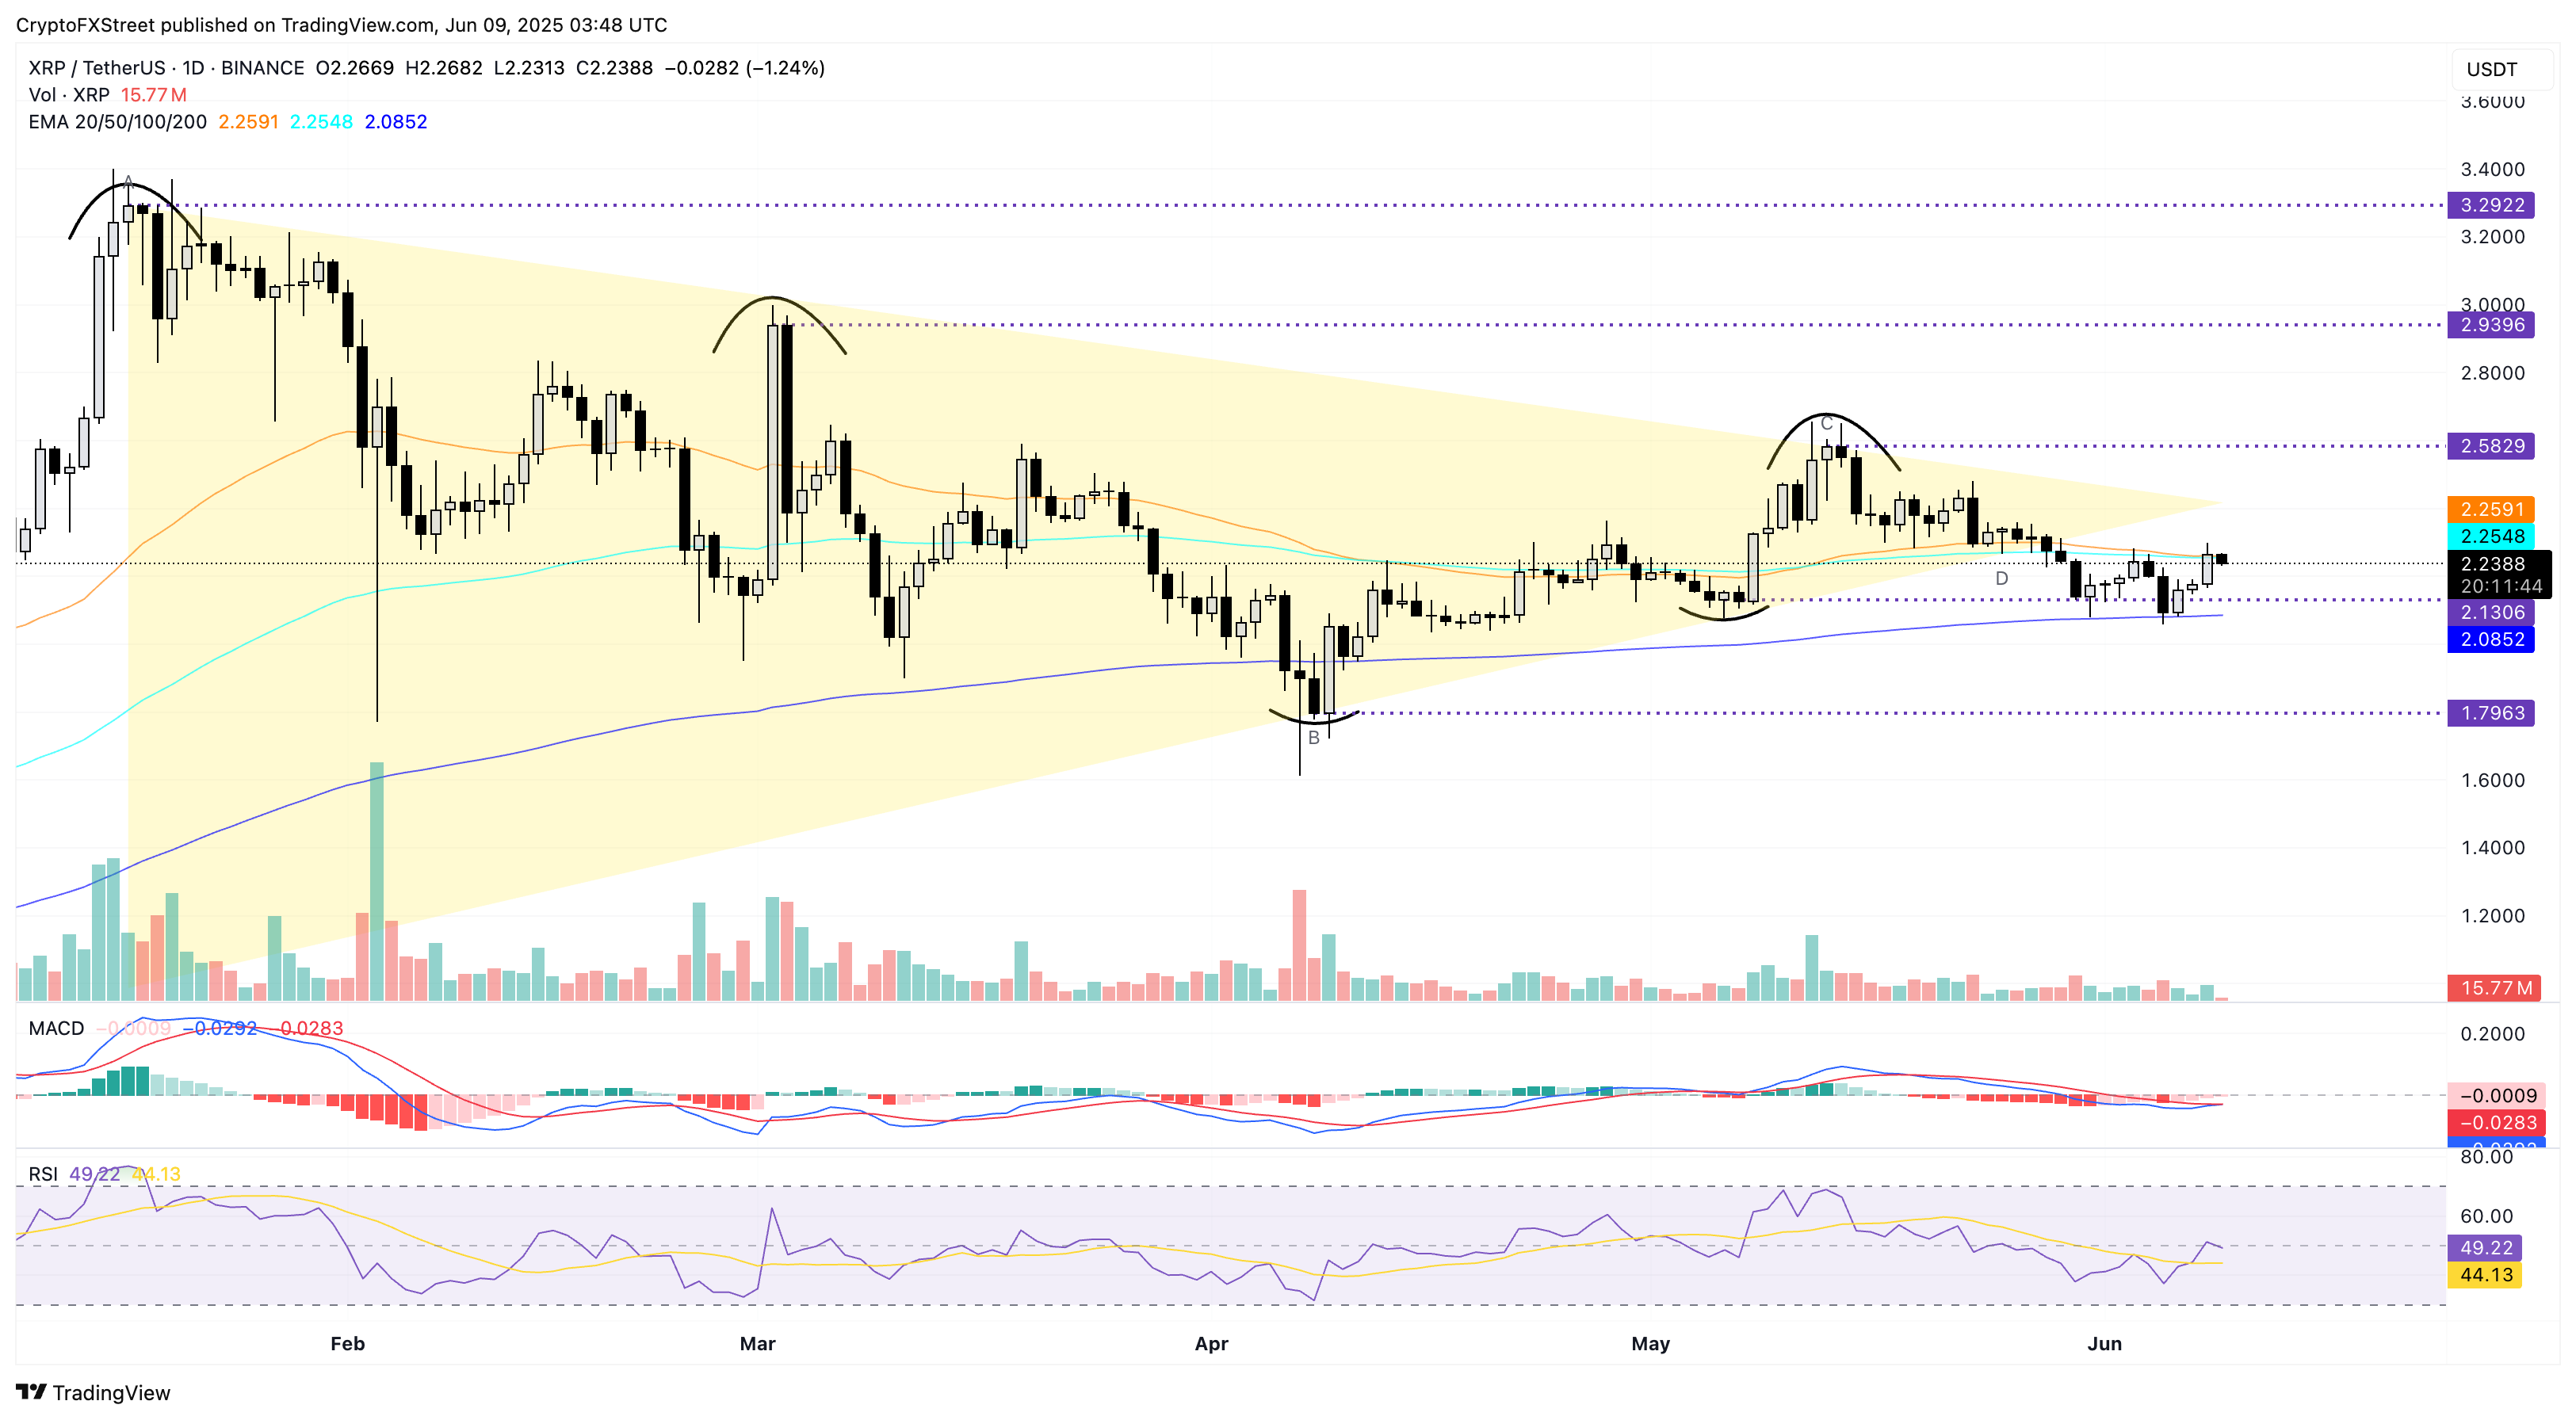
XRP/USDT daily price chart. Source: Tradingview
On the downside, a closing below $2.08 could extend the correction to $1.79 support, the lowest closing price in April.
* The content presented above, whether from a third party or not, is considered as general advice only. This article should not be construed as containing investment advice, investment recommendations, an offer of or solicitation for any transactions in financial instruments.


