
Japanese Yen hangs near one-month low against USD amid trade optimism
- The Japanese Yen kicks off the new week on a weaker note amid the US-China trade deal optimism.
- The Fed’s hawkish pause and easing US recession fears underpin the USD and support USD/JPY.
- BoJ rate hike bets could strengthen JPY ahead of the US-China joint statement on trade talks.
The Japanese Yen (JPY) touches a one-month low against a broadly stronger US Dollar (USD) during the Asian session on Monday in reaction to the US-China trade deal optimism. The US and China ended high-stakes trade talks in Switzerland on a positive note on Sunday, boosting investors' confidence and undermining demand for traditional safe-haven assets, including the JPY. Apart from this, worries about Japan's growth outlook on the back of US tariffs uncertainty further weigh on the JPY. The USD, on the other hand, drew support from the Federal Reserve's (Fed) hawkish pause earlier this month and easing concerns about a recession in the US.
Traders, however, might refrain from placing aggressive bets and opt to wait for the US-China joint statement on Geneva trade talks. Moreover, Japan’s upbeat Household Spending data released on Friday boosted the case for further policy normalization by the Bank of Japan (BoJ) and should help limit deeper JPY losses. Meanwhile, prospects for more interest rate hikes by the BoJ mark a big divergence in comparison to expectations for at least three rate cuts by the Fed. This, in turn, warrants some caution before positioning for an extension of the USD/JPY pair's recent goodish recovery from the year-to-date low, levels just below the 140.00 psychological mark.
Japanese Yen bulls remain on the defensive as trade optimism undermines demand for traditional safe-haven assets
- US Treasury Secretary Scott Bessent and Trade Representative Jamieson Greer said on Sunday that a trade deal had been struck with China. Adding to this, China's Vice Premier He Lifeng said that the high-stakes meeting achieved substantial progress and reached important consensus on issues of concern to both countries.
- The optimism triggers a fresh wave of global risk-on trade at the start of a new week, which is evident from strong gains around the equity markets and, in turn, undermines the safe-haven Japanese Yen. However, neither side mentioned any agreement to cut US tariffs of 145% on Chinese goods and China's 125% tariffs on US goods.
- Hence, investors might opt to wait for a joint statement from the US and China on Geneva trade talks later today, which could outline the details and framework of the deal. China's Vice Commerce Minister Li Chenggang was quoted as saying that "no matter when this statement is released, it’s going to be big news and good news for the world."
- Meanwhile, positive developments help to ease market concerns that an all-out trade war might trigger a US recession. Adding to this, the Federal Reserve's hawkish signal that it is not leaning towards cutting interest rates anytime soon assists the US Dollar to stand firm near its highest level since April 10, touched on Friday.
- Meanwhile, Japan's robust Household Spending data and a fall in real wages for the third straight month in March contributed to fears of broader, more entrenched price increases in Japan. This backs the case for further interest rate hikes by the Bank of Japan, though the trade uncertainty forced the central bank to adopt a cautious stance.
- In fact, BoJ Governor Kazuo Ueda acknowledged that the timeline for underlying inflation to reach the central bank's 2% target has been delayed. However, minutes from the BoJ's monetary policy meeting held on March 18-19 revealed last Thursday that the central bank remains ready to hike interest rates further if inflation trends hold.
- Investors now look forward to the release of US inflation figures later this week, which, along with Fed Chair Jerome Powell's appearance on Thursday, will influence the USD price dynamics. Apart from this, Japan's first-quarter Gross Domestic Product report on Friday should provide some meaningful impetus to the USD/JPY pair.
USD/JPY seems poised to appreciate further, towards testing the 61.8% Fibo. level near the 146.80-146.85 area
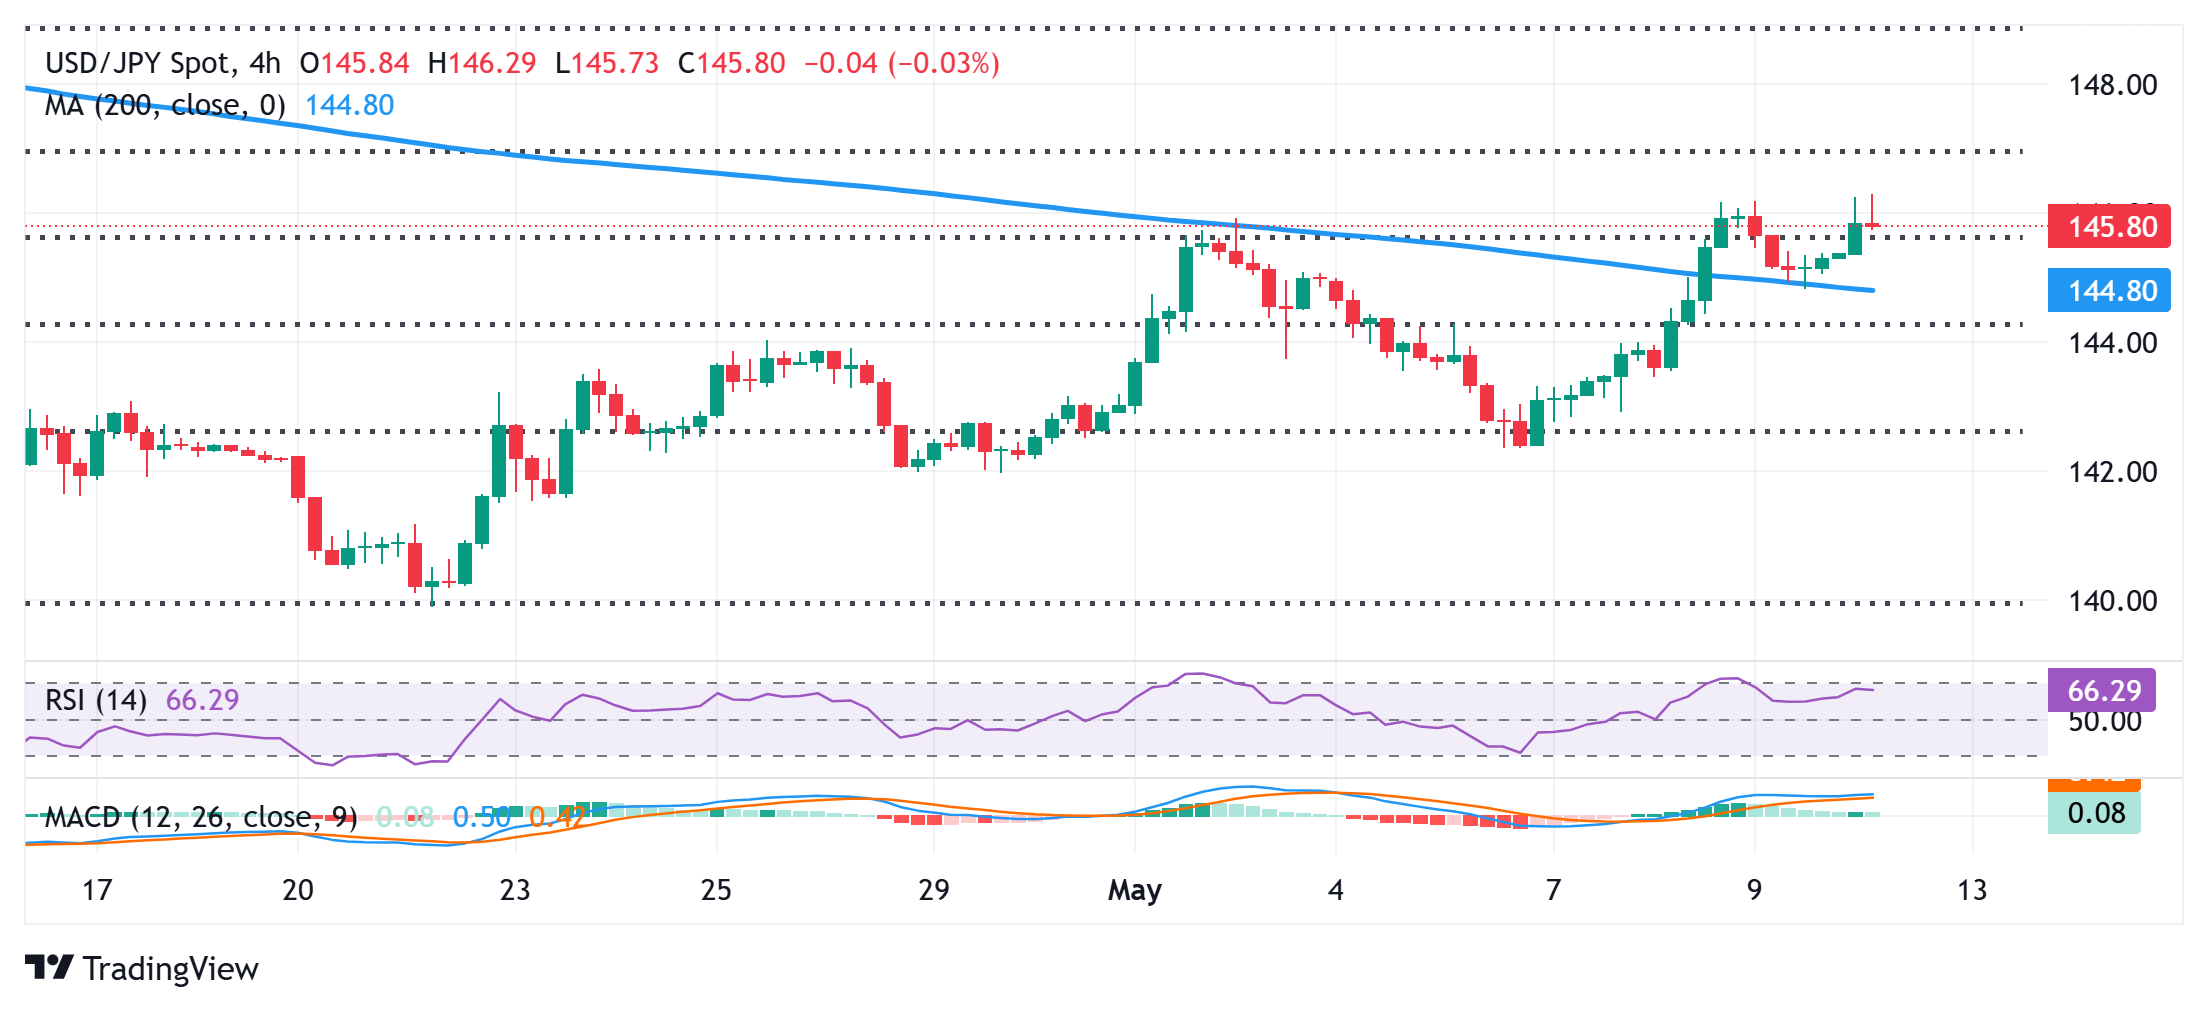
From a technical perspective, the USD/JPY pair now seems to have found acceptance above the 50% Fibonacci retracement level of the March-April downfall. Moreover, oscillators on the daily chart have again started gaining positive traction and are holding in the bullish territory on hourly charts, suggesting that the path of least resistance for spot prices is to the upside. Hence, some follow-through strength towards the 146.80-146.85 region, representing the 61.8% Fibo. level, looks like a distinct possibility. This is closely followed by the 147.00 round-figure mark, which, if cleared, should set the stage for a further near-term appreciating move.
On the flip side, the 145.55 area, or the 50% level, now seems to protect the immediate downside, below which the USD/JPY could accelerate the slide towards the 145.00 psychological mark. The latter coincides with the 200-period Simple Moving Average (SMA) on the 4-hour chart and should act as a pivotal point. A convincing break below might prompt some technical selling and drag spot prices to the next relevant support near the 144.45 region en route to the 144.00 round figure.
US-China Trade War FAQs
Generally speaking, a trade war is an economic conflict between two or more countries due to extreme protectionism on one end. It implies the creation of trade barriers, such as tariffs, which result in counter-barriers, escalating import costs, and hence the cost of living.
An economic conflict between the United States (US) and China began early in 2018, when President Donald Trump set trade barriers on China, claiming unfair commercial practices and intellectual property theft from the Asian giant. China took retaliatory action, imposing tariffs on multiple US goods, such as automobiles and soybeans. Tensions escalated until the two countries signed the US-China Phase One trade deal in January 2020. The agreement required structural reforms and other changes to China’s economic and trade regime and pretended to restore stability and trust between the two nations. However, the Coronavirus pandemic took the focus out of the conflict. Yet, it is worth mentioning that President Joe Biden, who took office after Trump, kept tariffs in place and even added some additional levies.
The return of Donald Trump to the White House as the 47th US President has sparked a fresh wave of tensions between the two countries. During the 2024 election campaign, Trump pledged to impose 60% tariffs on China once he returned to office, which he did on January 20, 2025. With Trump back, the US-China trade war is meant to resume where it was left, with tit-for-tat policies affecting the global economic landscape amid disruptions in global supply chains, resulting in a reduction in spending, particularly investment, and directly feeding into the Consumer Price Index inflation.
Artigos Recomendados


