
Crypto Today: Digital asset inflows hit $3.3 billion as Bitcoin, Ethereum, Cardano rekindle bullish prospects
- Digital asset inflows amounted to $3.3 billion last week, propelling the YTD total to $10.8 billion as bullish sentiment steadies.
- Spot Bitcoin ETFs recorded approximately $2.75 billion net inflow volume last week, marking the third-highest weekly inflow in history.
- Bitcoin gains strength following weekend sell-off, supported by positive sentiment around easing tariff tensions between the US and the EU.
- Altcoins led by Ethereum, Solana and Cardano reignite bullish expectations as Bitcoin dominance consolidates at around 64%.
The cryptocurrency sector inches higher on Monday, supported by a 0.3% increase in the total market capitalization to $3.58 trillion over 24 hours. Bitcoin (BTC) reversed the trend upwards, reaching an intraday high of around $110,228 while exchanging hands at approximately $109,654 at the time of writing.
Top altcoins, including Ethereum (BTC), Solana (SOL) and Cardano (ADA), portray bullish outlooks, possibly building upon potential capital rotation as Bitcoin dominance consolidates at 64%.
Market overview: Easing trade tensions buoy crypto prices
Bitcoin rallied to new all-time highs of around $111,980 last week, supported by growing concerns about the sustainability of United States (US) debt. The concerns followed Moody’s downgrade of the US credit rating from Aaa to Aa1 on May 16. Moody's cited over a decade of rising government debt and interest payment ratios significantly higher than those of similarly rated sovereigns.
As market dynamics shifted, resulting in a significant increase in treasury yields, investors expanded their scope, embracing risk assets such as Bitcoin and other digital assets amid the need to diversify investments.
Bitcoin’s stint at the new all-time highs was short-lived when US President Donald Trump threatened to impose a 50% tariff on the European Union (EU), triggering a weekend sell-off to $106,600. Altcoins also trimmed gains alongside BTC. However, recoveries characterized the trading on Monday after President Trump delayed the implementation of the tariff on the EU until July 9.
Bitcoin’s price hovers at $109,654 at the time of writing, up approximately 0.75% on the day. Most digital assets in the top ten, excluding the stablecoins, have sustained gains in the last 24 hours, including leading altcoins like Ethereum, Solana and Cardano.
Data spotlight: Digital asset inflows rise to $3.3 billion
The increase in digital asset inflows to $3.3 billion, according to CoinShares data, implies growing institutional and retail interest in crypto-related products.
Bitcoin led the altcoins, achieving $2.9 billion in inflows, significantly contributing to a record year-to-date (YTD) sum of $10.8 billion. In comparison, the total asset under management (AUM) temporarily peaked at an all-time high of $187.5 billion earlier in the week.
The United States accounted for the lion’s share of the inflows, recording $3.2 billion at the end of the week. At the same time, Germany, Australia, and Hong Kong contributed $41.5 million, $10.9 million and $33.3 million, respectively.
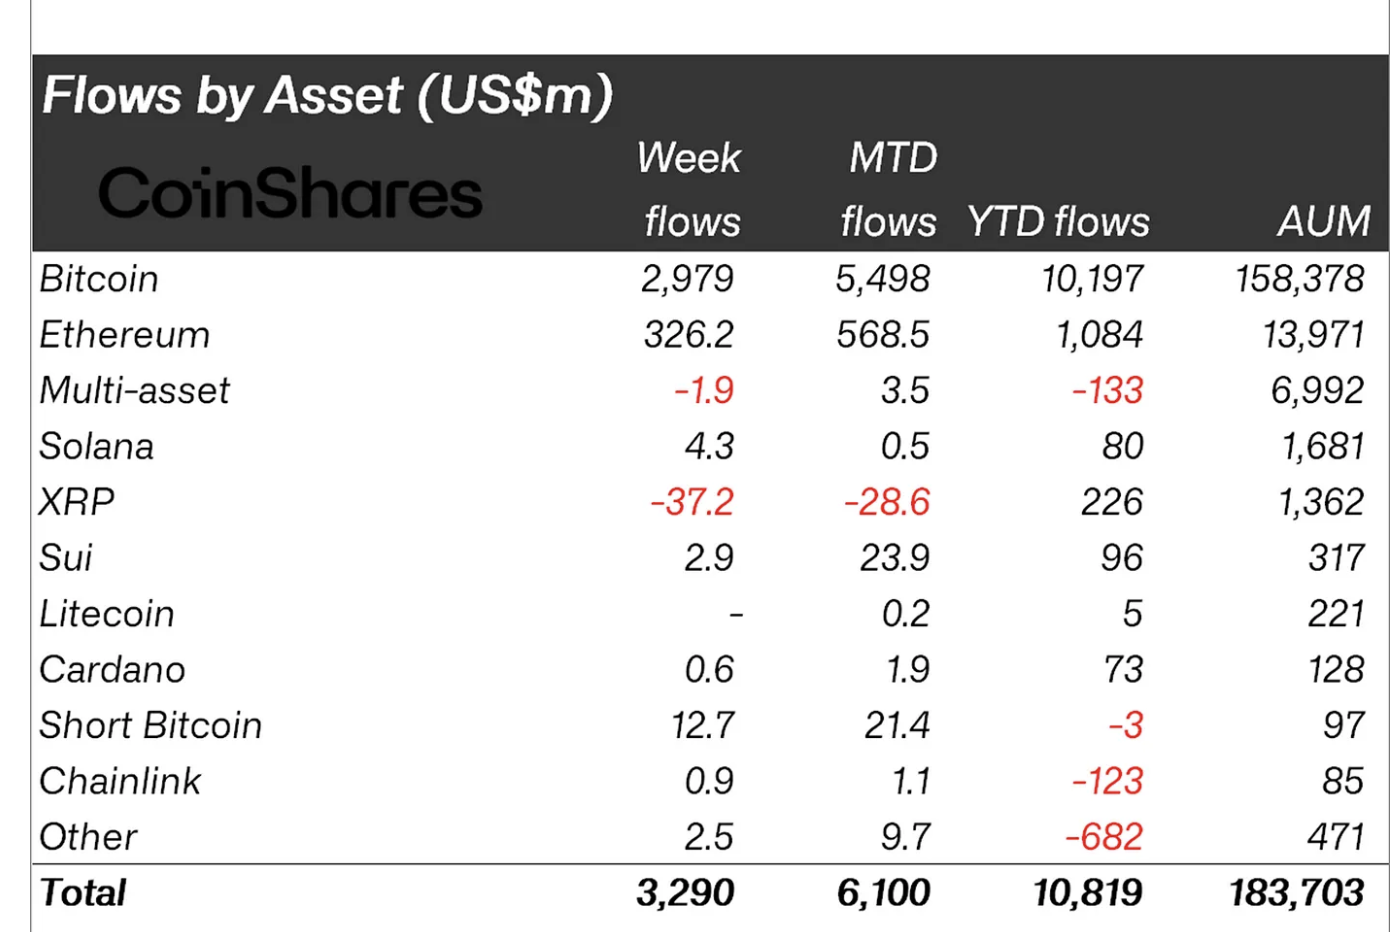
Digital asset inflows | Source: CoinShares
Inflows into Ethereum-related assets totaled $326 million, the highest level in 15 weeks, possibly due to positive sentiment surrounding the recent Pectra upgrade. This was also the fifth week in a row of gains.
The cross-border remittance token Ripple (XRP) suddenly broke its impressive 80-week inflow streak with $37.2 million outflows. This was the largest outflow on record.
“Growing concerns over the US economy, driven by the Moody’s downgrade and the resulting spike in treasury yields, have prompted investors to seek diversification through digital assets,” the CoinShares weekly report states.
Meanwhile, spot Bitcoin Exchange Traded Funds (ETFs) posted a net weekly inflow of $2.75 billion, representing the third-highest weekly inflow since the products started trading in January 2024. Based on SoSoValue data, spot Ethereum ETFs saw a net weekly inflow of $248 million from all nine products.
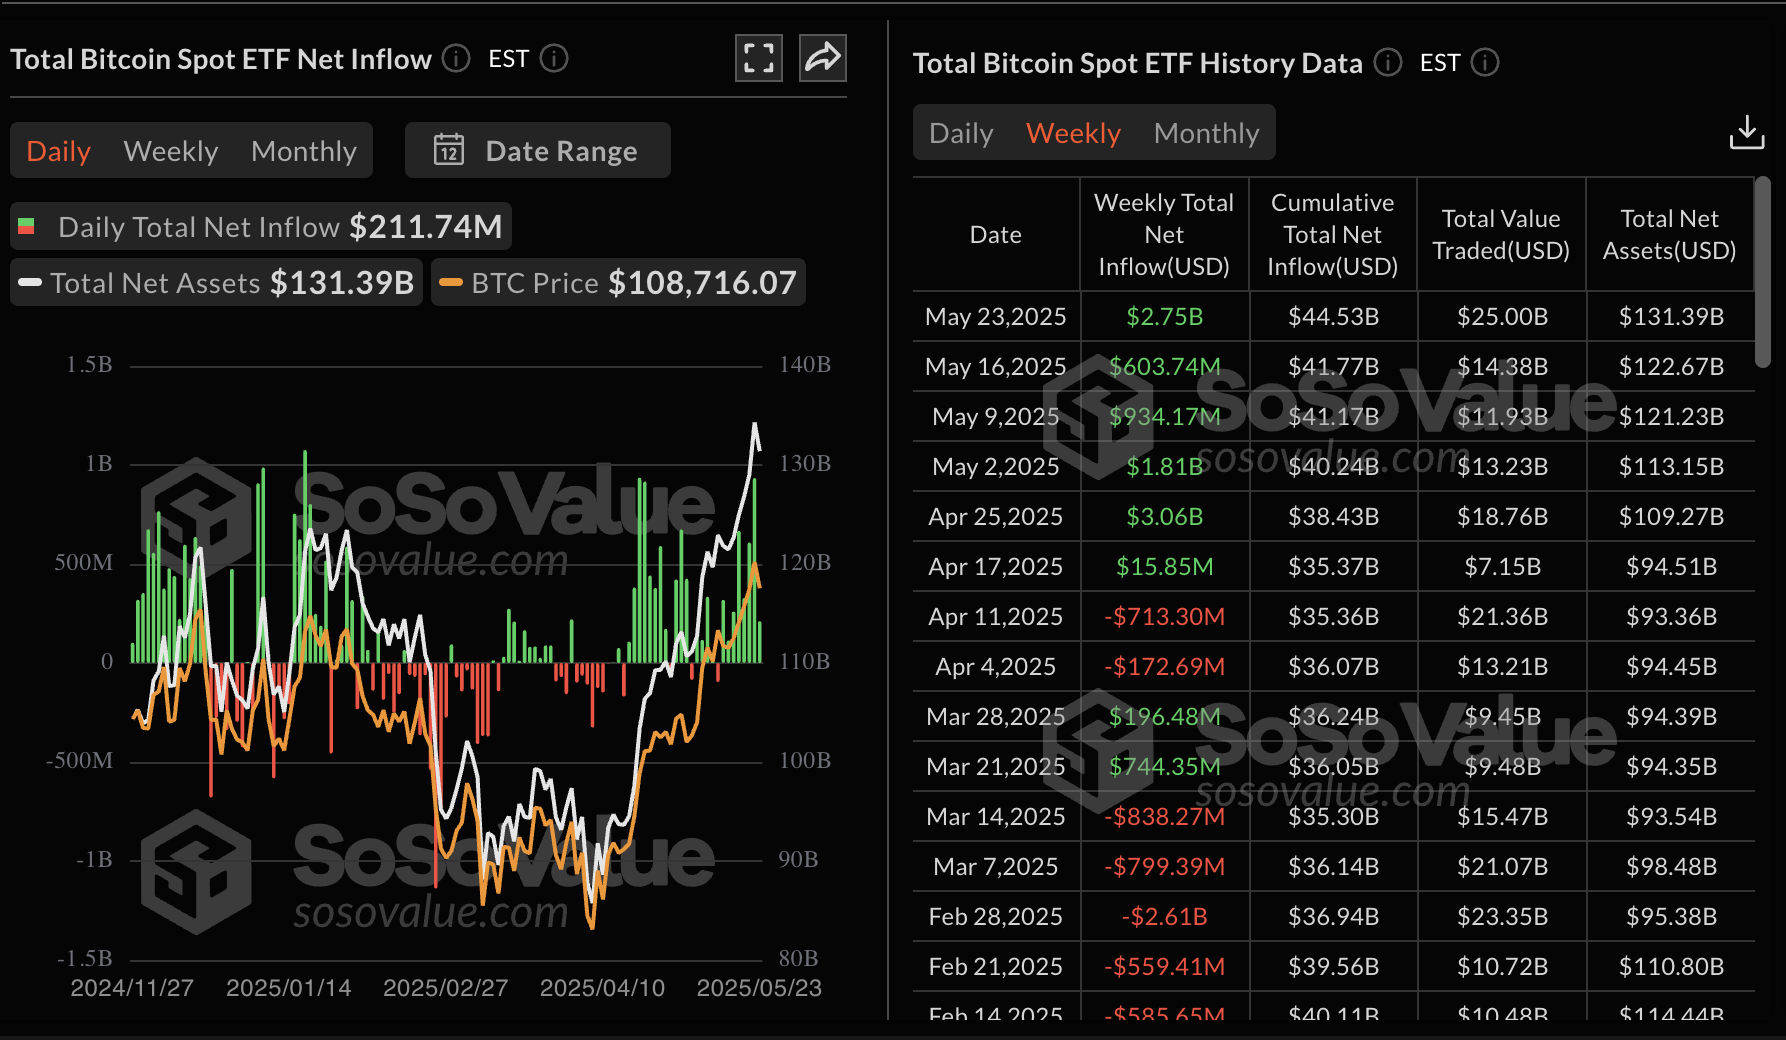
Bitcoin ETFs weekly inflows | Source: SoSoValue
Bitcoin technical outlook: BTC uptrend regains bullish momentum
Bitcoin showcases a bullish outlook, while bulls knock on the immediate resistance at $110,000. Bullish market sentiment could support the uptrend, targeting another breakout past the all-time highs.
The up-trending moving averages like the 50-day Exponential Moving Average (EMA) at $98,669, the 100-day EMA at $94,716 and the 200-day EMA at $89,875 steady the bullish structure.
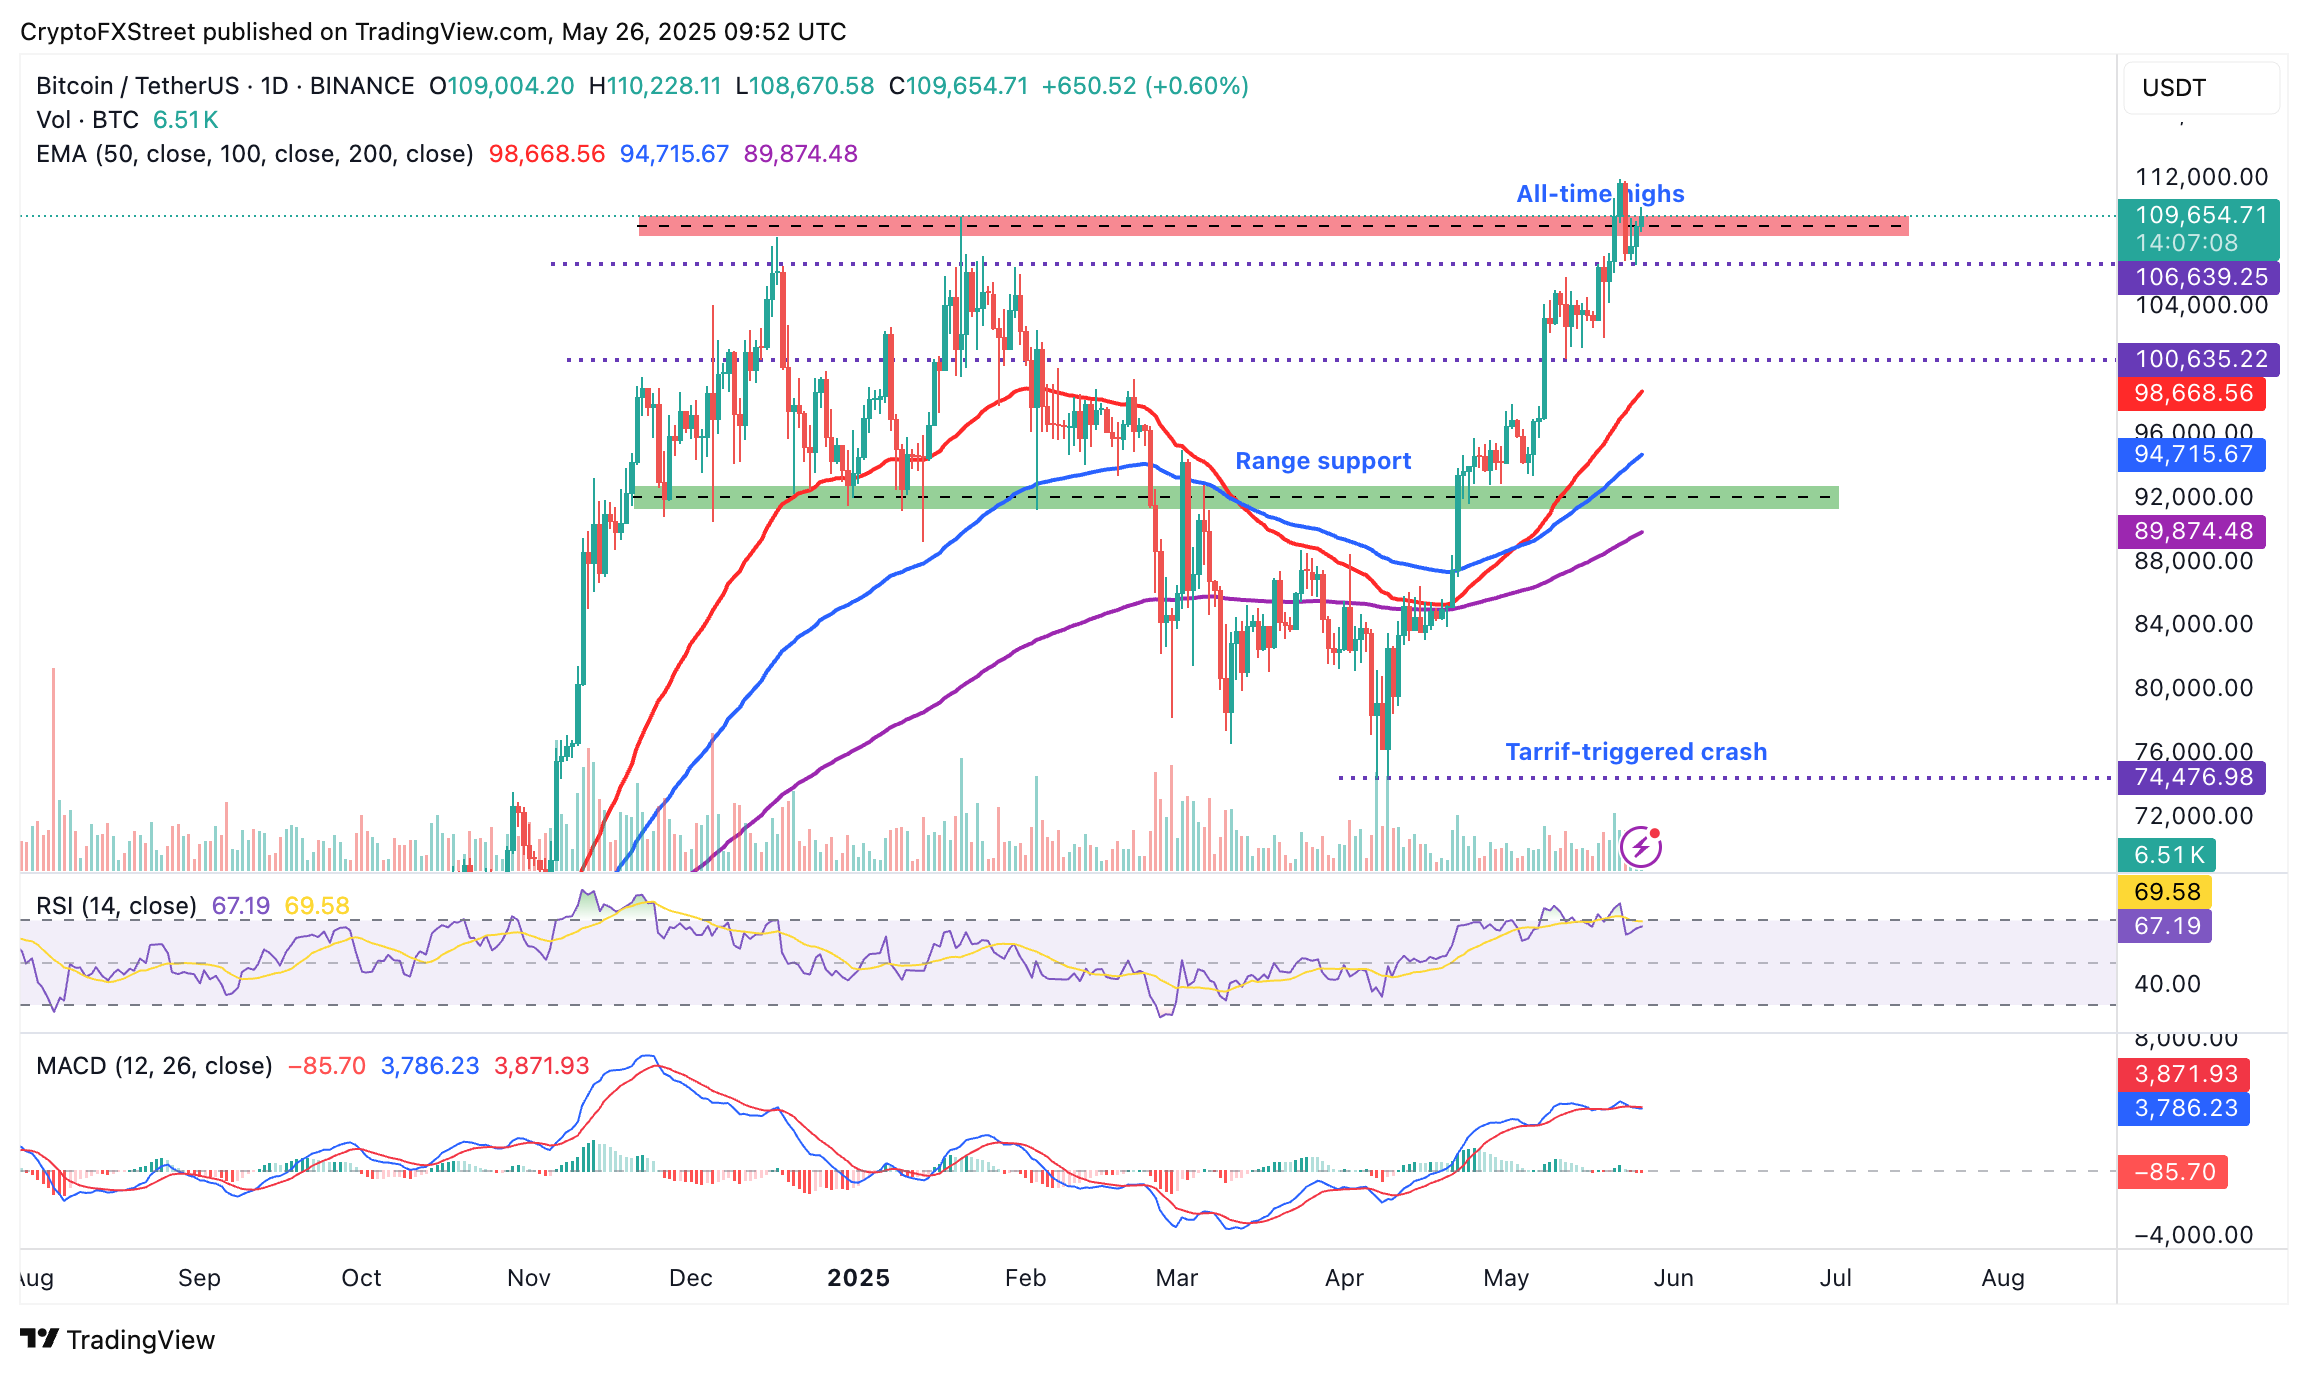
BTC/USDT daily chart
Despite the solid bullish outlook, traders should pay attention to the Moving Average Convergence Divergence (MACD) indicator, which could send a sell signal if the MACD line (blue) crosses below the signal line (red). Key monitoring levels on the downside include $106,639 (weekend support) and the demand area around $100,635, tested last on May 12.
Altcoin performance: Ethereum and Cardano lead recovery
Bitcoin dominance, which shows the percentage of BTC’s market share compared to altcoins, is moving broadly sideways, slightly above 64%, as observed in the chart below.
The consolidation comes after a sharp uptick from the drop to 62% on May 14. Investors could consider capital rotation by selling BTC at a profit and channeling the proceeds to select altcoins like Ethereum and Cardano.
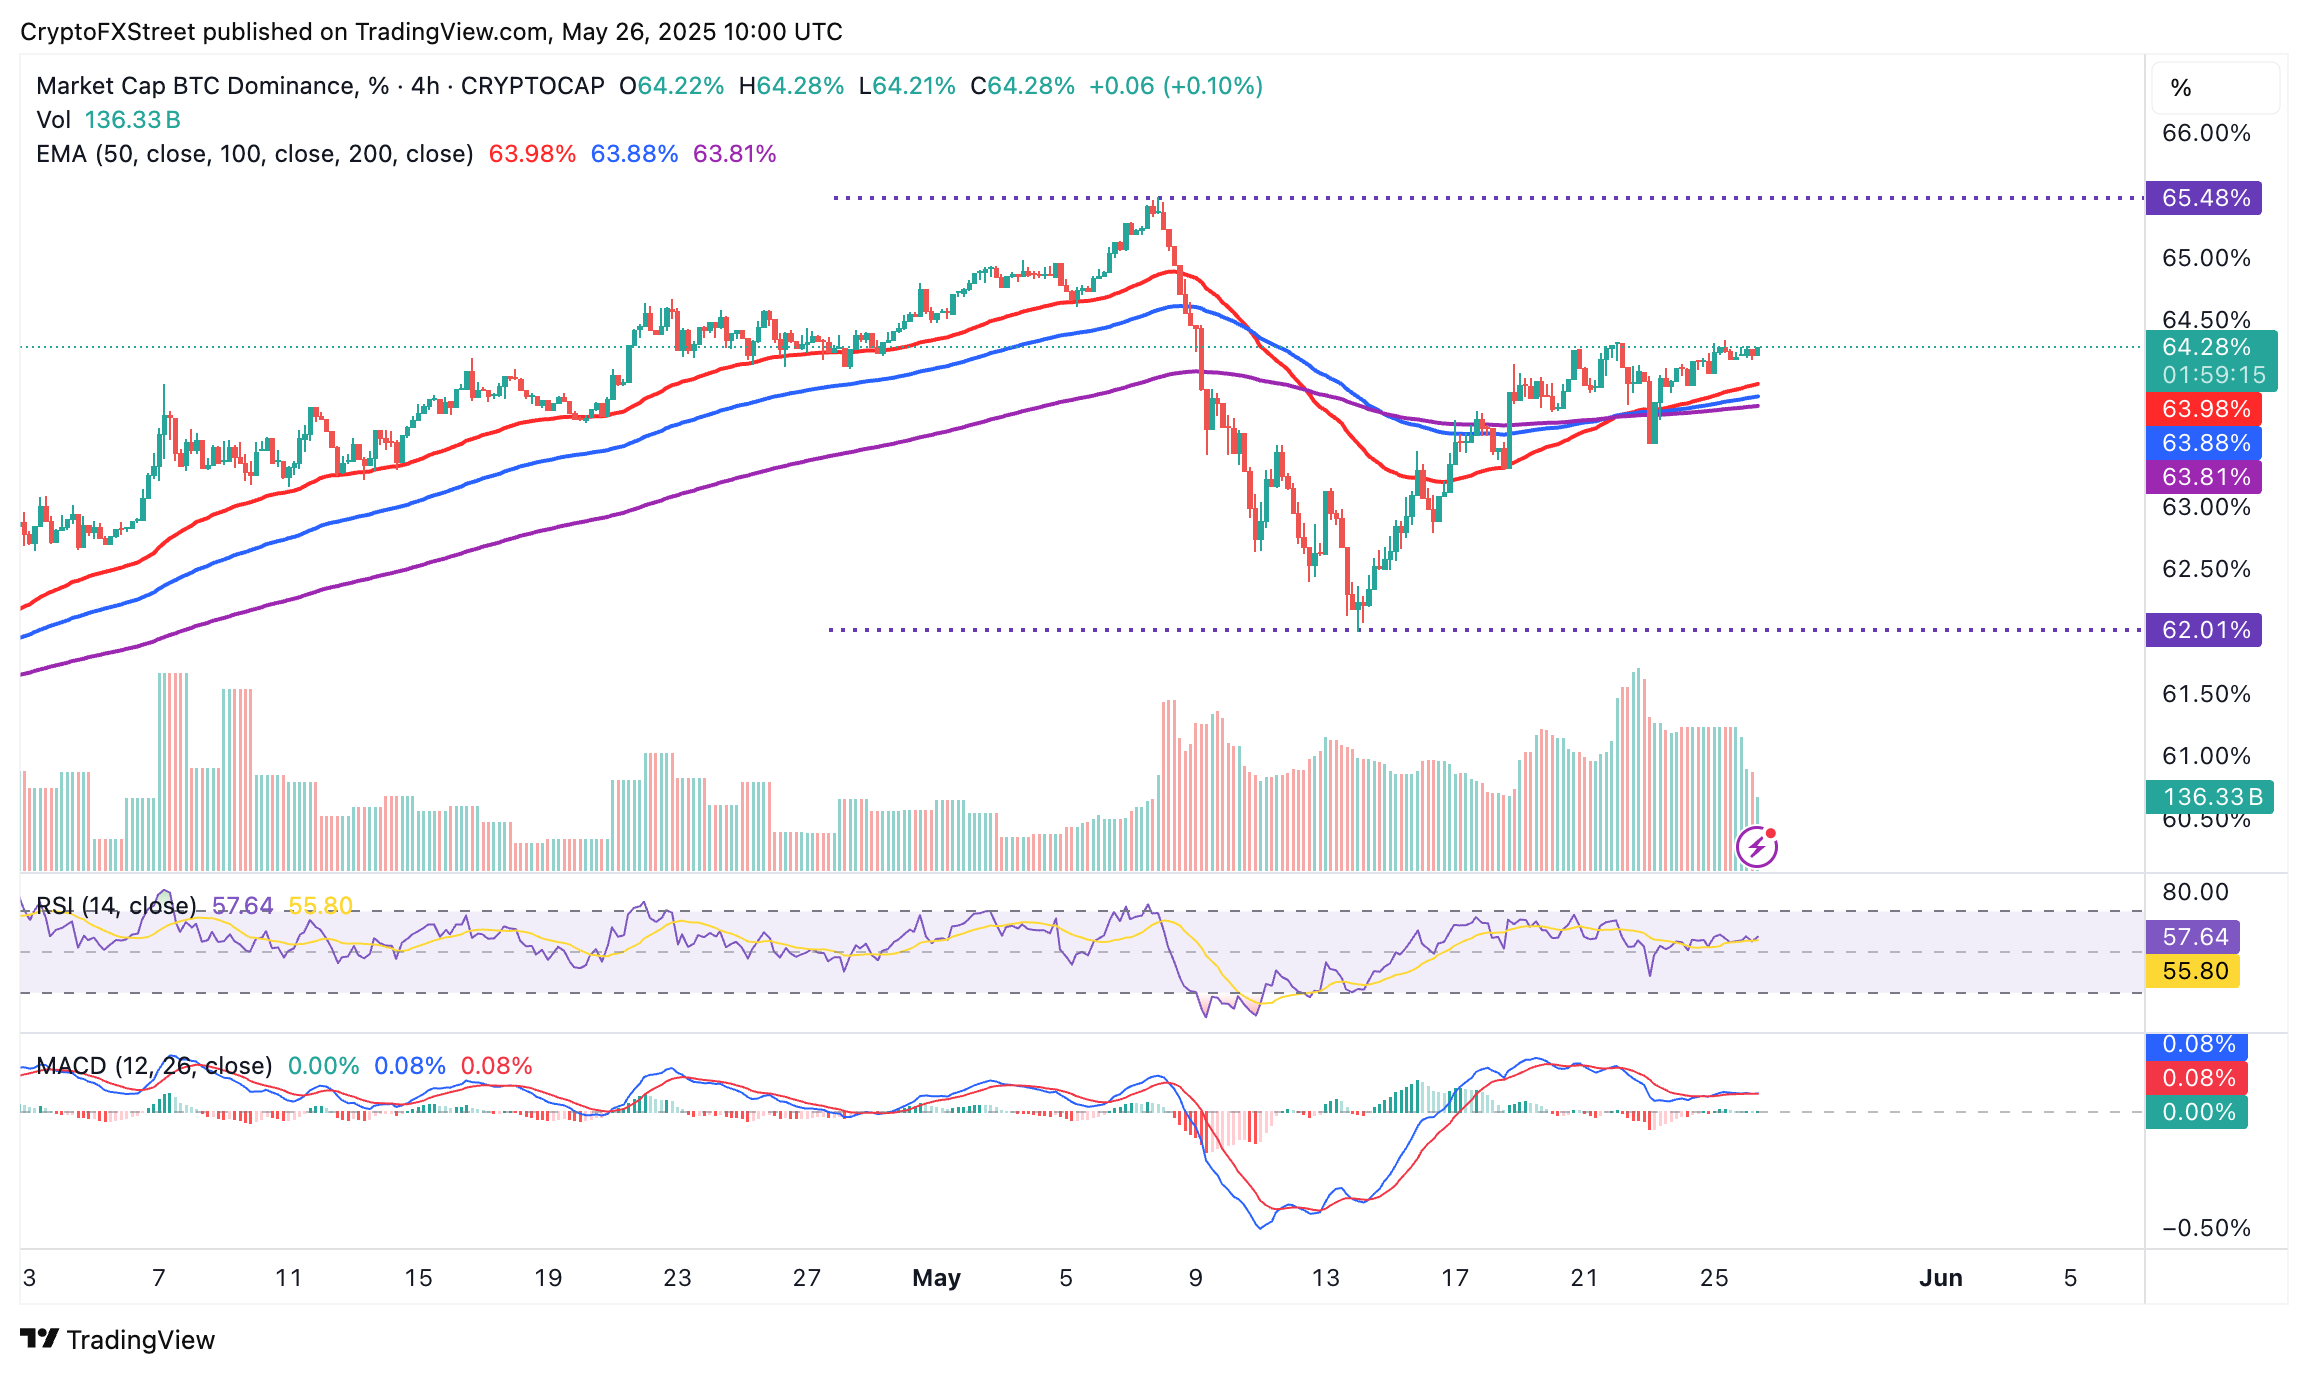
BTC.D 4-hour chart
The direction Bitcoin dominance will take in the coming days will provide more information on whether altcoins will sustain the gains or pull back from current and recent highs.
In the meantime, the 4-hour charts below highlight a minor bullish bias in the Ethereum and Cardano price performance. Both assets sit above key moving averages, including the 50-, 100-, and 200 EMAs.
The MACD on the ETH/USDT chart confirmed a buy signal, suggesting that increasing demand could drive ETH’s price above the $2,600 hurdle if traders seek exposure.
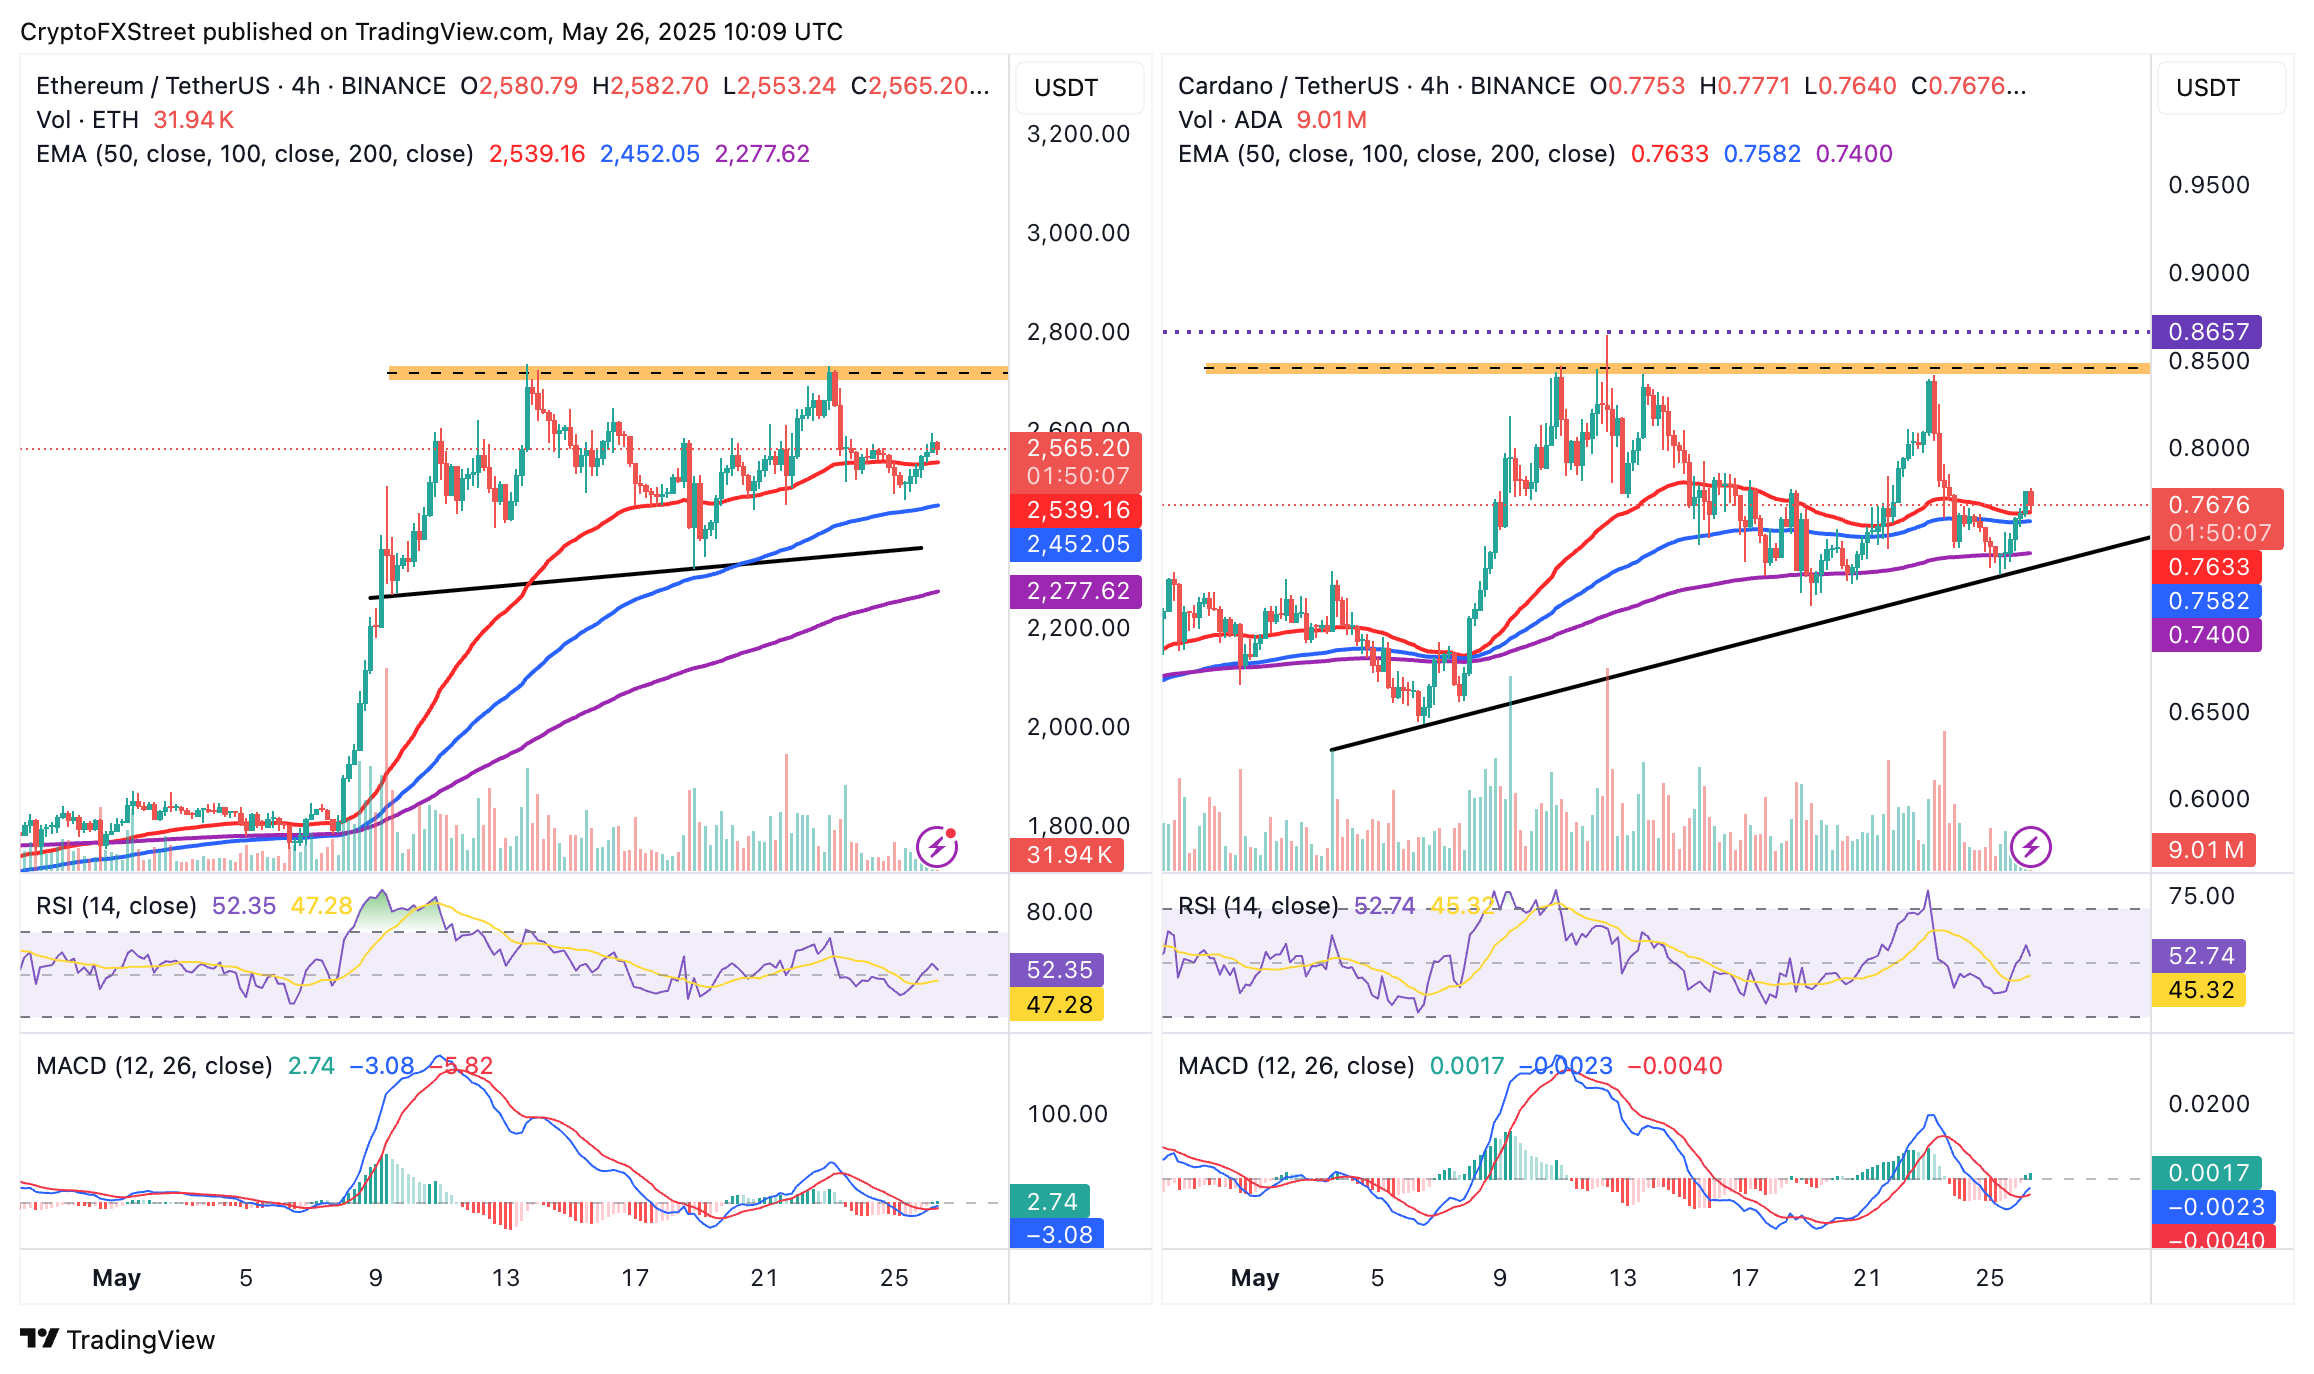
ETH/USDT and ADA/USDT 4-hour charts
Cardano also flaunts a buy signal from the MACD indicator, confirmed when the MACD line (blue) crossed above the signal line (red). Support is anticipated above the 50-period EMA at $0.76. Still, the 100 EMA at $.75 and the 200 EMA at $0.74 are in line to absorb the potential selling pressure, especially if gains toward $0.80 falter in upcoming sessions.
Cryptocurrency prices FAQs
Token launches influence demand and adoption among market participants. Listings on crypto exchanges deepen the liquidity for an asset and add new participants to an asset’s network. This is typically bullish for a digital asset.
A hack is an event in which an attacker captures a large volume of the asset from a DeFi bridge or hot wallet of an exchange or any other crypto platform via exploits, bugs or other methods. The exploiter then transfers these tokens out of the exchange platforms to ultimately sell or swap the assets for other cryptocurrencies or stablecoins. Such events often involve an en masse panic triggering a sell-off in the affected assets.
Macroeconomic events like the US Federal Reserve’s decision on interest rates influence crypto assets mainly through the direct impact they have on the US Dollar. An increase in interest rate typically negatively influences Bitcoin and altcoin prices, and vice versa. If the US Dollar index declines, risk assets and associated leverage for trading gets cheaper, in turn driving crypto prices higher.
Halvings are typically considered bullish events as they slash the block reward in half for miners, constricting the supply of the asset. At consistent demand if the supply reduces, the asset’s price climbs.
Artigos Recomendados


