
Top Gainers WLD HYPE ZEC: Privacy coins lead the altcoins rally
- Worldcoin takes a 28% leap with $135 million funding and World network expansion.
- Hyperliquid jumps 18% as the perpetual DEX open interest hits $8.9 billion, a new record high.
- Zcash hit $50 with a 16% hike as the demand for privacy coins surges in the market.
The wider crypto market witnesses the altcoins rally gaining traction with the total crypto market cap, excluding Bitcoin (BTC) and Ethereum (ETH) crossing $935 billion. Privacy coins such as Worldcoin (WLD) and Zcash (ZEC) lead the rally as investor demand grows to bypass government scrutiny alongside hackers returning to the bull market. World Foundation secured $135 million in funding from a16z and Bain Capital Crypto on May 21 in a direct purchase of WLD tokens alongside the network expansion, crossing the 26 million World App users mark and 12.5 million unique users.
With altcoins leading up to double-digit gains, Hyperliquid (HYPE), a decentralized exchange (DEX) for perpetual futures trading, reaches a new all-time high as the platform’s open interest hits $8.9 billion.
Worldcoin shoots above $1.50
Worldcoin trades at $1.55 with a mild gain of 2.84% on Friday, at press time, following the 26.91% leap on Thursday. The ongoing recovery in WLD crosses above the 200-day Exponential Moving Average (EMA) at $1.48 to challenge the $1.61 level, a key support turned resistance in late January.
The Relative Strength Index (RSI) at 72 re-enters the overbought zone and points higher, reflecting a significant rise in the token’s price momentum. However, investors must remain cautious, as the overbought zone signals reversal risk as the altcoin nears key resistance.
As per the Fibonacci retracement from $3.91 to $0.61 between December 7 and April 8, a potential $1.61 breakout could test $2.26, the 50% level of the correction phase. This suggests an upside potential of 38% if WLD exceeds the key resistance.
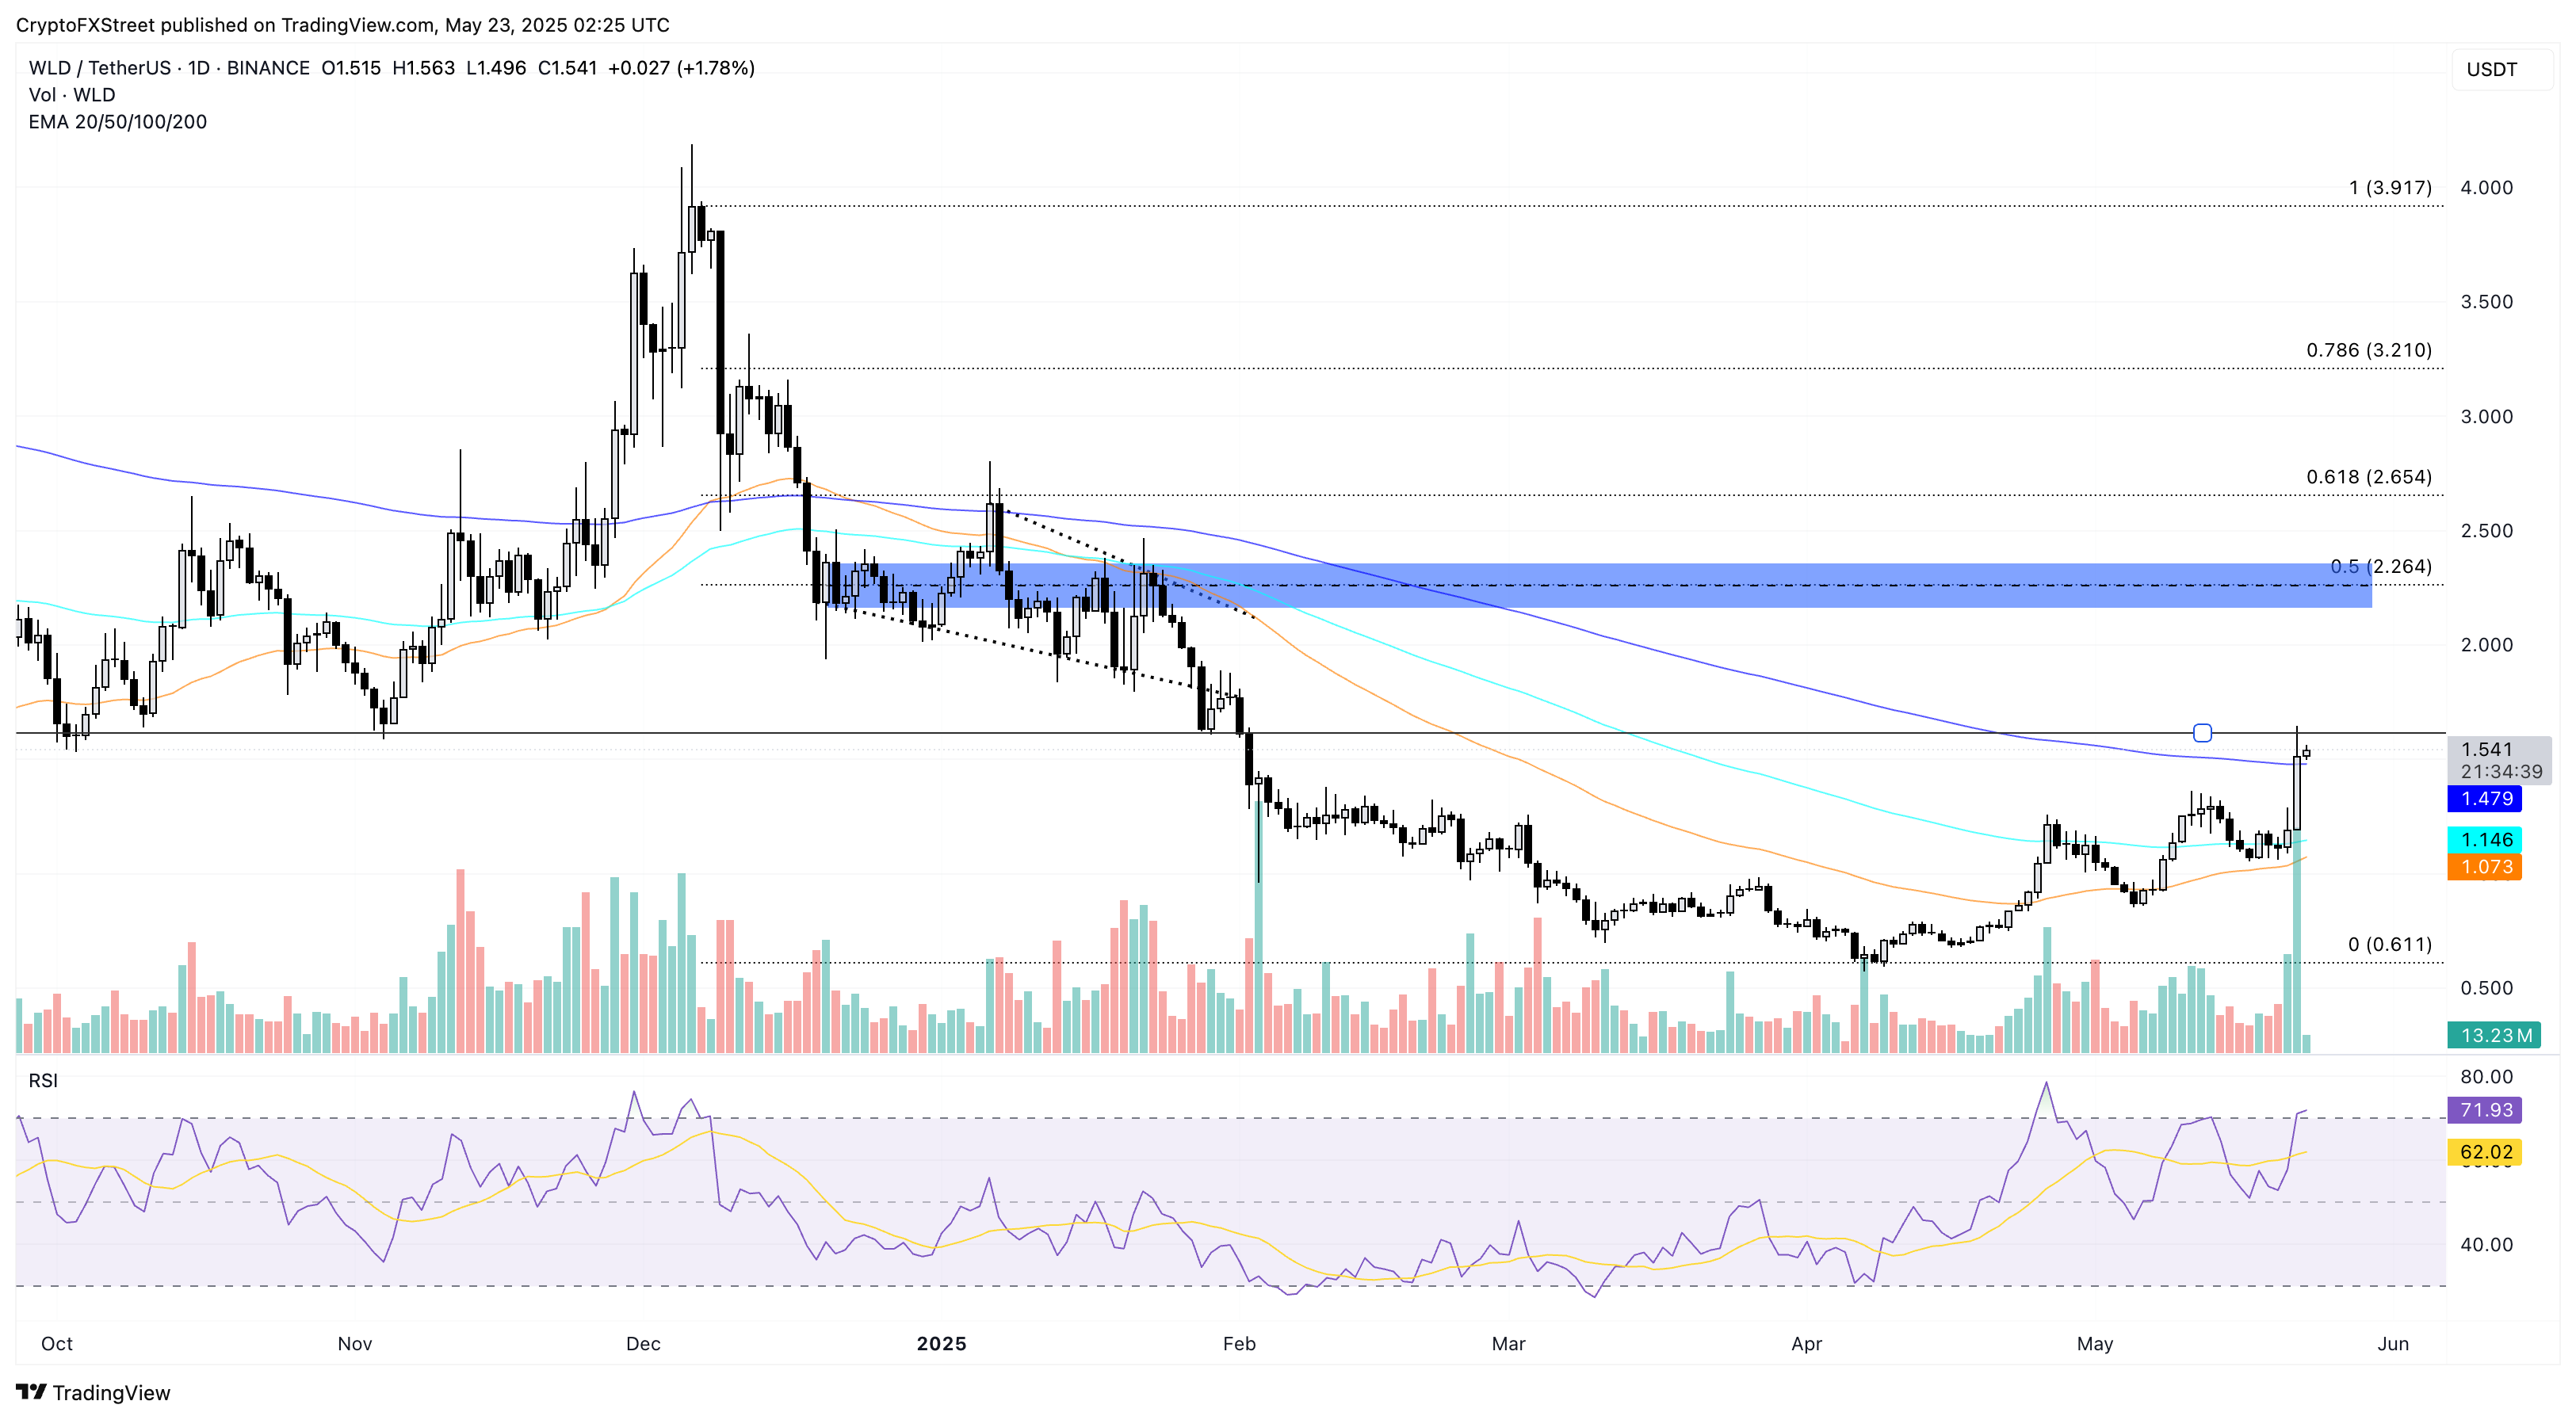
WLD/USDT daily price chart. Source: Tradingview
On the flip side, a failure to uphold trend momentum above $1.61 could result in a retest of the 200-day EMA at $1.48.
HYPE hits record high, targets $38 breakout
Hyperliquid is up 6.29% on Friday as it trades at $35.37, at press time, after reaching a record high at $35.86. The recovery rally in the altcoin forms its third consecutive bullish engulfing candle, driving the weekly gains to 30%.
As HYPE enters the uncharted price levels, the RSI jumps to 83 in the overbought zone, signalling strong upward momentum. However, the indicator also risks overbought conditions leading to short-term pullbacks.
Based on the Fibonacci retracement from $32.12 to $10.02, the bull run in HYPE might face headwinds near $38.13, highlighted by the 1.272 Fibonacci level. The retracement tool suggests an upside potential of 8% if the token sustains momentum.
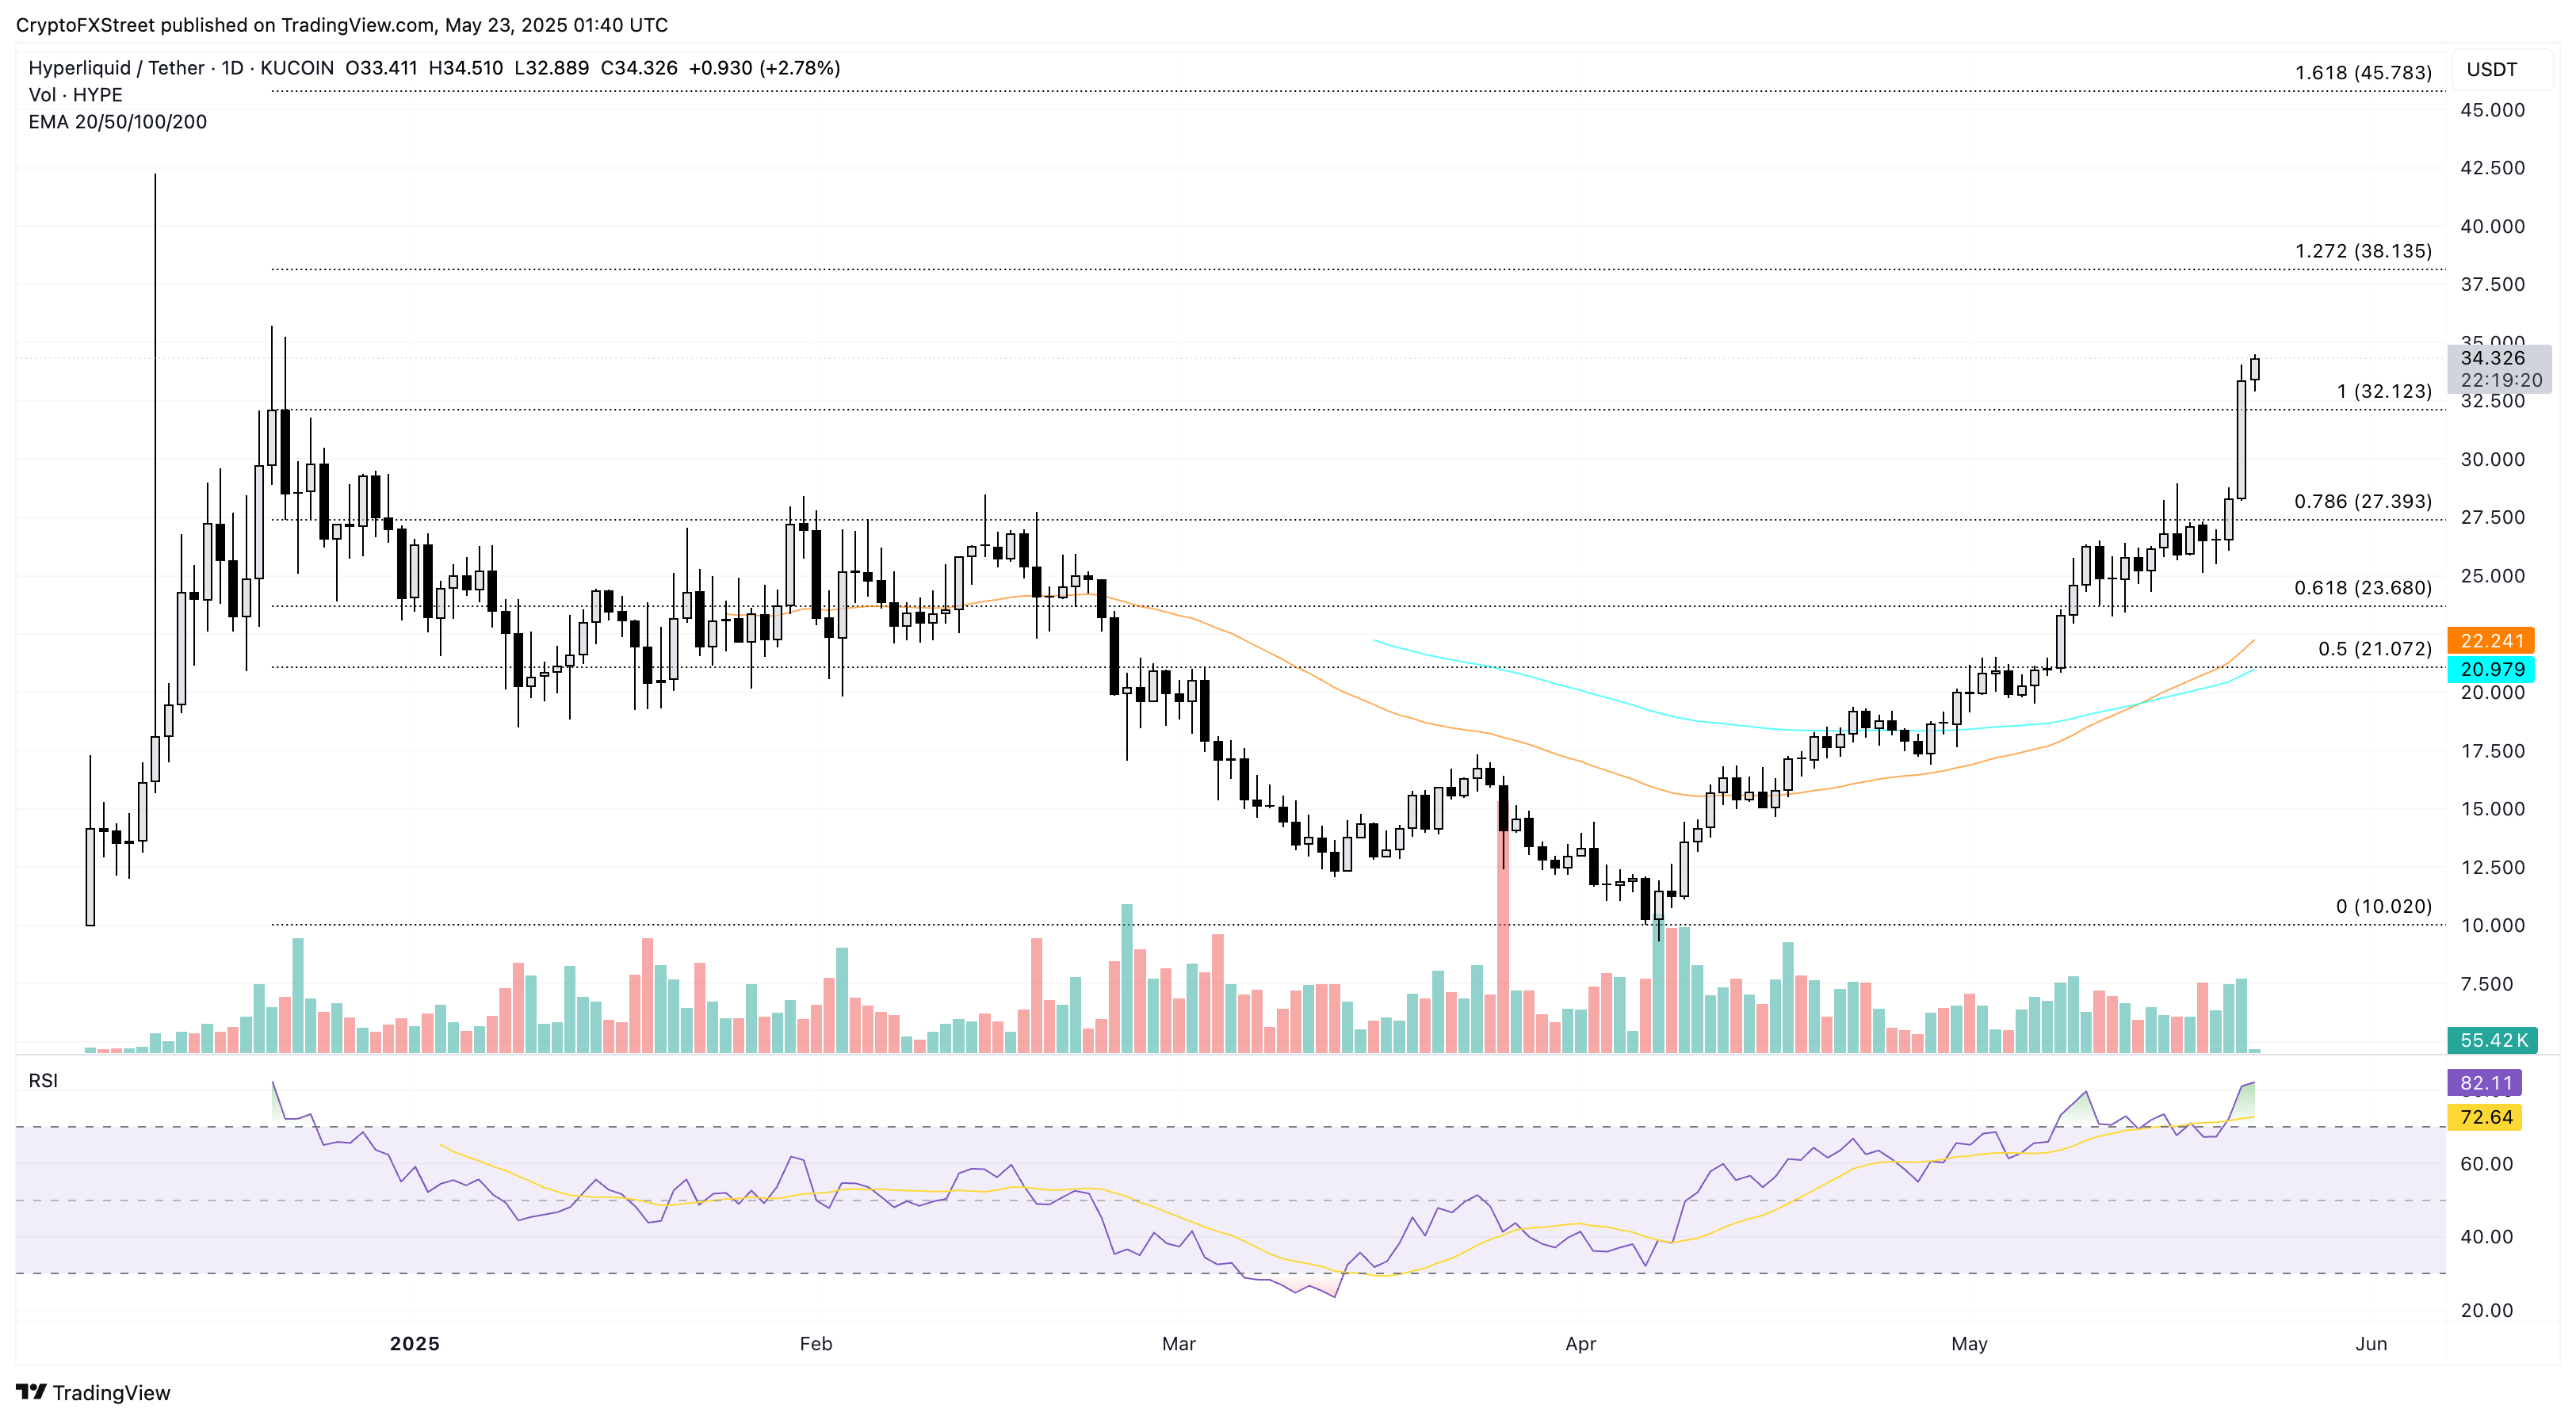
HYPE/USDT daily price chart. Source: Tradingview
On the contrary, if bullish exhaustion kicks in, suggested by overbought RSI, a pullback to retest $32.12 is a possibility.
ZEC breaks rising channel to hit $50
With the rising demand for privacy coins in the market, Zcash is gradually making a bullish comeback. At press time, the ZEC token trades at $49.62, with a 1.33% gain on Friday and a 24-hour high at $50.65.
Zcash shows a bullish breakout of a rising channel pattern on the daily price chart with a 14% jump on Thursday. As ZEC outgrows a bullish pattern, it suggests strong underlying pressure fuelled by market demand.
Supporting the thesis, the 50-day EMA is close to crossing above the 200-day EMA, signalling the short-term trend flipping bullish with a golden crossover. Additionally, the pattern breakout jolts RSI to 75 in the overbought territory, pointing upwards.
The Fibonacci retracement from December 2 to March 7 extends between $74.57 and $29.17, targeting the 50% level at $51.87 as an immediate resistance. If the rising channel breakout rally exceeds the halfway level of the previous correction, $57.23 and $64.85 are key resistance levels noted by 61.8% and 78.6% levels, respectively.
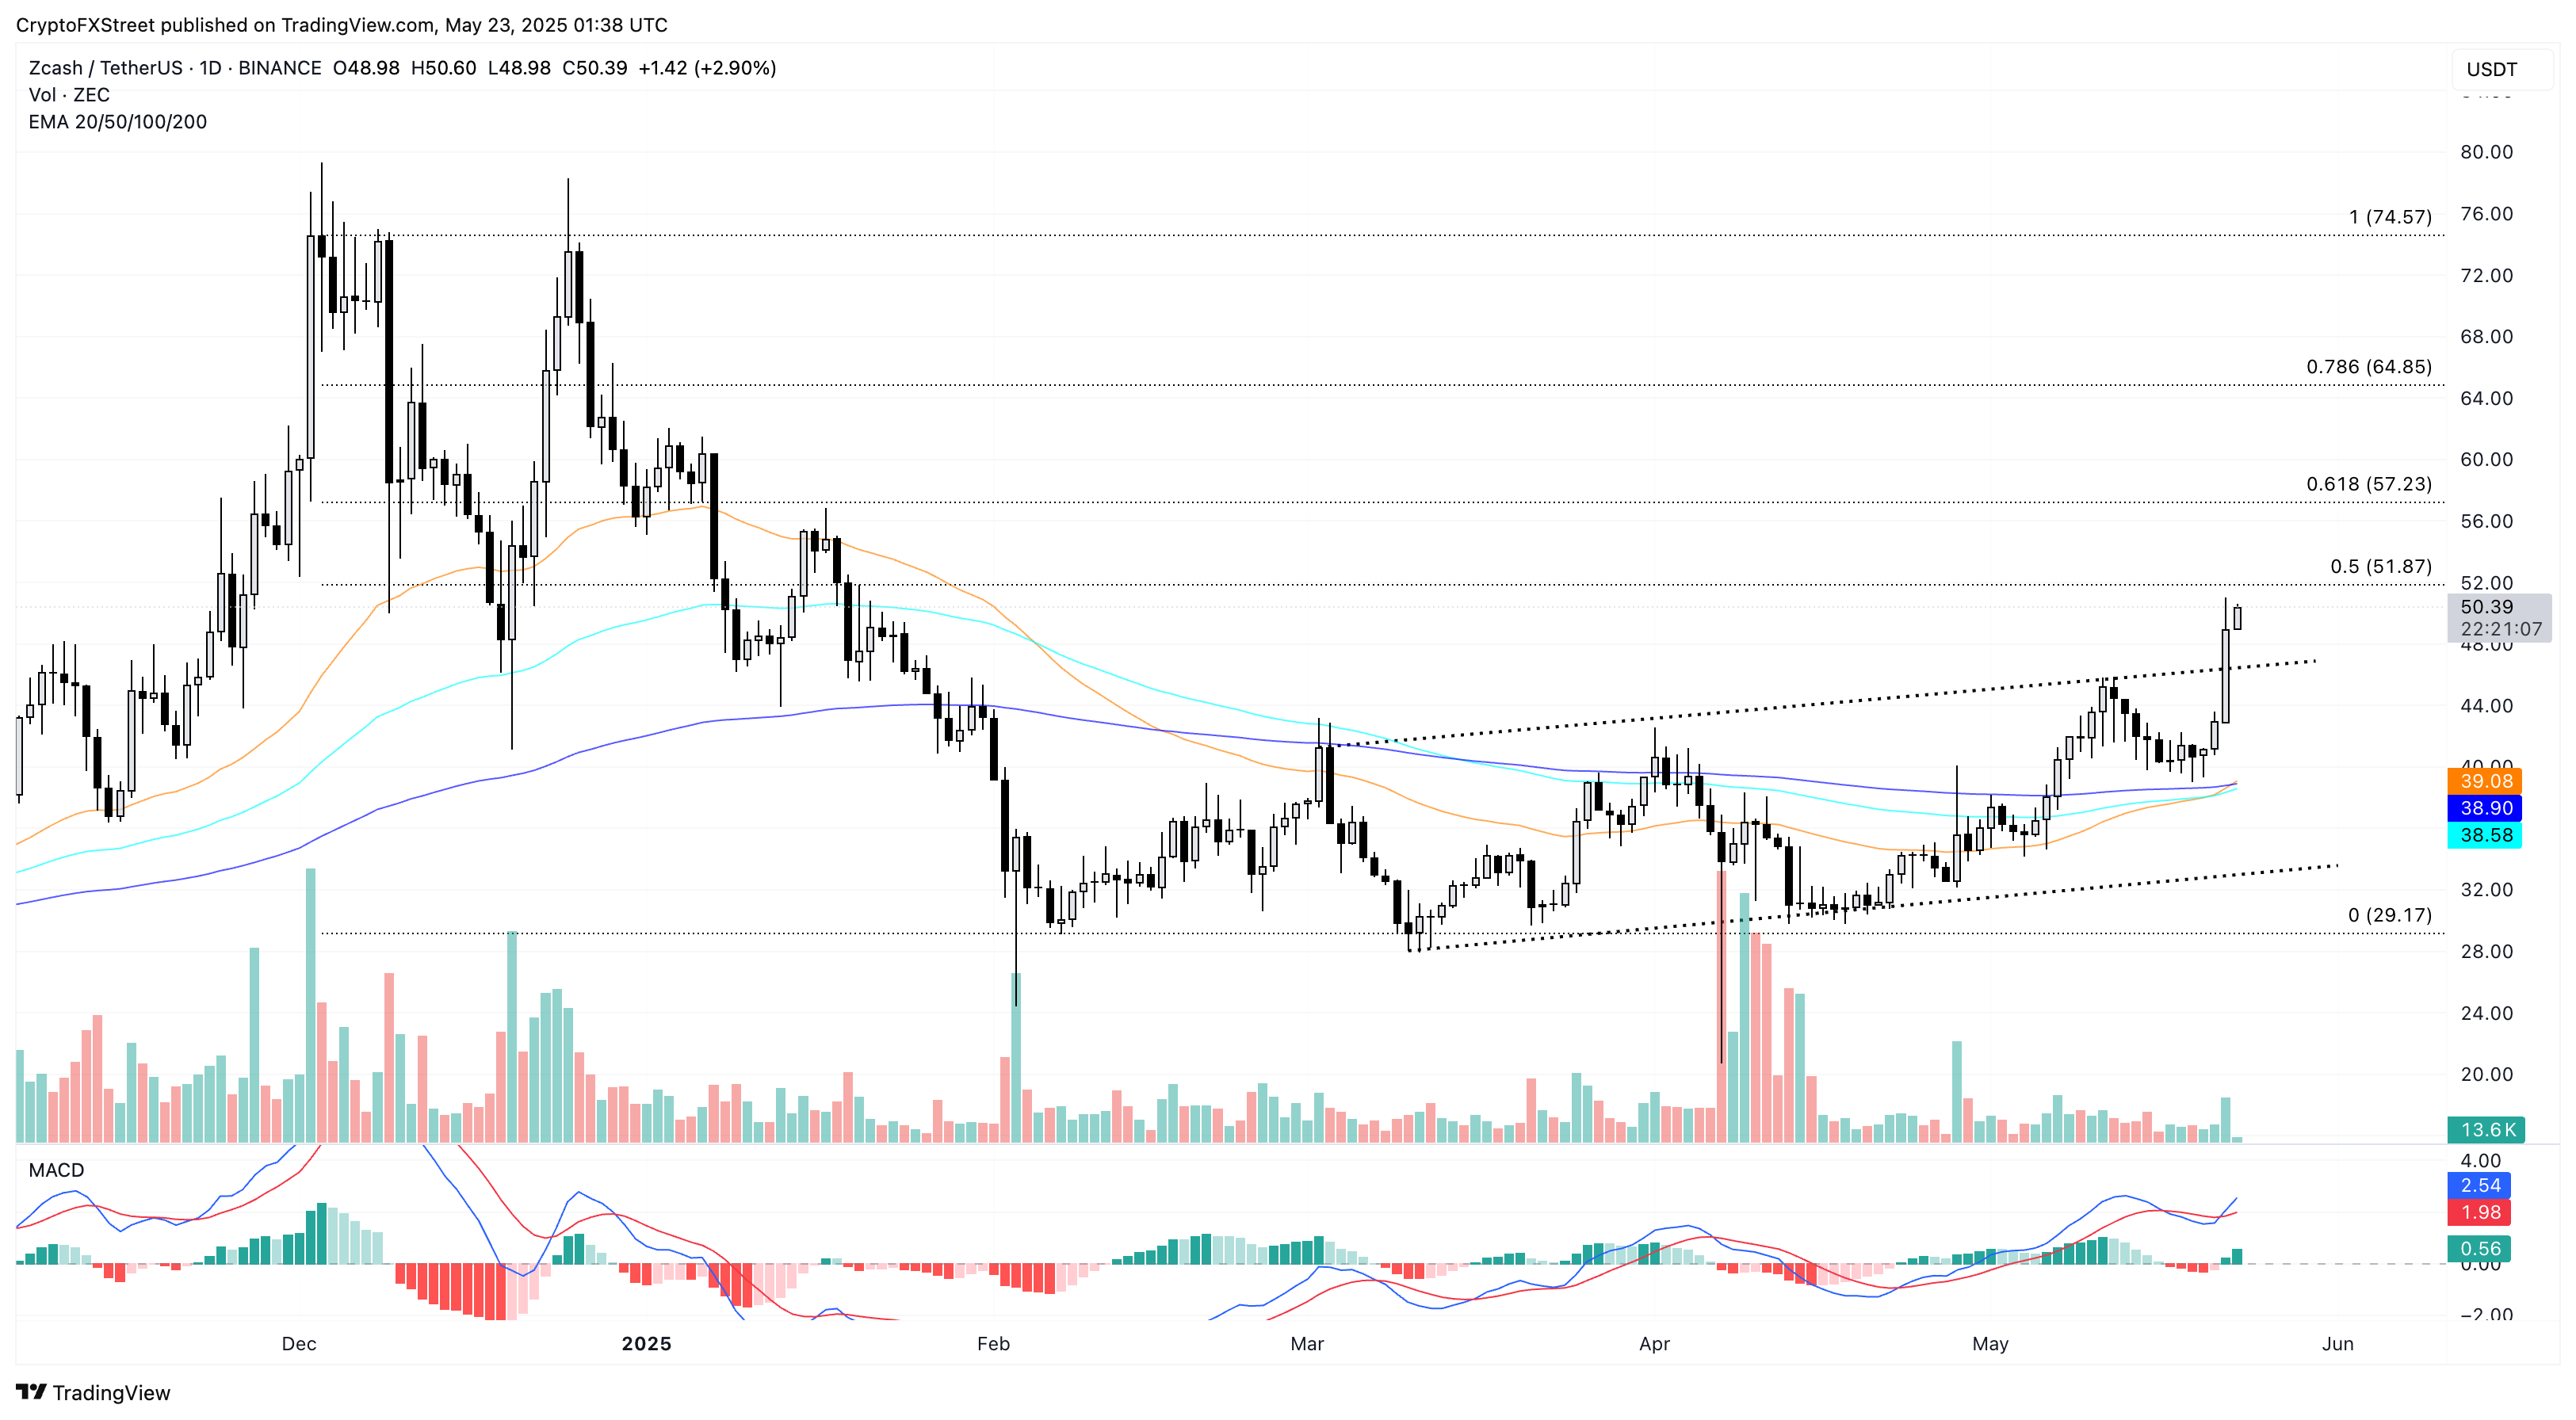
ZEC/USDT daily price chart. Source: Tradingview
On the other hand, if ZEC reverses within the rising channel with a closing below the upward sloping trendline near $46.50, it will invalidate the breakout rally.
Artigos Recomendados


