

Does the AI Boom Resemble the Dot-Com Meltdown? Here's What the Data Shows.
Key Points
The stock market trades at a high multiple.
Investors have been buying artificial intelligence stocks hand over fist.
Arguments can be made for and against the market being in an AI bubble.
- 10 stocks we like better than S&P 500 Index ›
If you've been following the stock market over the past few years, then you've likely heard several concerned market strategists compare the current artificial intelligence (AI) boom to the dot-com bubble, which inflated in the late 1990s with some historic market returns and popped in 2000, leaving a trail of dead tech and internet companies.
Now, obviously, the internet has become ubiquitous and changed the world, so the dot-com bubble proved to be a speed bump, but nobody wants to be left holding the bag during one of these events, especially if you're investing on a short-term horizon like many institutional investors, which ultimately drive a majority of the movement in the market.
Where to invest $1,000 right now? Our analyst team just revealed what they believe are the 10 best stocks to buy right now, when you join Stock Advisor. See the stocks »
Does the AI boom resemble the dot-com meltdown? Here's what the data shows.

Image source: Getty Images.
Market valuation and capex spending
Several data points suggest that the AI boom resembles the dot-com bubble. A notable, albeit broad, data point is the S&P 500 (^GSPC) Shiller CAPE Ratio. The Shiller CAPE Ratio divides the price of the broader S&P 500 benchmark index by the index's collective 10-year inflation-adjusted earnings to smooth out irregularities typically seen over the course of the business cycle. While perhaps not as high as it was back in 2000, it's certainly close enough for investors to be concerned about a bubble.
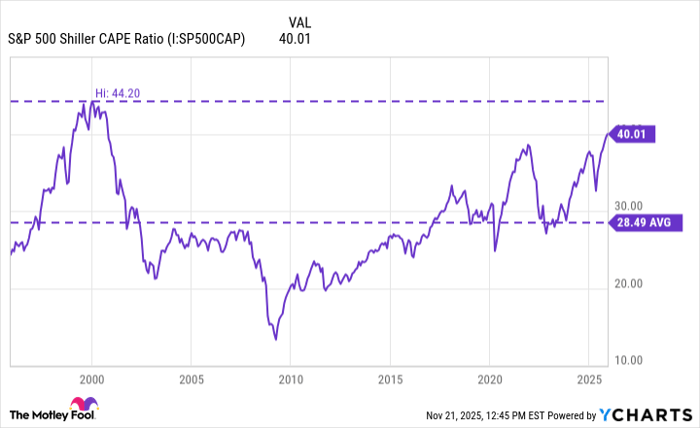
S&P 500 Shiller CAPE Ratio data by YCharts
Another interesting chart, created by Michael Burry, of "The Big Short" fame, examines the spending by S&P 500 companies and companies in the Nasdaq-100 on capital expenditures (capex), minus depreciation, as a percentage of nominal gross domestic product. Burry noted that he expects this ratio for the Nasdaq-100 to hit all-time highs in the fourth quarter of 2025 and rival levels seen in the dot-com bubble.
Capex and depreciation have become quite controversial. Investors have cheered hundreds of billions of capex spending by the "Magnificent Seven" on AI infrastructure, showing that they support higher and higher AI demand. However, bears like Burry have questioned the depreciation accounting of these companies, which could be artificially inflating earnings.
Highly profitable juggernauts are driving the AI boom
While there are certainly parallels to the dot-com bubble, other data suggest that the current cycle is more unique. One of the main points you'll hear investors emphasize behind this thesis is that the companies funding this boom are much larger and more profitable than those that funded the dot-com bubble.
According to Bernstein, during the dot-com bubble, a record 36% of tech stocks in 2000 were unprofitable, when considering the number of unprofitable tech stocks in relation to the total number of tech stocks among the 1,500 largest stocks in the U.S. As of Sept. 3, this number was only 19% and has actually come down significantly since 2021.
The other benefit of having huge tech conglomerates like Microsoft and Meta Platforms fund this boom is that they can fund a significant amount of capex and AI business lines with free cash flow. According to UBS, net debt in August only composed 1% of the information technology sector's market cap.
Now, it's possible that the multitrillion-dollar market caps of the tech giants are skewing these numbers. Additionally, companies in the Magnificent Seven have more recently begun to take on more debt to fund some of their AI ambitions, raising red flags among investors. Nevertheless, debt-to-equity ratios at some of the hyperscalers driving the AI boom are not yet concerning, although debt levels are expected to increase over time.
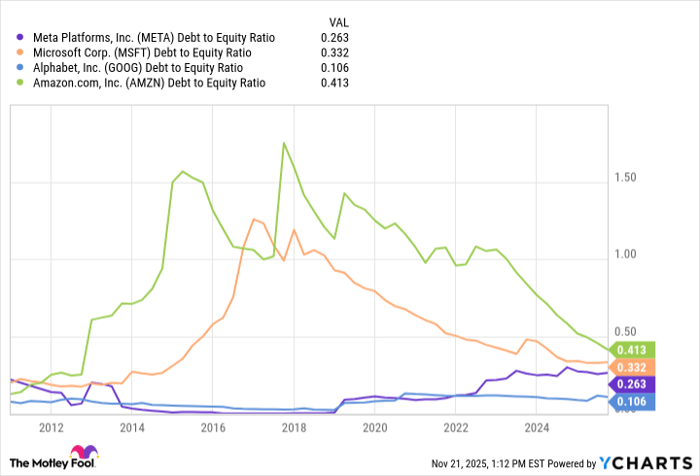
META Debt to Equity Ratio data by YCharts
What's the verdict?
Unfortunately, there are endless data points, many of which are conflicting. This shouldn't come as a surprise, considering history rarely repeats itself but often rhymes. I certainly see parallels between the current AI boom and the former dot-com bubble, and I do have concerns about some of the valuations I'm seeing. The market and the Magnificent Seven have risen quickly, and I certainly think a pullback may be warranted before the next leg higher.
My advice to investors would be to focus on companies that are set to benefit from AI but aren't pure AI plays. In this case, buying the dips on stocks like Microsoft and Alphabet is likely to work out, given all of their other robust businesses, and especially if you have a long-term investing horizon.
Should you invest $1,000 in S&P 500 Index right now?
Before you buy stock in S&P 500 Index, consider this:
The Motley Fool Stock Advisor analyst team just identified what they believe are the 10 best stocks for investors to buy now… and S&P 500 Index wasn’t one of them. The 10 stocks that made the cut could produce monster returns in the coming years.
Consider when Netflix made this list on December 17, 2004... if you invested $1,000 at the time of our recommendation, you’d have $576,882!* Or when Nvidia made this list on April 15, 2005... if you invested $1,000 at the time of our recommendation, you’d have $1,119,006!*
Now, it’s worth noting Stock Advisor’s total average return is 1,002% — a market-crushing outperformance compared to 190% for the S&P 500. Don’t miss out on the latest top 10 list, available when you join Stock Advisor.
See the 10 stocks »
*Stock Advisor returns as of November 24, 2025
Bram Berkowitz has no position in any of the stocks mentioned. The Motley Fool has positions in and recommends Alphabet, Amazon, Meta Platforms, and Microsoft. The Motley Fool recommends the following options: long January 2026 $395 calls on Microsoft and short January 2026 $405 calls on Microsoft. The Motley Fool has a disclosure policy.
Recommended Articles


