

Gold ETFs: SPDR Gold Shares Offers Scale While AAAU Is More Affordable
Both the Goldman Sachs Physical Gold ETF (NYSEMKT:AAAU) and the SPDR Gold Shares (NYSEMKT:GLD) are designed to track the price of physical gold, providing a straightforward way for investors to access gold’s performance without needing to buy or store bullion. The two ETFs, however, differ in size and cost.
Here’s how these two popular funds compare for cost, performance, and structure.
Snapshot (cost & size)
| Metric | AAAU | GLD |
|---|---|---|
| Issuer | Goldman | SPDR |
| Expense ratio | 0.18% | 0.40% |
| 1-yr return (as of Oct. 31, 2025) | 45.4% | 45.2% |
| Beta | 0.46 | 0.46 |
| AUM | $2.2 billion | $134.0 billion |
Beta measures price volatility relative to the S&P 500.
AAAU looks more affordable with an expense ratio of 0.18%, less than half of GLD’s 0.40%. Both funds have no dividend or yield, so cost is the main differentiator here.
Performance & risk comparison
| Metric | AAAU | GLD |
|---|---|---|
| Max drawdown (5 y) | -20.94% | -21.03% |
| Growth of $1,000 over 5 years | $2,092 | $2,069 |
What's inside
SPDR Gold Shares is the first U.S.-listed ETF backed by physical gold, assets under management of $134.0 billion as of Nov. 3, 2025. It invests solely in physical gold bullion, aiming to reflect gold’s spot price minus expenses. The fund is categorized as 100% Basic Materials, and does not disclose individual holdings, as it holds only gold bars. There are no quirks or leverage features to watch for, and the fund’s size supports deep liquidity.
Goldman Sachs Physical Gold ETF is similarly structured, holding physical gold bars (including London Bars and other specified gold) and tracking gold’s price. It is classified as Real Estate 100%, which is simply a quirk of sector labeling rather than actual real estate exposure. Like GLD, AAAU does not reveal individual holdings since it only holds gold. Both funds offer straightforward gold exposure.
For more guidance on ETF investing, check out the full guide at this link.
Foolish take
Gold price has soared more than 50% in 2025, driven by geopolitical tensions, ongoing conflicts, and interest rate cuts in the U.S. Since gold is widely used as a hedge against inflation and economic uncertainty, global events in recent months have given central banks worldwide enough reasons to boost their gold reserves as they diversify away from riskier and volatile assets.
Individual investors can buy physical gold, gold stocks, or gold ETFs to gain exposure to the yellow metal. Within ETFs, while some directly hold physical gold, other own a bunch of gold stocks.
The SPDR Gold Shares and Goldman Sachs Physical Gold ETF are both physical gold ETFs, holding gold bullion in secure vaults. The performance of both the ETFs, therefore, closely mirror the performance of spot gold price. The big differentiators are size and cost.
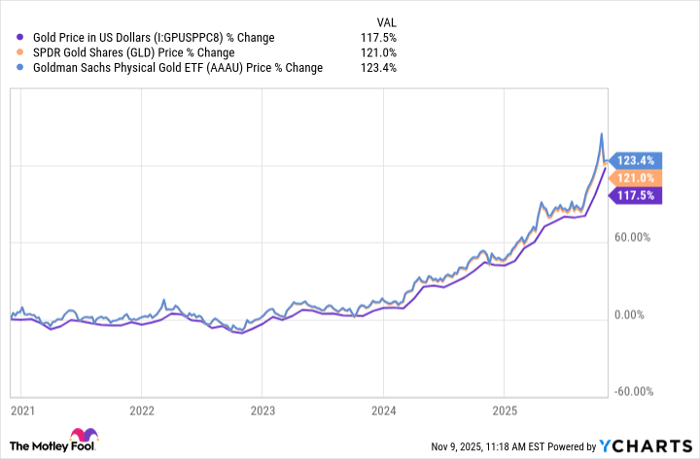
Gold Price in US Dollars data by YCharts
The SPDR Gold Shares was launched in 2004 and is the largest and the most liquid gold ETF in the U.S. The Goldman Sachs Physical Gold ETF was launched in 2018 and is much smaller in size in terms of AUM. That size difference, however, doesn’t really make a difference to returns. What makes a difference though, is costs. The Goldman Sachs Physical Gold ETF has a significantly lower expense ratio of 0.18% versus 0.40% of SPDR Gold Shares. That can make a substantial difference to your total returns in the long term. That’s because for every $1,000 invested in the two ETFs, you pay only $1.80 annually in fees for AAAU versus $4 per year for GLD.
Glossary
ETF: Exchange-traded fund, a security that tracks an index, commodity, or asset and trades like a stock.
Expense ratio: The annual fee, as a percentage of assets, that a fund charges to cover operating costs.
Assets under management (AUM): The total market value of assets a fund manages on behalf of investors.
Beta: A measure of an investment's volatility compared to the overall market, often the S&P 500.
Max drawdown: The largest percentage drop from a fund’s peak value to its lowest point over a specific period.
Physical gold bullion: Actual gold bars or coins held by a fund to back its shares, not derivatives or futures.
Spot price: The current market price at which an asset, like gold, can be bought or sold for immediate delivery.
Liquidity: How easily an asset or fund can be bought or sold in the market without affecting its price.
Dividend or yield: Regular income paid to investors from a fund, typically from interest or dividends; not all funds provide this.
Sector labeling: The classification of a fund’s holdings into industry sectors, which may not always reflect actual exposure.
Where to invest $1,000 right now
When our analyst team has a stock tip, it can pay to listen. After all, Stock Advisor’s total average return is 1,036%* — a market-crushing outperformance compared to 191% for the S&P 500.
They just revealed what they believe are the 10 best stocks for investors to buy right now, available when you join Stock Advisor.
See the stocks »
*Stock Advisor returns as of November 3, 2025
Neha Chamaria has no position in any of the stocks mentioned. The Motley Fool has no position in any of the stocks mentioned. The Motley Fool has a disclosure policy.
Recommended Articles


