

Fed FOMC Meeting Preview: Holding Steady Is the Consensus, What Do Investors Need to Watch?
TradingKey - The Federal Reserve will announce its latest interest rate decision at 2:00 PM ET on March 18.
It has become a foregone conclusion that the Fed will maintain the current benchmark interest rate. No adjustment will be made to the current policy rate range of 3.50%–3.75% at this meeting, yet it remains a bellwether for global markets.
Against a backdrop of slowing growth and oil price shocks, how the Fed redefines its policy path is the key variable determining market direction.
Risk assets have remained under pressure recently, with both the S&P 500 and the Nasdaq Composite retreating to year-to-date lows. Tensions in the Middle East have driven oil prices back above $100, which, coupled with weakening economic data, has significantly heightened market concerns over "stagflationary disruptions."
On one hand, February CPI rose 2.4% year-over-year and core CPI rose 2.5%, suggesting inflation is not yet out of control; on the other hand, non-farm payrolls disappointed with a loss of 92,000 jobs and the unemployment rate rising to 4.4%, while Q4 2025 GDP growth was revised down to 0.7%, indicating significantly weakened growth momentum.
Under this contradictory combination of factors, the focus of this meeting has shifted to the pricing of the policy path.
This FOMC meeting will simultaneously release the dot plot and economic projections, followed by a press conference held by Fed Chair Jerome Powell. Market trading will center on the following four signals.
First is the change in the dot plot.
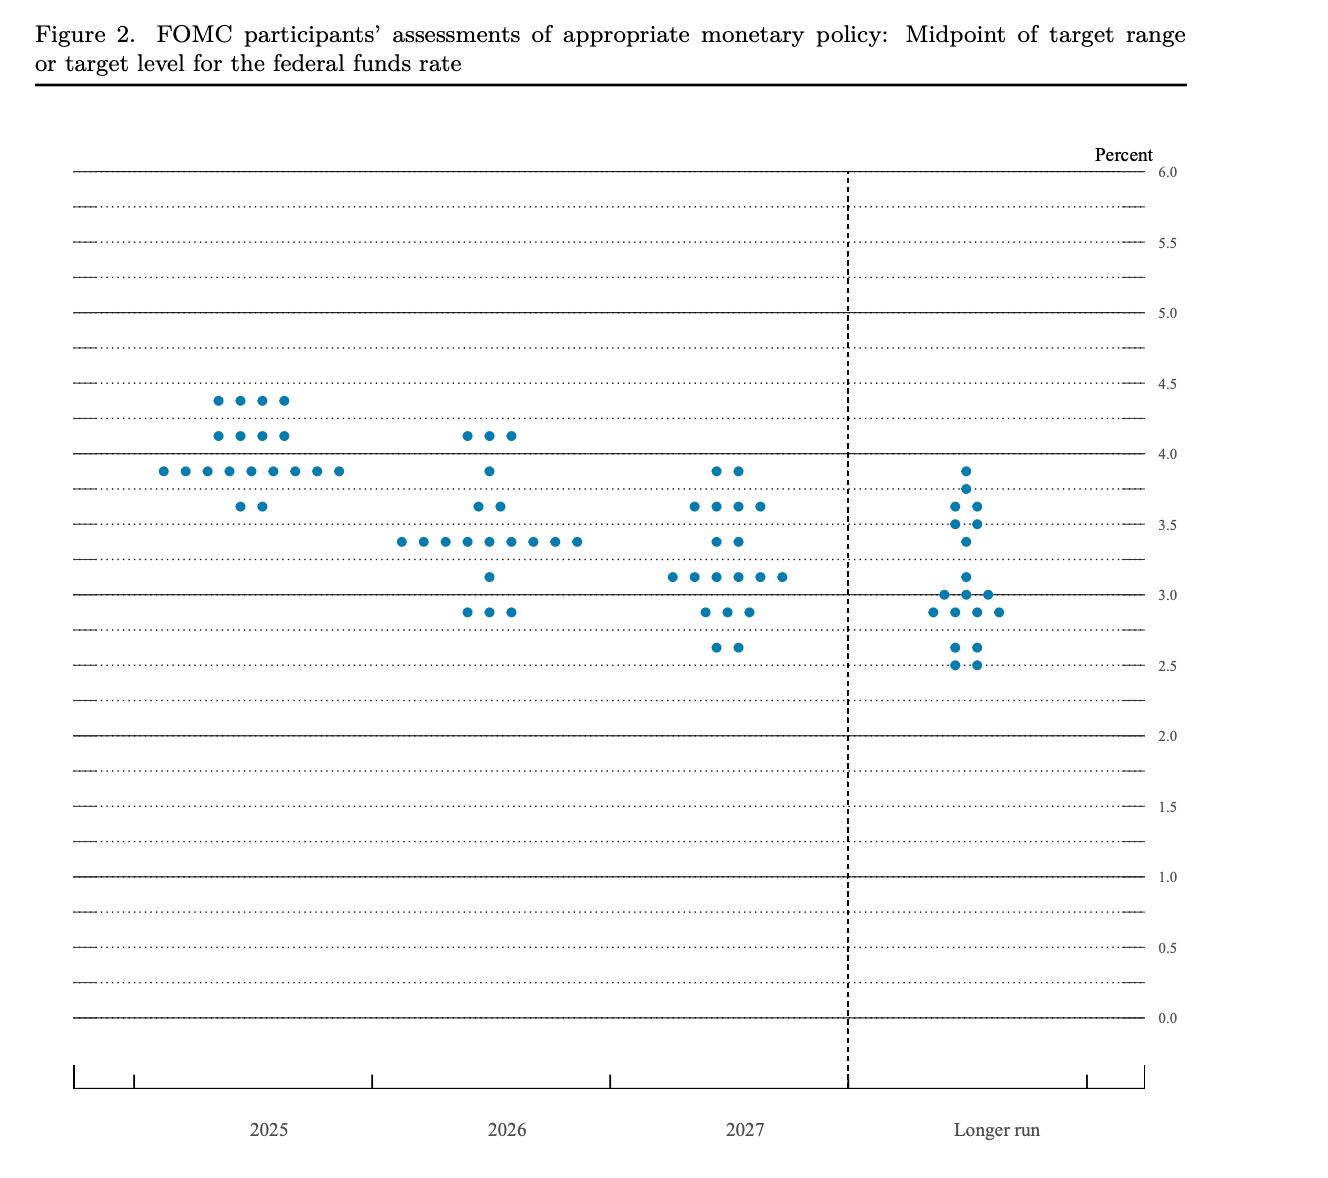
[Fed December 2025 FOMC Meeting Dot Plot, Source: www.federalreserve.gov ]
Last December's forecast showed the 2026 median corresponding to only one rate cut.
Most major institutions generally expect that this framework will not undergo fundamental changes, but the distribution may show significant divergence: rising oil prices reinforce the inflation concerns of some officials, while weakening employment pushes other members toward a more dovish stance.
If the median shifts from "one cut" to "zero cuts," the market will quickly interpret it as hawkish repricing; conversely, if the original path is maintained, it would mean the Fed has not been completely derailed by short-term energy shocks.
Second is the direction of adjustments to economic projections. The market is more focused on structural changes rather than single indicators.
If the Fed simultaneously downwardly revises growth while upwardly revising the unemployment rate and inflation expectations, this would constitute a classic "stagflation combo," implying a significant increase in the difficulty of policy-making. The core of the current internal debate is whether the oil price shock is merely a supply-side disruption or if it will evolve into broader, sticky inflation.
In addition, a more critical variable lies in how the Fed characterizes the rise in oil prices.
If Powell views it as a short-term, exogenous shock and emphasizes that core inflation and inflation expectations remain anchored, the market will tend to believe that policy will not tighten as a result; however, if he repeatedly mentions the spillover effects of energy prices or even hints at the risk of a resurgence in inflation, it would signal that the Fed's tolerance for the current shock is declining.
Based on the variables above, the market can be broadly categorized into three scenarios.
The first is the baseline scenario, "holding rates steady with the dot plot remaining largely unchanged." In this case, the market would interpret the meeting as "no further hawkish shift," potentially leading to a tactical recovery in risk assets. Growth sectors previously suppressed by interest rates might rebound, and the market could view this as a positive signal.
The second scenario involves a more hawkish stance than expected. If the dot plot tilts toward "zero rate cuts," or if Powell emphasizes inflation risks while downplaying growth pressures, short-term rates will rise quickly, the dollar will strengthen, and tech and high-valuation assets will come under pressure. In the current environment, the market is most sensitive not to current rate levels, but to whether the future path of easing is being delayed.
The third scenario is a more dovish stance. If the Fed significantly lowers growth projections, emphasizes weakening employment, and defines the oil price shock as a one-off factor, the market might once again bet on an earlier rate cut. Rate-sensitive assets, long-duration sectors, and gold would benefit. However, the sustainability of this scenario highly depends on oil price trends; if energy prices remain high, a rebound in inflation expectations will quickly suppress market optimism.
Against a backdrop where inflation is not yet out of control but growth is already showing signs of exhaustion, the Fed is in a classic dilemma. For the market, the true signal lies in how the Fed redefines the boundaries of future policy.
Recommended Articles


