

Dow Jones Industrial Average holds onto near-term highs on Monday
- The Dow Jones gapped into fresh highs on Monday, but topside momentum remains restrained.
- President Trump warned that he would not delay his already delayed reciprocal tariffs any further.
- Trump staffers continue to tease trade deals with other countries, but details remain thin.
The Dow Jones Industrial Average (DJIA) gapped into fresh 19-week highs at the start of the new trading week, testing above 44,000 for the first time since mid-February. Equity markets opened the week on a bullish note, and indexes are clawing back into record high territory despite some trade and budget headwinds from the Trump administration.
Canada rescinded its looming digital service tax over the weekend after President Donald Trump table-flipped all trade talks with Canada last Friday. Despite the cross-border services tax having been proposed in 2019 and then signed into Canadian law in 2024, the Trump administration pivoted to considering the tax on US services that cross international borders as a hard no-go last week.
Read more Trump news: Fed is "too slow" on rate cuts
Donald Trump also reiterated that he would not be canceling or delaying his already-delayed reciprocal tariffs any further, which are due to come back into effect on July 9. After announcing a wide-reaching bundle of tariffs in April, the Trump administration quickly pivoted, tacking on a 90-day extension to give countries time to negotiate trade deals that Donald Trump deems acceptable. Hard numbers on any pending trade deals remain functionally non-existent, but Trump staffers claiming that large trade deals are just around the corner has become a matter of routine.
Read more stock news: Goldman Sachs reaches all-time high as banks expect lower capital buffers
Dow Jones price forecast
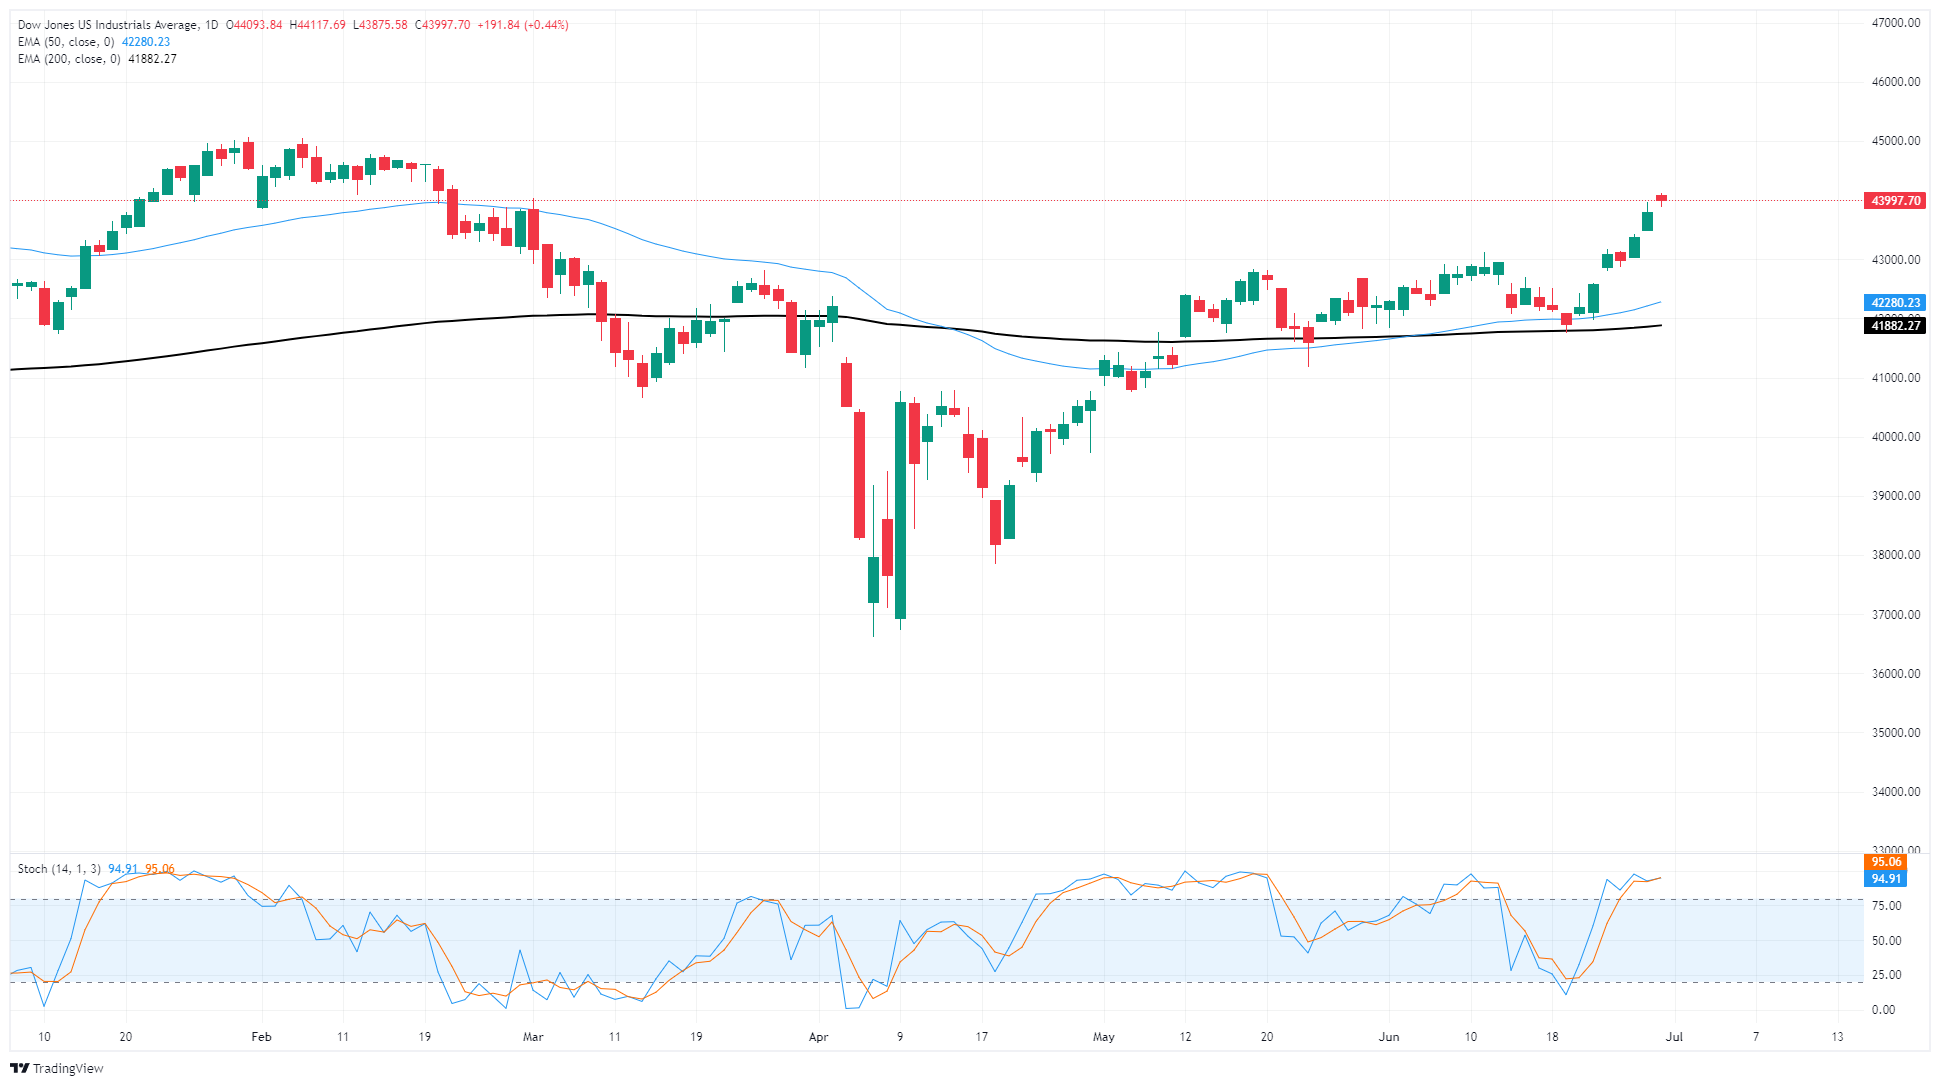
Monday marks the last day of trading in the second quarter, and the Dow Jones Industrial Average is poised to continue grinding its way back into record highs posted in late 2024 just north of the 45,000 major price handle. Equity indexes took a nosedive in April, but the Dow Jones has recovered firmly, rebounding over 20% bottom-to-top.
The major equity index tested chart territory above 44,000 for the first time since February. However, the Dow Jones could be poised for a break: bullish momentum has carried the Dow deep into overbought territory according to technical oscillators, and prices have outrun the 50-day Exponential Moving Average (EMA) at their fastest pace since November of 2024.
Dow Jones daily chart
Dow Jones FAQs
The Dow Jones Industrial Average, one of the oldest stock market indices in the world, is compiled of the 30 most traded stocks in the US. The index is price-weighted rather than weighted by capitalization. It is calculated by summing the prices of the constituent stocks and dividing them by a factor, currently 0.152. The index was founded by Charles Dow, who also founded the Wall Street Journal. In later years it has been criticized for not being broadly representative enough because it only tracks 30 conglomerates, unlike broader indices such as the S&P 500.
Many different factors drive the Dow Jones Industrial Average (DJIA). The aggregate performance of the component companies revealed in quarterly company earnings reports is the main one. US and global macroeconomic data also contributes as it impacts on investor sentiment. The level of interest rates, set by the Federal Reserve (Fed), also influences the DJIA as it affects the cost of credit, on which many corporations are heavily reliant. Therefore, inflation can be a major driver as well as other metrics which impact the Fed decisions.
Dow Theory is a method for identifying the primary trend of the stock market developed by Charles Dow. A key step is to compare the direction of the Dow Jones Industrial Average (DJIA) and the Dow Jones Transportation Average (DJTA) and only follow trends where both are moving in the same direction. Volume is a confirmatory criteria. The theory uses elements of peak and trough analysis. Dow’s theory posits three trend phases: accumulation, when smart money starts buying or selling; public participation, when the wider public joins in; and distribution, when the smart money exits.
There are a number of ways to trade the DJIA. One is to use ETFs which allow investors to trade the DJIA as a single security, rather than having to buy shares in all 30 constituent companies. A leading example is the SPDR Dow Jones Industrial Average ETF (DIA). DJIA futures contracts enable traders to speculate on the future value of the index and Options provide the right, but not the obligation, to buy or sell the index at a predetermined price in the future. Mutual funds enable investors to buy a share of a diversified portfolio of DJIA stocks thus providing exposure to the overall index.
Recommended Articles


