

Dow Jones Industrial Average lags behind tech sector recovery
- The Dow Jones struggled to hold off bearish momentum on Friday.
- Key stocks in the AI segment recovered ground to end the week, leaving the Dow behind.
- Markets await a backlog of official employment and inflation data now that the shutdown has ended.
The Dow Jones Industrial Average (DJIA) lagged behind its major index peers on Friday, backsliding nearly 600 points at its lowest before staging a half-hearted recovery, trimming the day’s losses to around 250 points. The AI-focused tech sector is recovering from mid-week losses that continue to plague the steeply overinvested market segment. However, a recent bump in investment into the financial and building materials sectors is seeing a fresh drawdown as traders pile back into their preferred AI bets.
Overweight valuations remain a weak point in the ongoing AI tech rally. Cloud computing services providers and chip producers continue to be the winning shovel-sellers in the AI craze, and investors are beginning to grow leery of the increasingly circular AI space. Major market players spend most of their time writing out cheques for multi-billion dollar deals to invest in each other, and balance sheet wonks are getting increasingly agitated at how fast and loose many AI companies are being in how they classify spending investors’ money as “capex”.
With the longest US federal government shutdown ever now over, at least until the end of January, investors are waiting for word on when federal agencies will resume publishing official labor and inflation figures. Markets are expecting that September’s long-delayed Nonfarm Payrolls (NFP) jobs report will be released next week, however, some traders remain perplexed by the White House’s ambiguous warning that October’s jobs and inflation data may never be released at all.
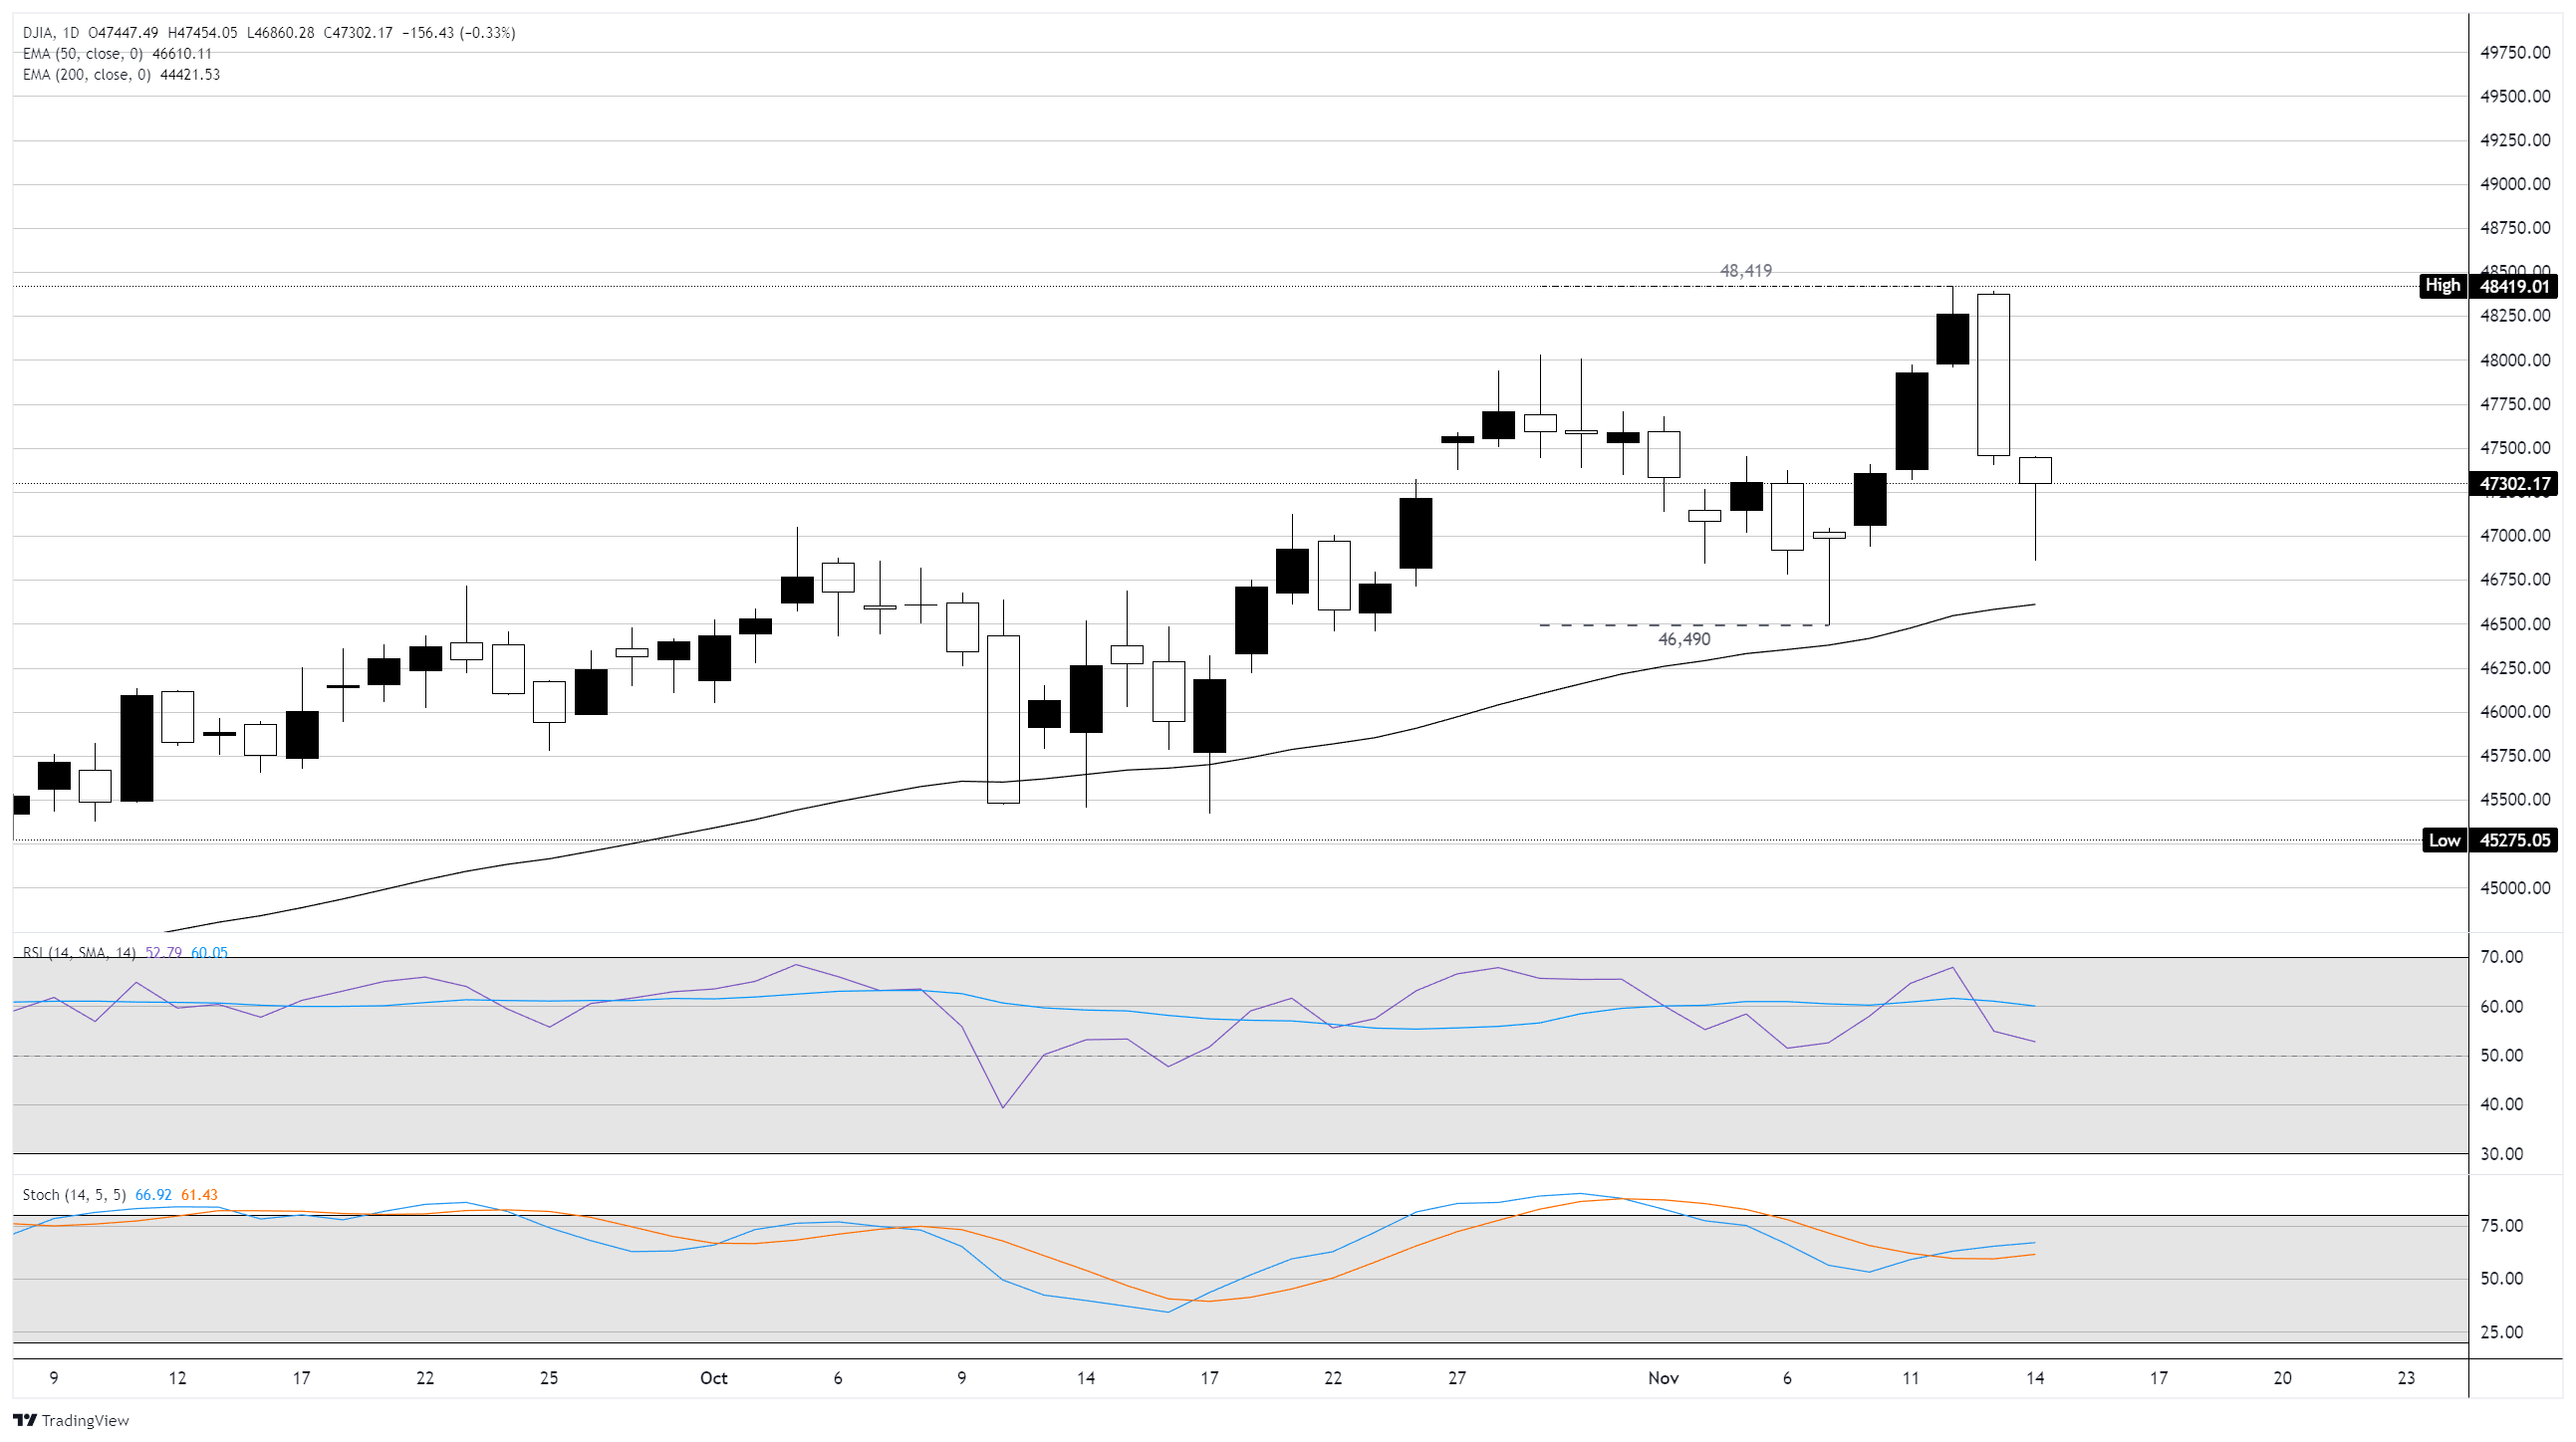
Dow Jones daily chart
Dow Jones FAQs
The Dow Jones Industrial Average, one of the oldest stock market indices in the world, is compiled of the 30 most traded stocks in the US. The index is price-weighted rather than weighted by capitalization. It is calculated by summing the prices of the constituent stocks and dividing them by a factor, currently 0.152. The index was founded by Charles Dow, who also founded the Wall Street Journal. In later years it has been criticized for not being broadly representative enough because it only tracks 30 conglomerates, unlike broader indices such as the S&P 500.
Many different factors drive the Dow Jones Industrial Average (DJIA). The aggregate performance of the component companies revealed in quarterly company earnings reports is the main one. US and global macroeconomic data also contributes as it impacts on investor sentiment. The level of interest rates, set by the Federal Reserve (Fed), also influences the DJIA as it affects the cost of credit, on which many corporations are heavily reliant. Therefore, inflation can be a major driver as well as other metrics which impact the Fed decisions.
Dow Theory is a method for identifying the primary trend of the stock market developed by Charles Dow. A key step is to compare the direction of the Dow Jones Industrial Average (DJIA) and the Dow Jones Transportation Average (DJTA) and only follow trends where both are moving in the same direction. Volume is a confirmatory criteria. The theory uses elements of peak and trough analysis. Dow’s theory posits three trend phases: accumulation, when smart money starts buying or selling; public participation, when the wider public joins in; and distribution, when the smart money exits.
There are a number of ways to trade the DJIA. One is to use ETFs which allow investors to trade the DJIA as a single security, rather than having to buy shares in all 30 constituent companies. A leading example is the SPDR Dow Jones Industrial Average ETF (DIA). DJIA futures contracts enable traders to speculate on the future value of the index and Options provide the right, but not the obligation, to buy or sell the index at a predetermined price in the future. Mutual funds enable investors to buy a share of a diversified portfolio of DJIA stocks thus providing exposure to the overall index.
Recommended Articles


