

Dow Jones Industrial Average falls as downside momentum accelerates
- The Dow Jones fell another 200 points on Thursday, turning red on the week.
- The Dow has fallen for a third straight day as equities pull back from the brink on the AI rally.
- US GDP figures came in above expectations, but the underlying data is flashing warning signs.
The Dow Jones Industrial Average pivoted further into the bearish side on Thursday, shedding around 400 points top-to-bottom and slipping back below the 46,000 level as equity traders sharply rebalance their expectations for heavy AI investment schemes that have materialized in recent days. Treasury yields also rose on Thursday as the US government struggles with resolving its latest politically-fueled funding crisis.
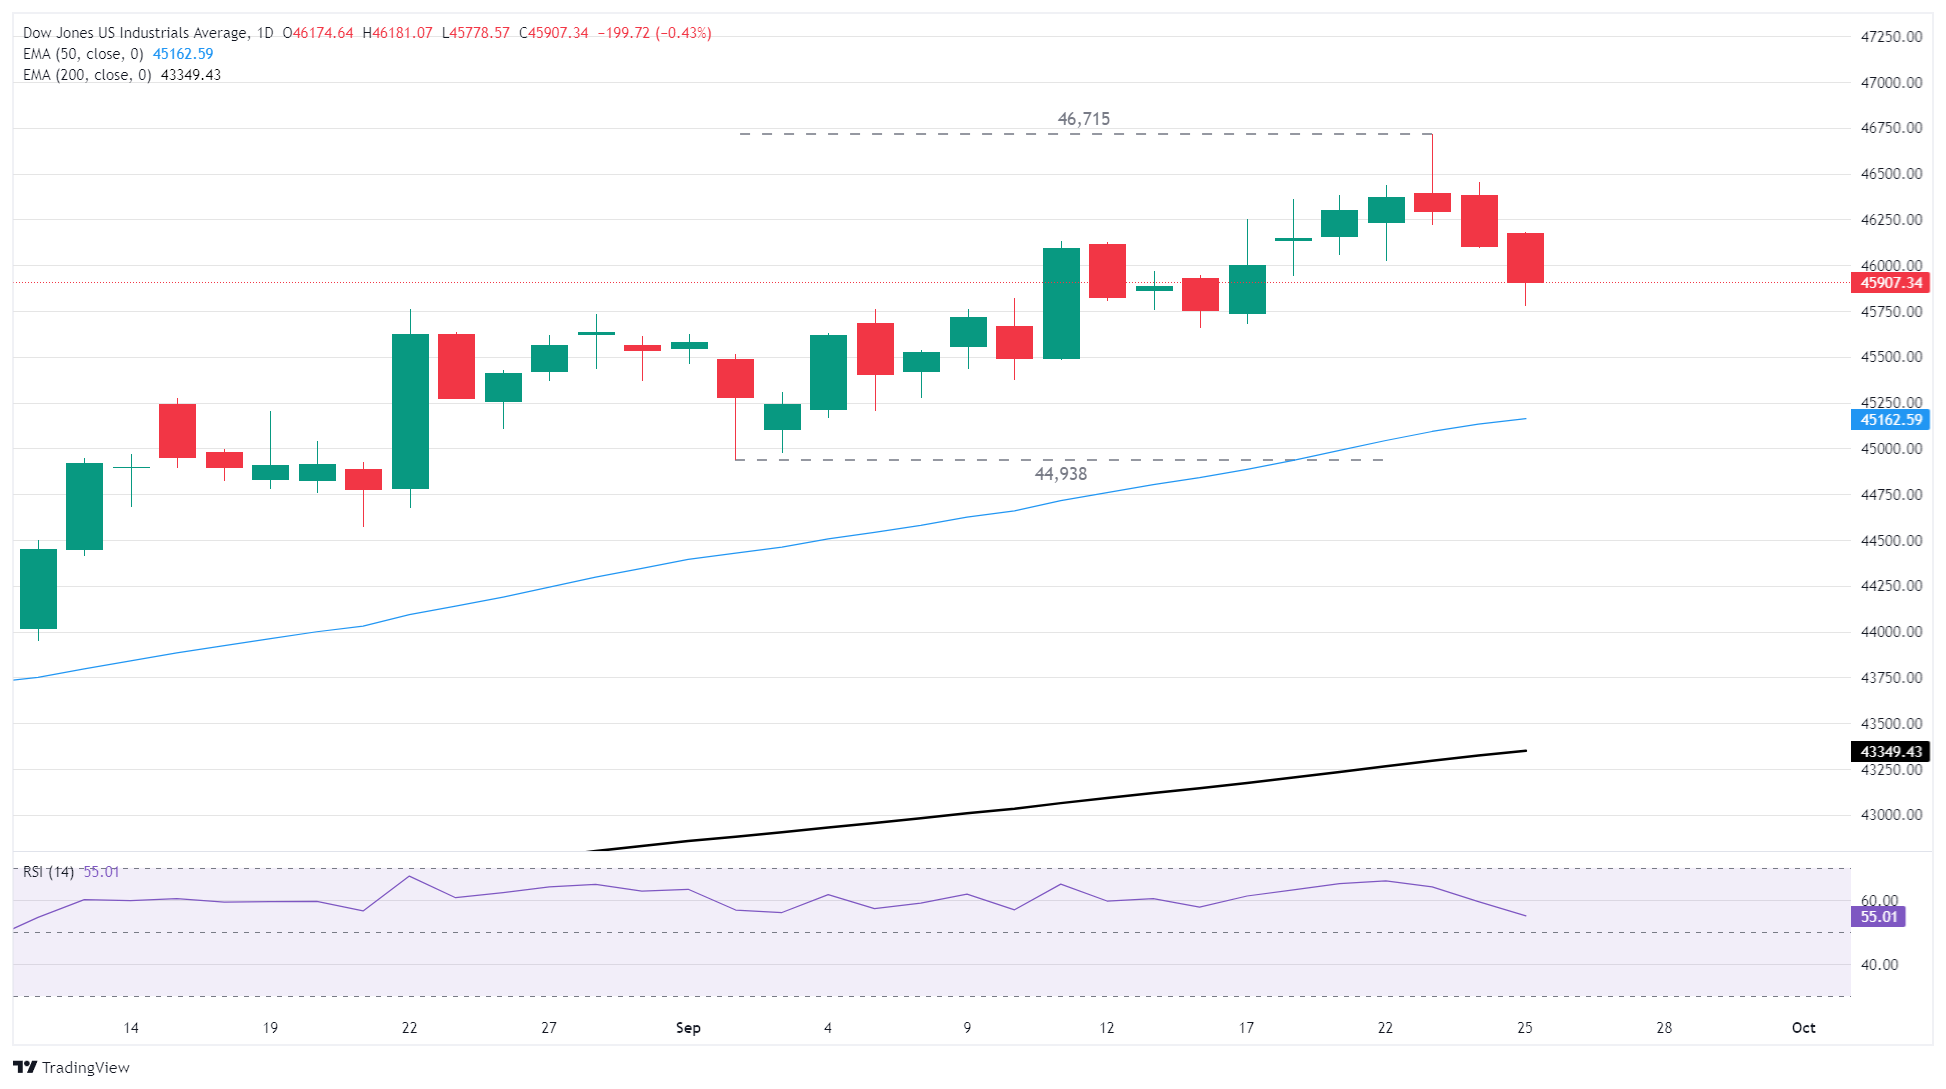
The Dow has stepped into a third straight day of consecutive losses, accelerating downward momentum and falling some 900-plus points from record highs posted just this week. The Dow is at the halfway point to the nearest technical support, the 50-day Exponential Moving Average (EMA), near 45,140, giving buyers plenty of room to rediscover their balance.
AI tech rally stumbles again as investment flows struggle to find revenue
AI winds blowing the sails of Oracle proved to be short-lived. After announcing major partnership opportunities with tech rally giants like OpenAI, Oracle shares raced higher. Now the tech-adjacent online services is grappling under the weight of an $18 billion corporate bond offering meant to shore up finances in preparation for pivoting into providing services for AI companies, which have proven to be a bottomless pit of demand in the cloud computing segment. However, investors have quickly turned leery on Oracle, with growing concerns that the company’s claims of soaring revenue on AI projects may have been overhyped.
US data looks good, but sputtering beneath the hood
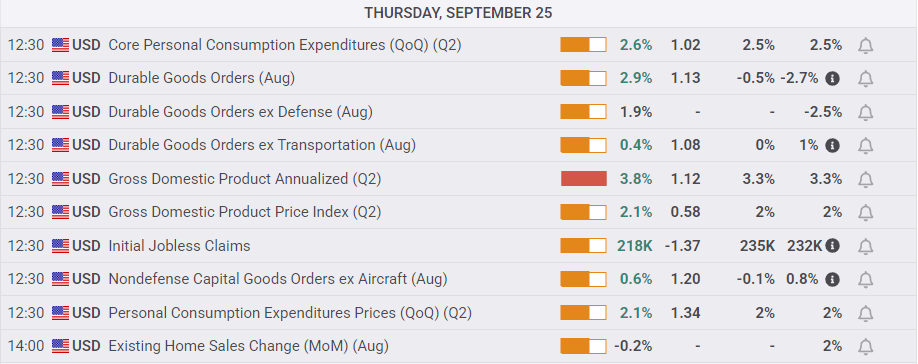
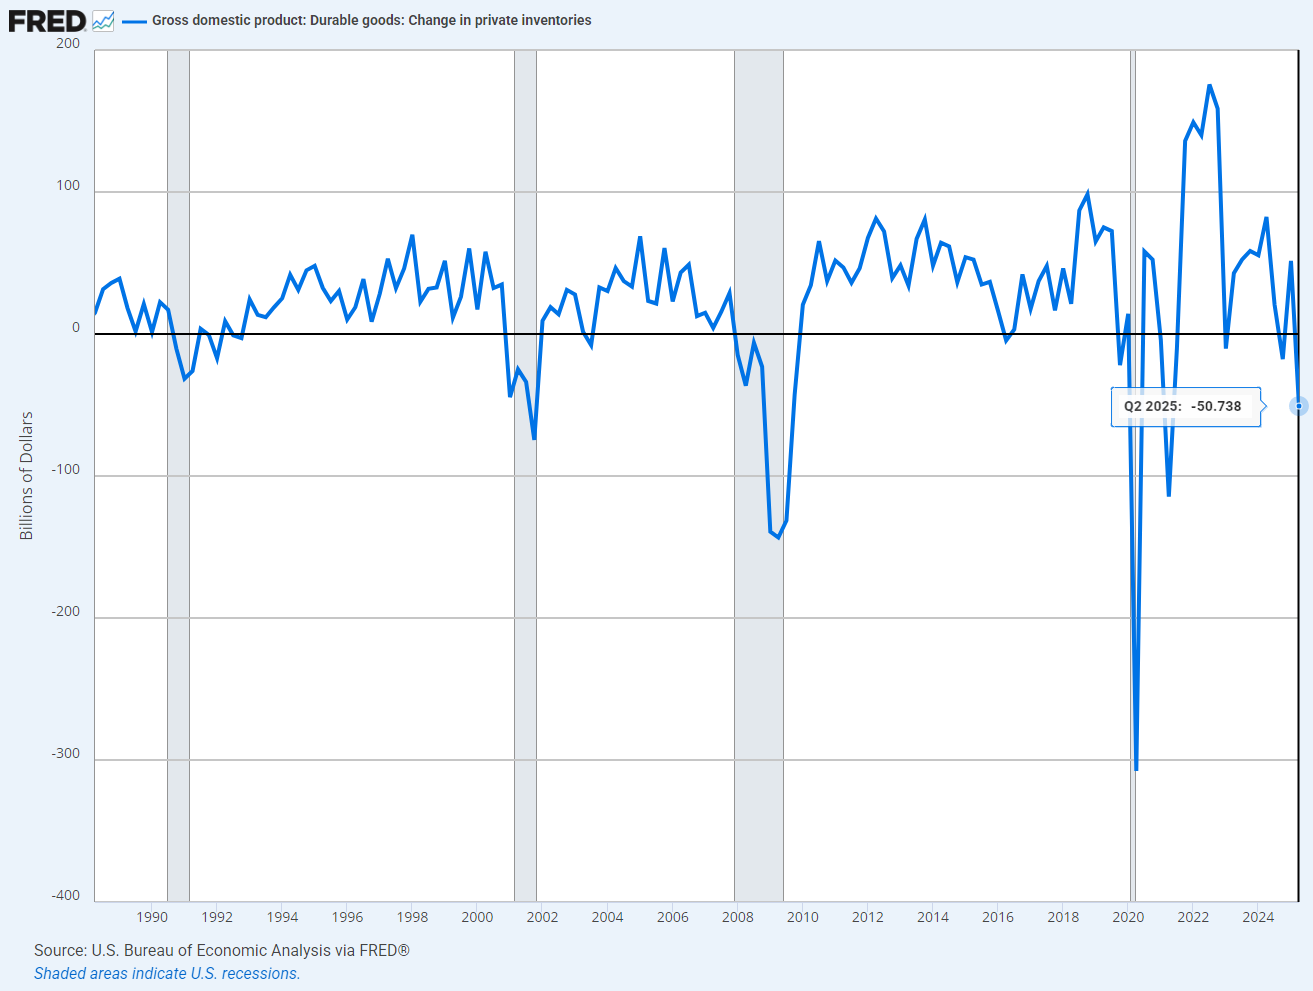
US annualized Gross Domestic Product (GDP) growth came in above expectations, climbing to 3.8% in Q2, well above the expected hold at 3.3%. However, here too lies complications: Despite a hard boost from Durable Goods Orders, which also rose well above expectations in Q2, US exports and imports both decline steeply, trimming almost half of a trillion dollars from the US trade market. US durable goods inventories also declined sharply in Q2, contracting by $50 billion. While all other growth metrics are still holding on the glowing side of good, Q2’s durable goods inventories contraction marks the steepest decline in that particular GDP segment since the global COVID-19 pandemic and the global financial crisis of 2008.
Personal Consumption Expenditures (PCE) Prices, a little-watched figure next to its larger inflation peers, also rose faster than expected in Q2, ticking up to 2.1% QoQ as the prices consumers are facing at the till continue to build up pressure. PCE Price Index inflation, due on Friday, will be the next key hurdle for data watchers.
How much could an Argentinian bailout cost, really?
The Trump administration has vowed to throw a lifeline to Argentinian President Javier Milei, who is grappling with a steepening economic and political crisis at home. According to US Treasury Secretary Scott Bessent, the Trump administration is hard at work negotiating a support and bailout program with Argentina and is prepared to offer upwards of $20 billion in swap lines and other bailout mechanisms.
This comes at a time when US farmers are collectively calling for action from the Trump administration to resolve a brewing agricultural crisis after Trump’s scattershot tariff policies have eviscerated American farming at the ground level, with farmers struggling to find buyers for their still-in-the-ground product, many of whom devoted their entire farms to growing crops for foreign buyers and the now-defunct USAID department. Even if international markets were to surge back into US agriculture, those same farmers are unable to find enough laborers and field hands to harvest and deliver this year’s fall crop.
Looming debt shutdown sparks fresh risk-off in Treasuries
The US government is also barreling towards another shutdown amid a looming funding crisis. Congress is struggling to meet in the middle on how to finance its funding obligations, and President Donald Trump’s current solution is to continue canceling meetings with key elected officials. The US government has overspent every single month since the formation of the Trump administration, spending over $200 billion more in its first 100 days than the previous administration. The trend of dipping deeper into deficits than expected has continued, and the US government is now running out of funding pools faster than anticipated. US Treasury yields are climbing again as bond traders balk at the US government's ongoing difficulties to follow its own budget.
Dow Jones Industrial Average daily chart
Dow Jones FAQs
The Dow Jones Industrial Average, one of the oldest stock market indices in the world, is compiled of the 30 most traded stocks in the US. The index is price-weighted rather than weighted by capitalization. It is calculated by summing the prices of the constituent stocks and dividing them by a factor, currently 0.152. The index was founded by Charles Dow, who also founded the Wall Street Journal. In later years it has been criticized for not being broadly representative enough because it only tracks 30 conglomerates, unlike broader indices such as the S&P 500.
Many different factors drive the Dow Jones Industrial Average (DJIA). The aggregate performance of the component companies revealed in quarterly company earnings reports is the main one. US and global macroeconomic data also contributes as it impacts on investor sentiment. The level of interest rates, set by the Federal Reserve (Fed), also influences the DJIA as it affects the cost of credit, on which many corporations are heavily reliant. Therefore, inflation can be a major driver as well as other metrics which impact the Fed decisions.
Dow Theory is a method for identifying the primary trend of the stock market developed by Charles Dow. A key step is to compare the direction of the Dow Jones Industrial Average (DJIA) and the Dow Jones Transportation Average (DJTA) and only follow trends where both are moving in the same direction. Volume is a confirmatory criteria. The theory uses elements of peak and trough analysis. Dow’s theory posits three trend phases: accumulation, when smart money starts buying or selling; public participation, when the wider public joins in; and distribution, when the smart money exits.
There are a number of ways to trade the DJIA. One is to use ETFs which allow investors to trade the DJIA as a single security, rather than having to buy shares in all 30 constituent companies. A leading example is the SPDR Dow Jones Industrial Average ETF (DIA). DJIA futures contracts enable traders to speculate on the future value of the index and Options provide the right, but not the obligation, to buy or sell the index at a predetermined price in the future. Mutual funds enable investors to buy a share of a diversified portfolio of DJIA stocks thus providing exposure to the overall index.
Recommended Articles


