

Ethereum Price Prediction: What To Expect From ETH in April 2026
Ethereum (ETH) price is trading above $2,000 as March prepares to close with its first green monthly candle since August 2025, potentially snapping a six-month losing streak.
However, how March closes could set the tone for April and even the rest of 2026. Historically, April has been a solid month for ETH with average gains of 18% and a median of roughly 9%. Yet the 3-day chart, on-chain conviction, and whale behavior all suggest the path into April carries more risk than seasonality would imply.
A Six-Month Red Streak May End, but the 3-Day Chart Warns
Ethereum price has not posted a positive monthly close since August 2025. March is on track to break that streak, though gains remain modest. Historically, April ranks among the stronger months for ETH, with average returns of 18% and median returns above 9%.
Want more token insights like this? Sign up for Editor Harsh Notariya’s Daily Crypto Newsletter here.
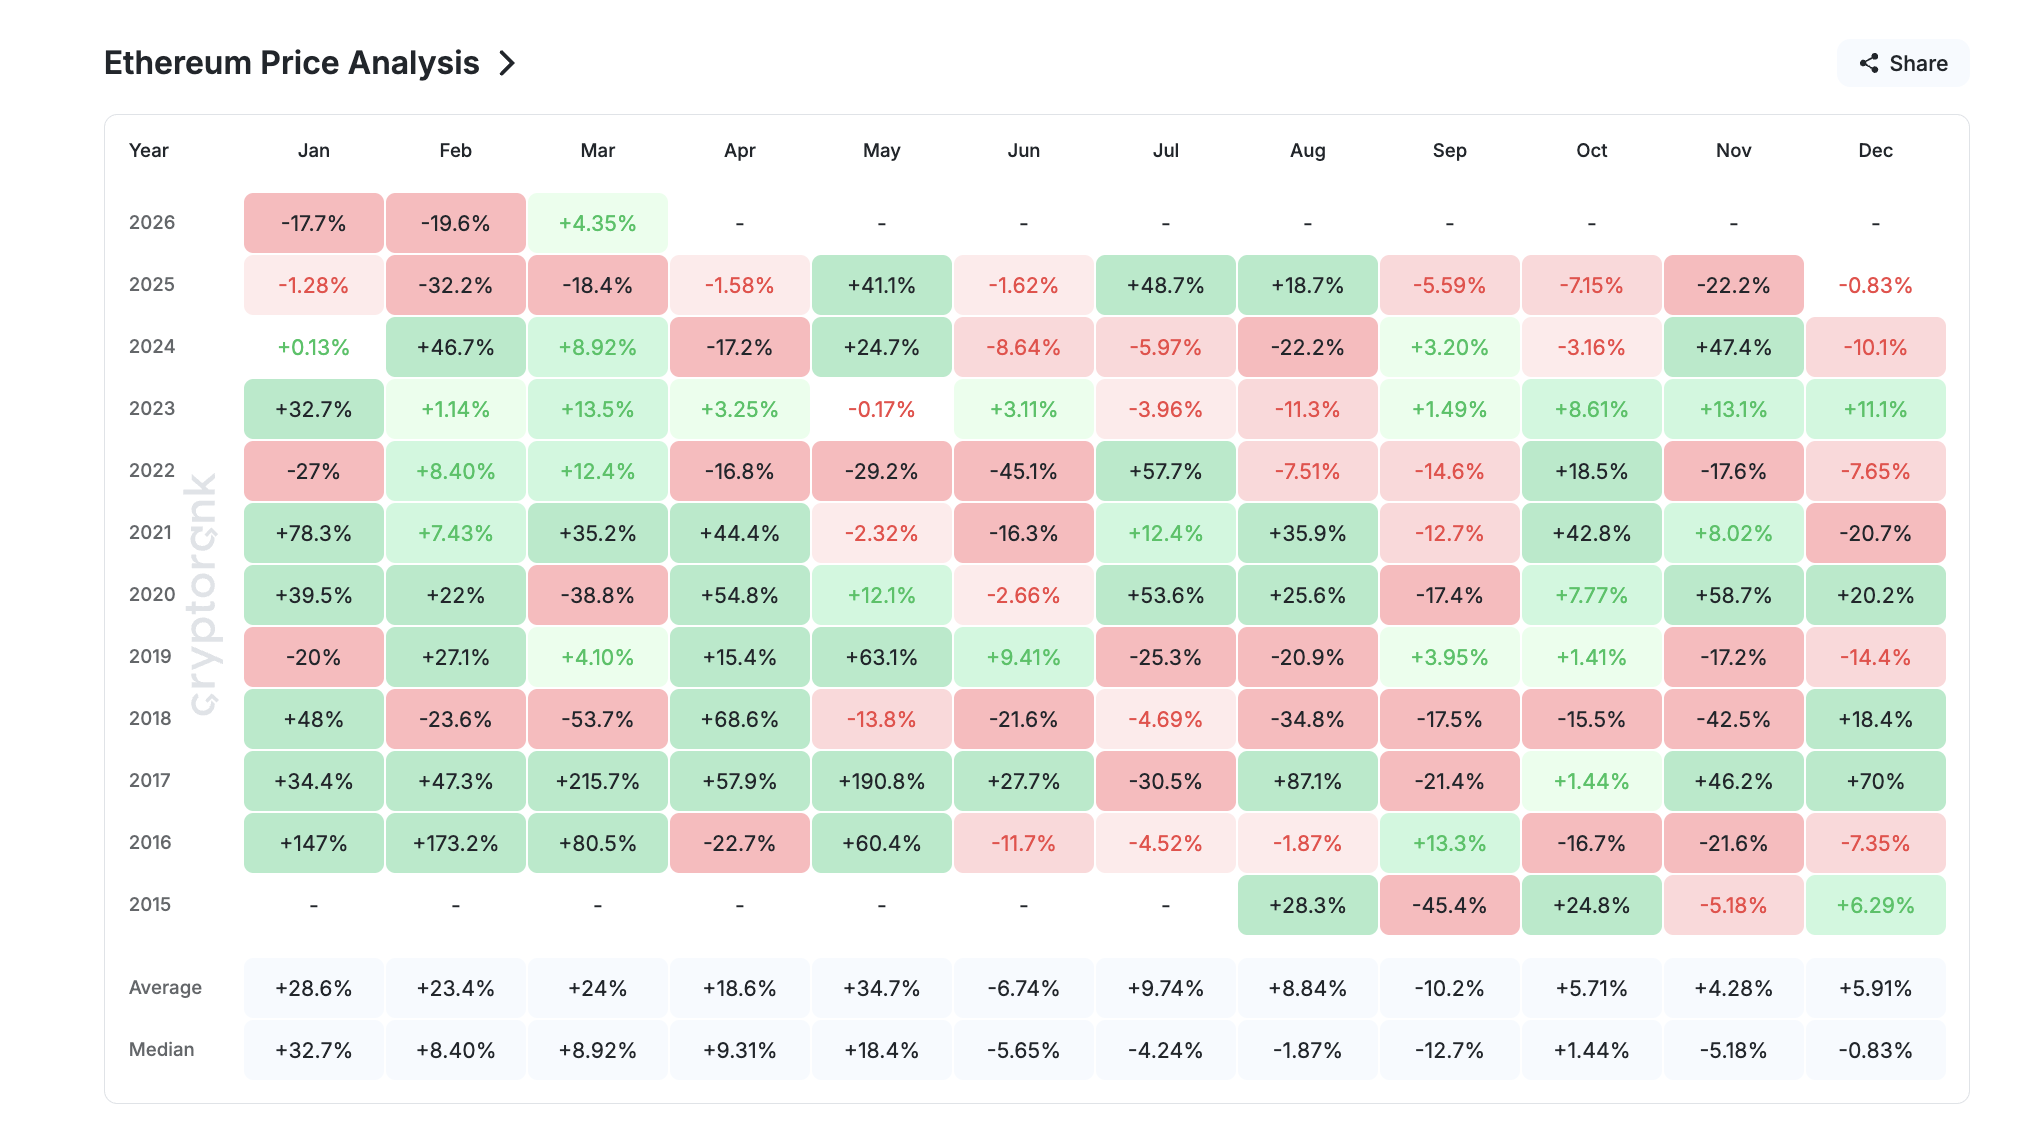 ETH Monthly Returns: CryptoRank
However, the 3-day chart introduces a structural concern. Since hitting a low of roughly $1,730 on Feb. 6, ETH has been rising inside an ascending channel. That channel formed after a near 50% decline from the $3,410 peak on Jan. 13. Ascending channels that develop after steep corrections often act as continuation patterns, resolving lower rather than higher unless the upper trendline breaks convincingly.
The Relative Strength Index (RSI), a momentum oscillator, has formed a hidden bearish divergence on the 3-day timeframe. Between Dec. 9 and March 23, the price made a lower high while the RSI made a higher high. Hidden bearish divergence signals that the dominant downtrend for ETH is likely to resume despite the apparent recovery. This strengthens the ascending channel theory that the chart already highlights.
A similar divergence appeared between Dec. 9 and March 14. After that signal was confirmed, ETH corrected sharply. The current divergence was confirmed on March 23, and prices have already pulled back from the $2,200 area toward $2,000. The lower trendline of the ascending channel is now acting as support. If it breaks on the 3-day chart, the bearish thesis carries into April with added force.
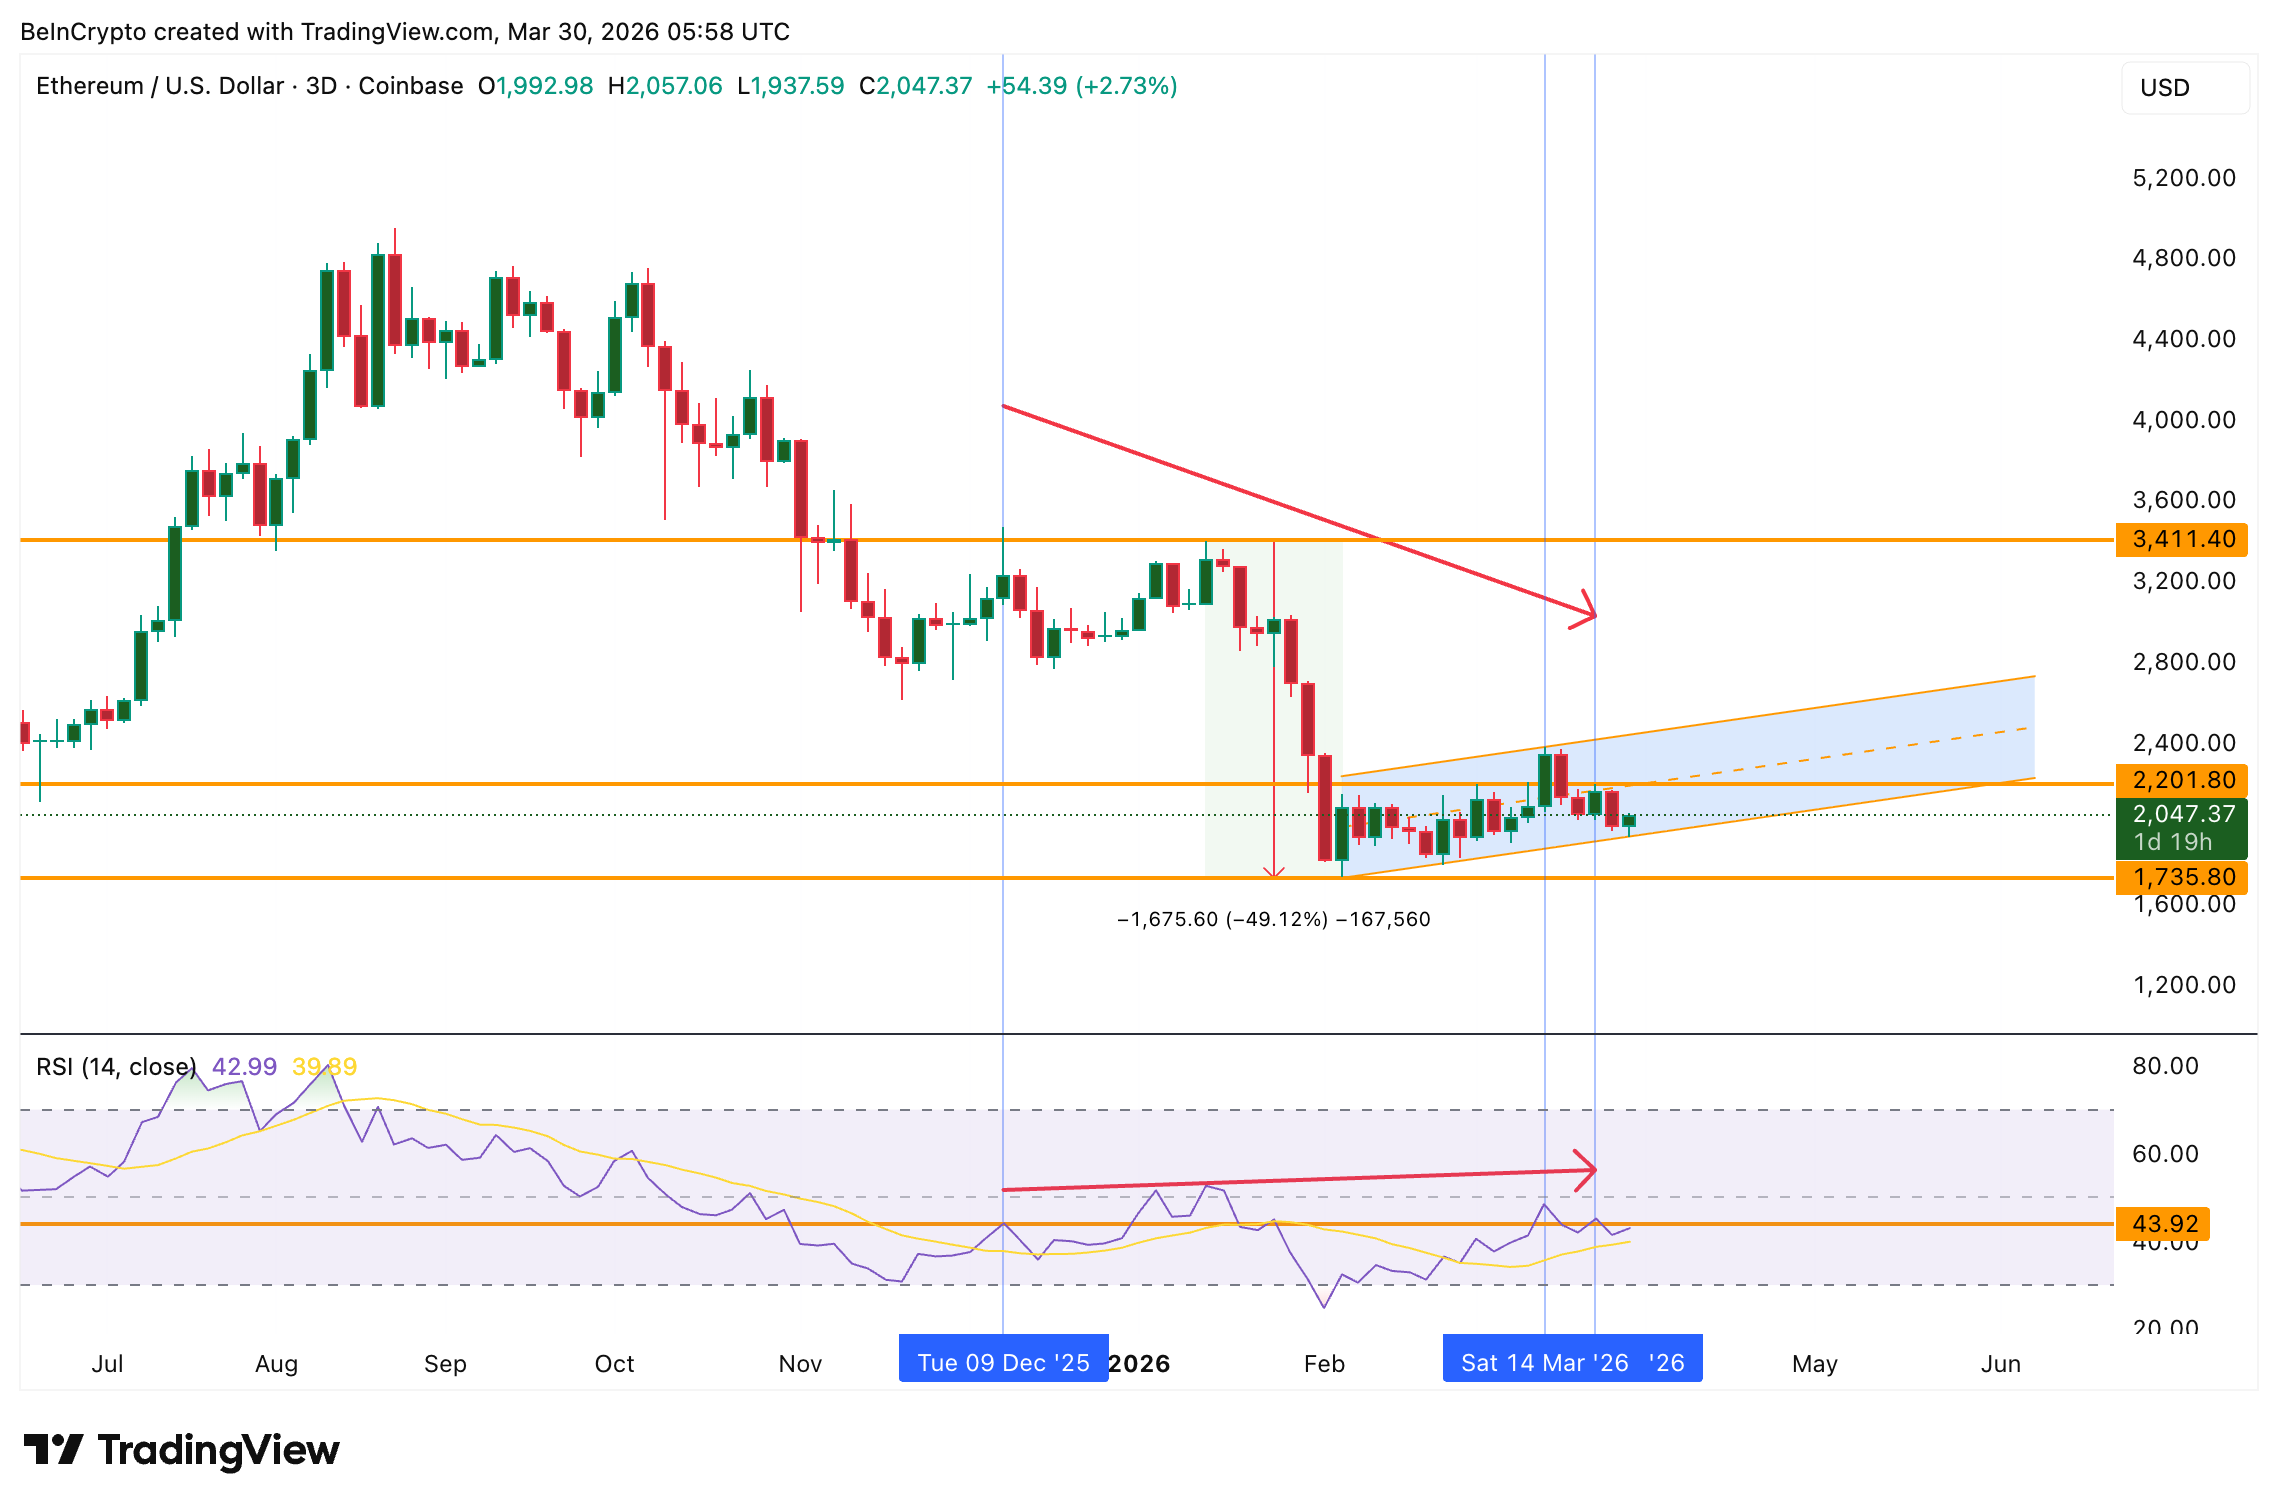 3-Day RSI Divergence: TradingView
The technical setup alone does not confirm whether the channel will hold or break. On-chain conviction data provides that answer.
Hodler Conviction Collapsed, and Whales Just Started Selling
The Ethereum hodler net position change, a Glassnode metric that tracks the 30-day rolling accumulation by wallets holding ETH for more than 155 days, peaked at 543,169 ETH on March 21, its highest year-to-date level. By late March, that figure had collapsed to just 121,902 ETH, a near 78% decline.
That decline matters because a similar pattern played out earlier this year. Between mid-January and early February, hodler net position change weakened steadily before flipping negative on Feb. 3. During that transition, ETH price dropped from $3,383 to $1,824, a correction of roughly 46%. The current pace of decline mirrors that earlier deterioration.
While March is still closing in green, the conviction that supported the rally is evaporating in the final week. If hodler accumulation turns negative in early April, the February playbook suggests a significant move lower.
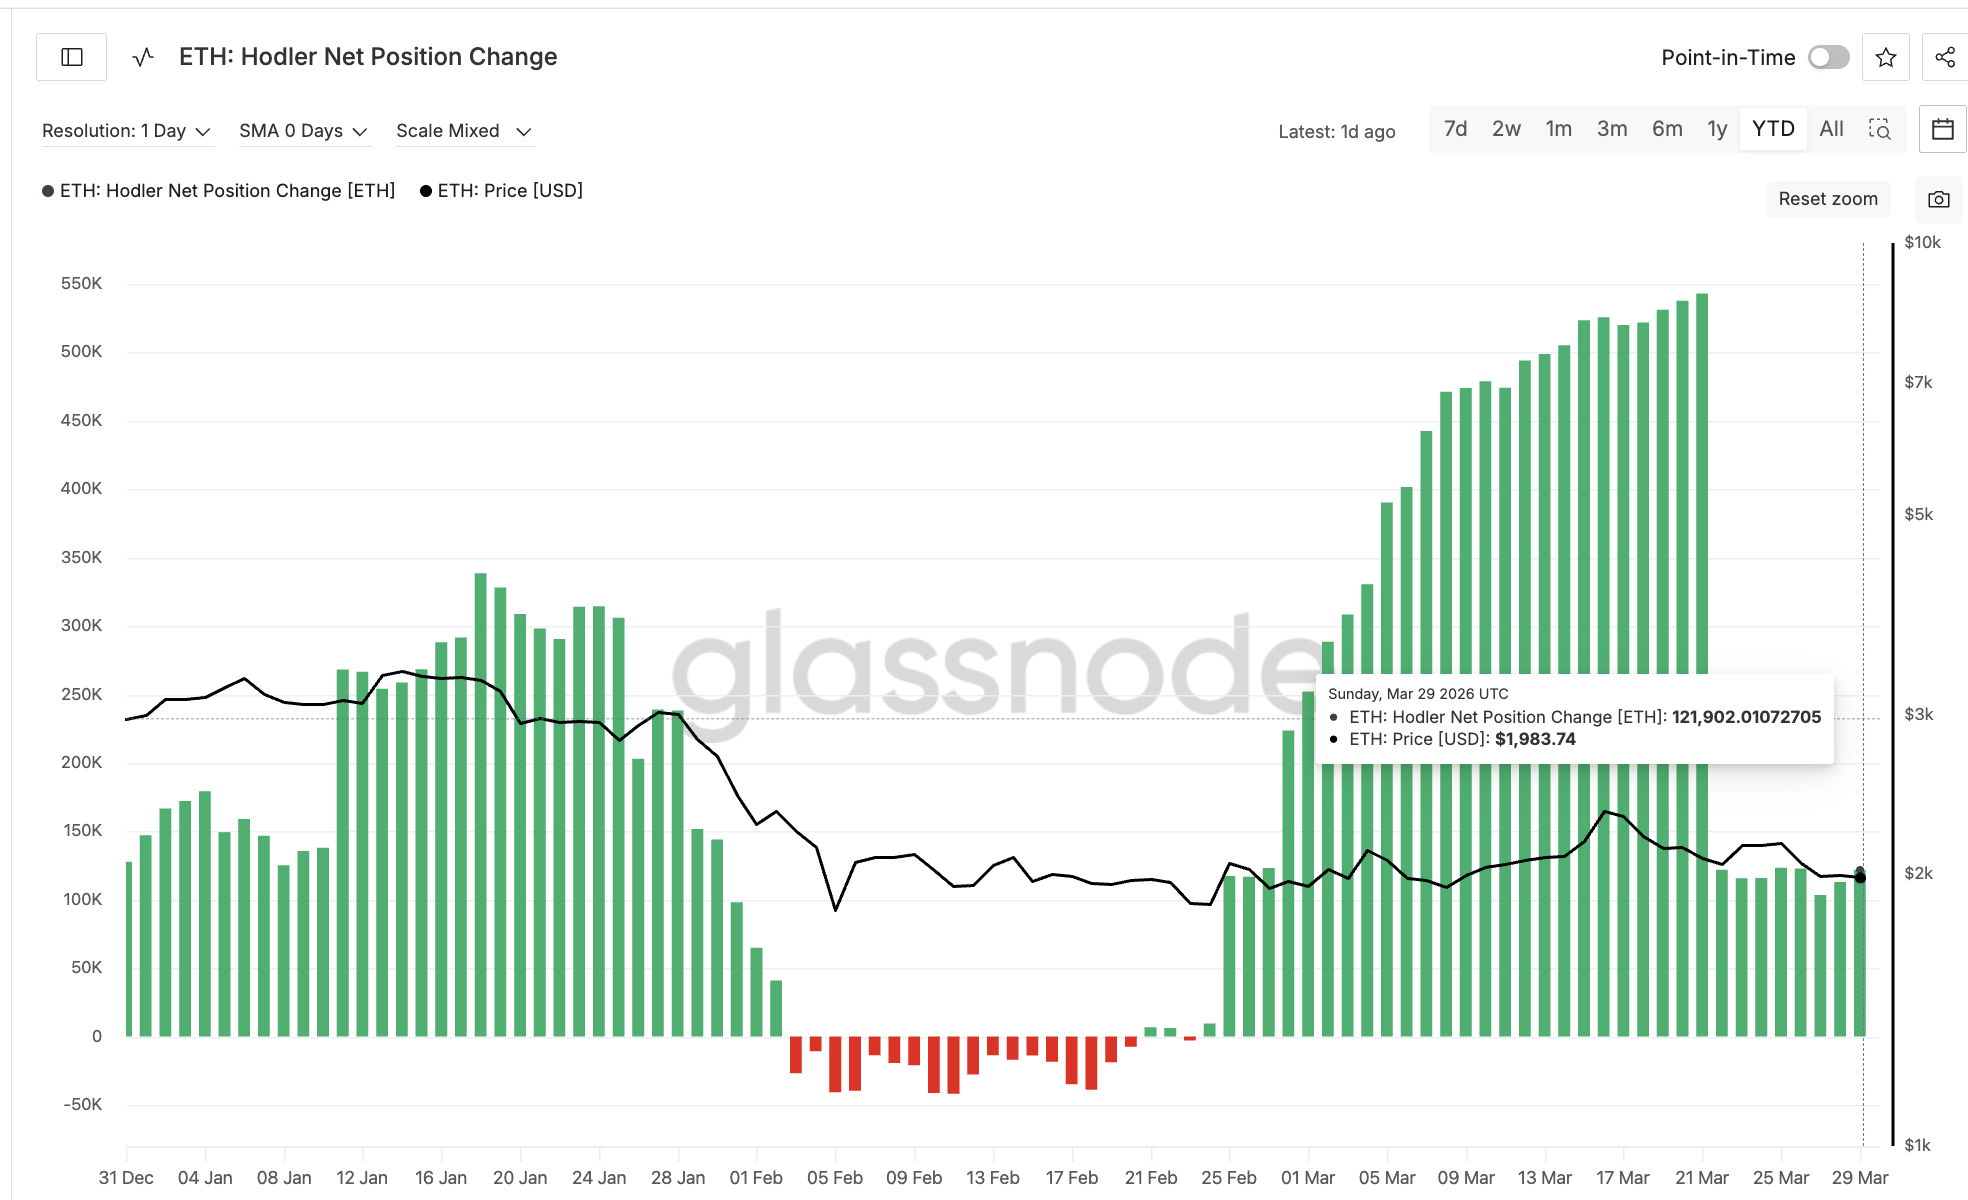 ETH Hodler Net Position Change: Glassnode
Ethereum whale behavior adds nuance. Two of the largest cohorts, wallets holding between 1 million and 10 million ETH and those holding between 100,000 and 1 million ETH, increased their share of supply since March 25. The larger group went from 8.07% to 8.22% of supply. The smaller group rose from 13.19% to 13.53%.
However, both cohorts reversed course heading into the final days of March. The larger whales began trimming on March 27, and the smaller cohort followed on March 29. The drops are minor so far, but the directional shift is significant. When hodler conviction weakens and whale accumulation stalls simultaneously, the demand side of the market thins at the worst possible time.
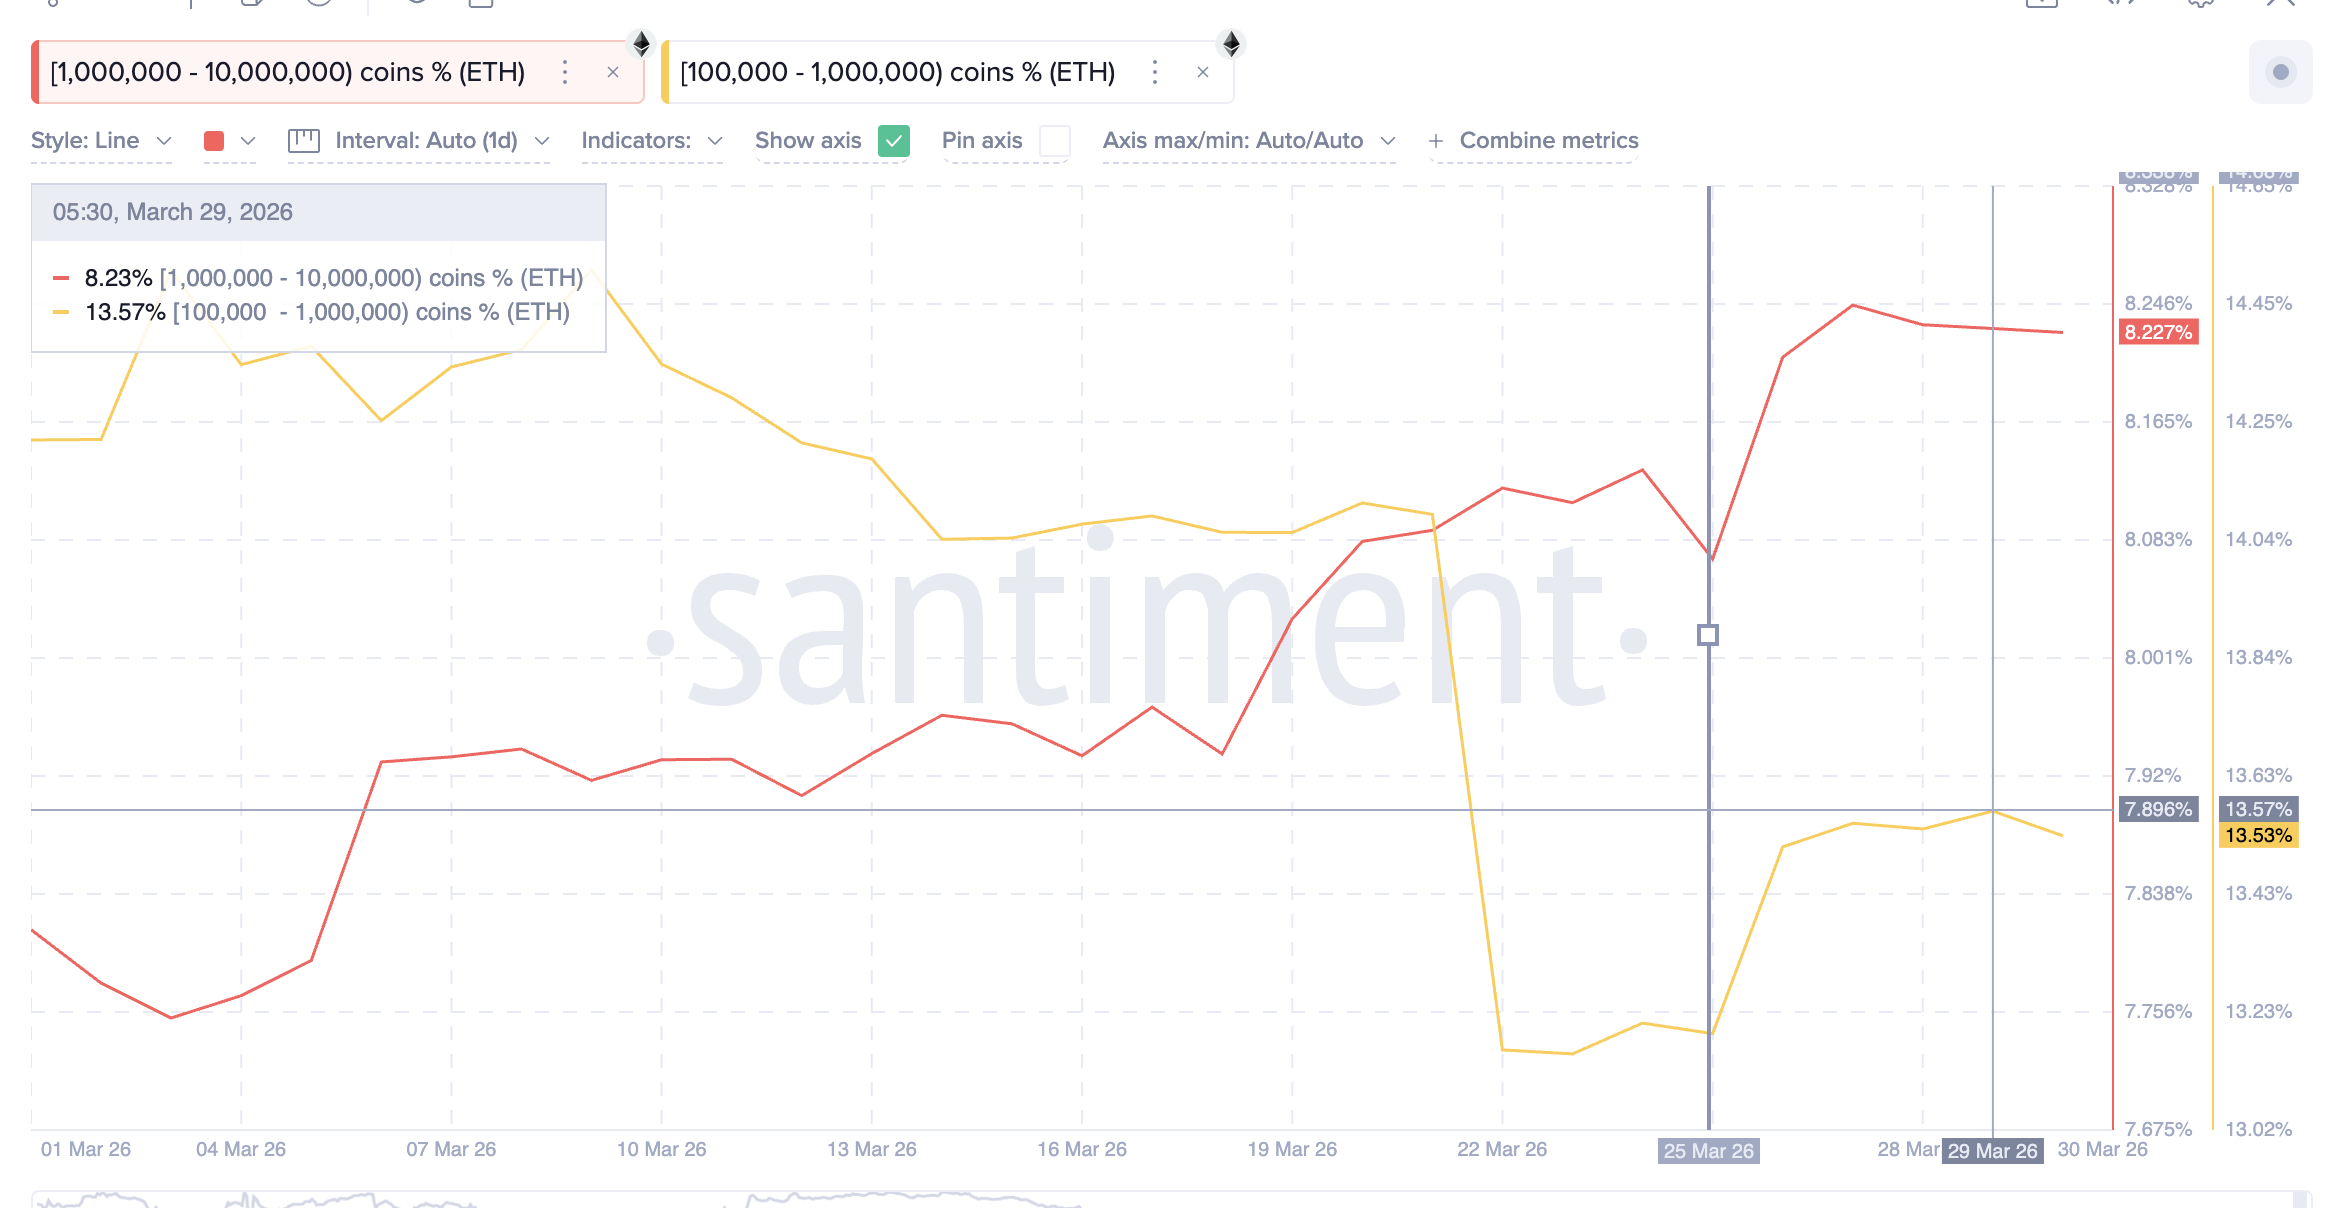 ETH Whale Supply Distribution: Santiment
The combination of fading conviction and reversing whale flows weakens the foundation heading into April. The price chart now determines whether these signals translate into a deeper decline.
Ethereum Price Needs $2,200 to Avoid a 30% Drop
For the Ethereum price prediction heading into April, the 3-day chart provides clear levels. To regain bullish momentum, ETH needs a 3-day close above $2,200, which would clear the immediate resistance zone. A stronger confirmation comes at $2,390, where a close would push price above the upper trendline of the ascending channel, converting the pattern from bearish continuation to genuine reversal.
That breakout scenario looks difficult given the weakening hodler conviction and whale distribution. The more probable path, based on the alignment of the hidden bearish divergence, collapsing hodler accumulation, and stalling whale buying, points lower.
On the downside, $2,000 (the 1,999 zone on the chart) is the immediate psychological and technical support. A 3-day close below $2,000 would confirm the channel breakdown and expose the $1,750 to $1,730 zone, which marks the February low.
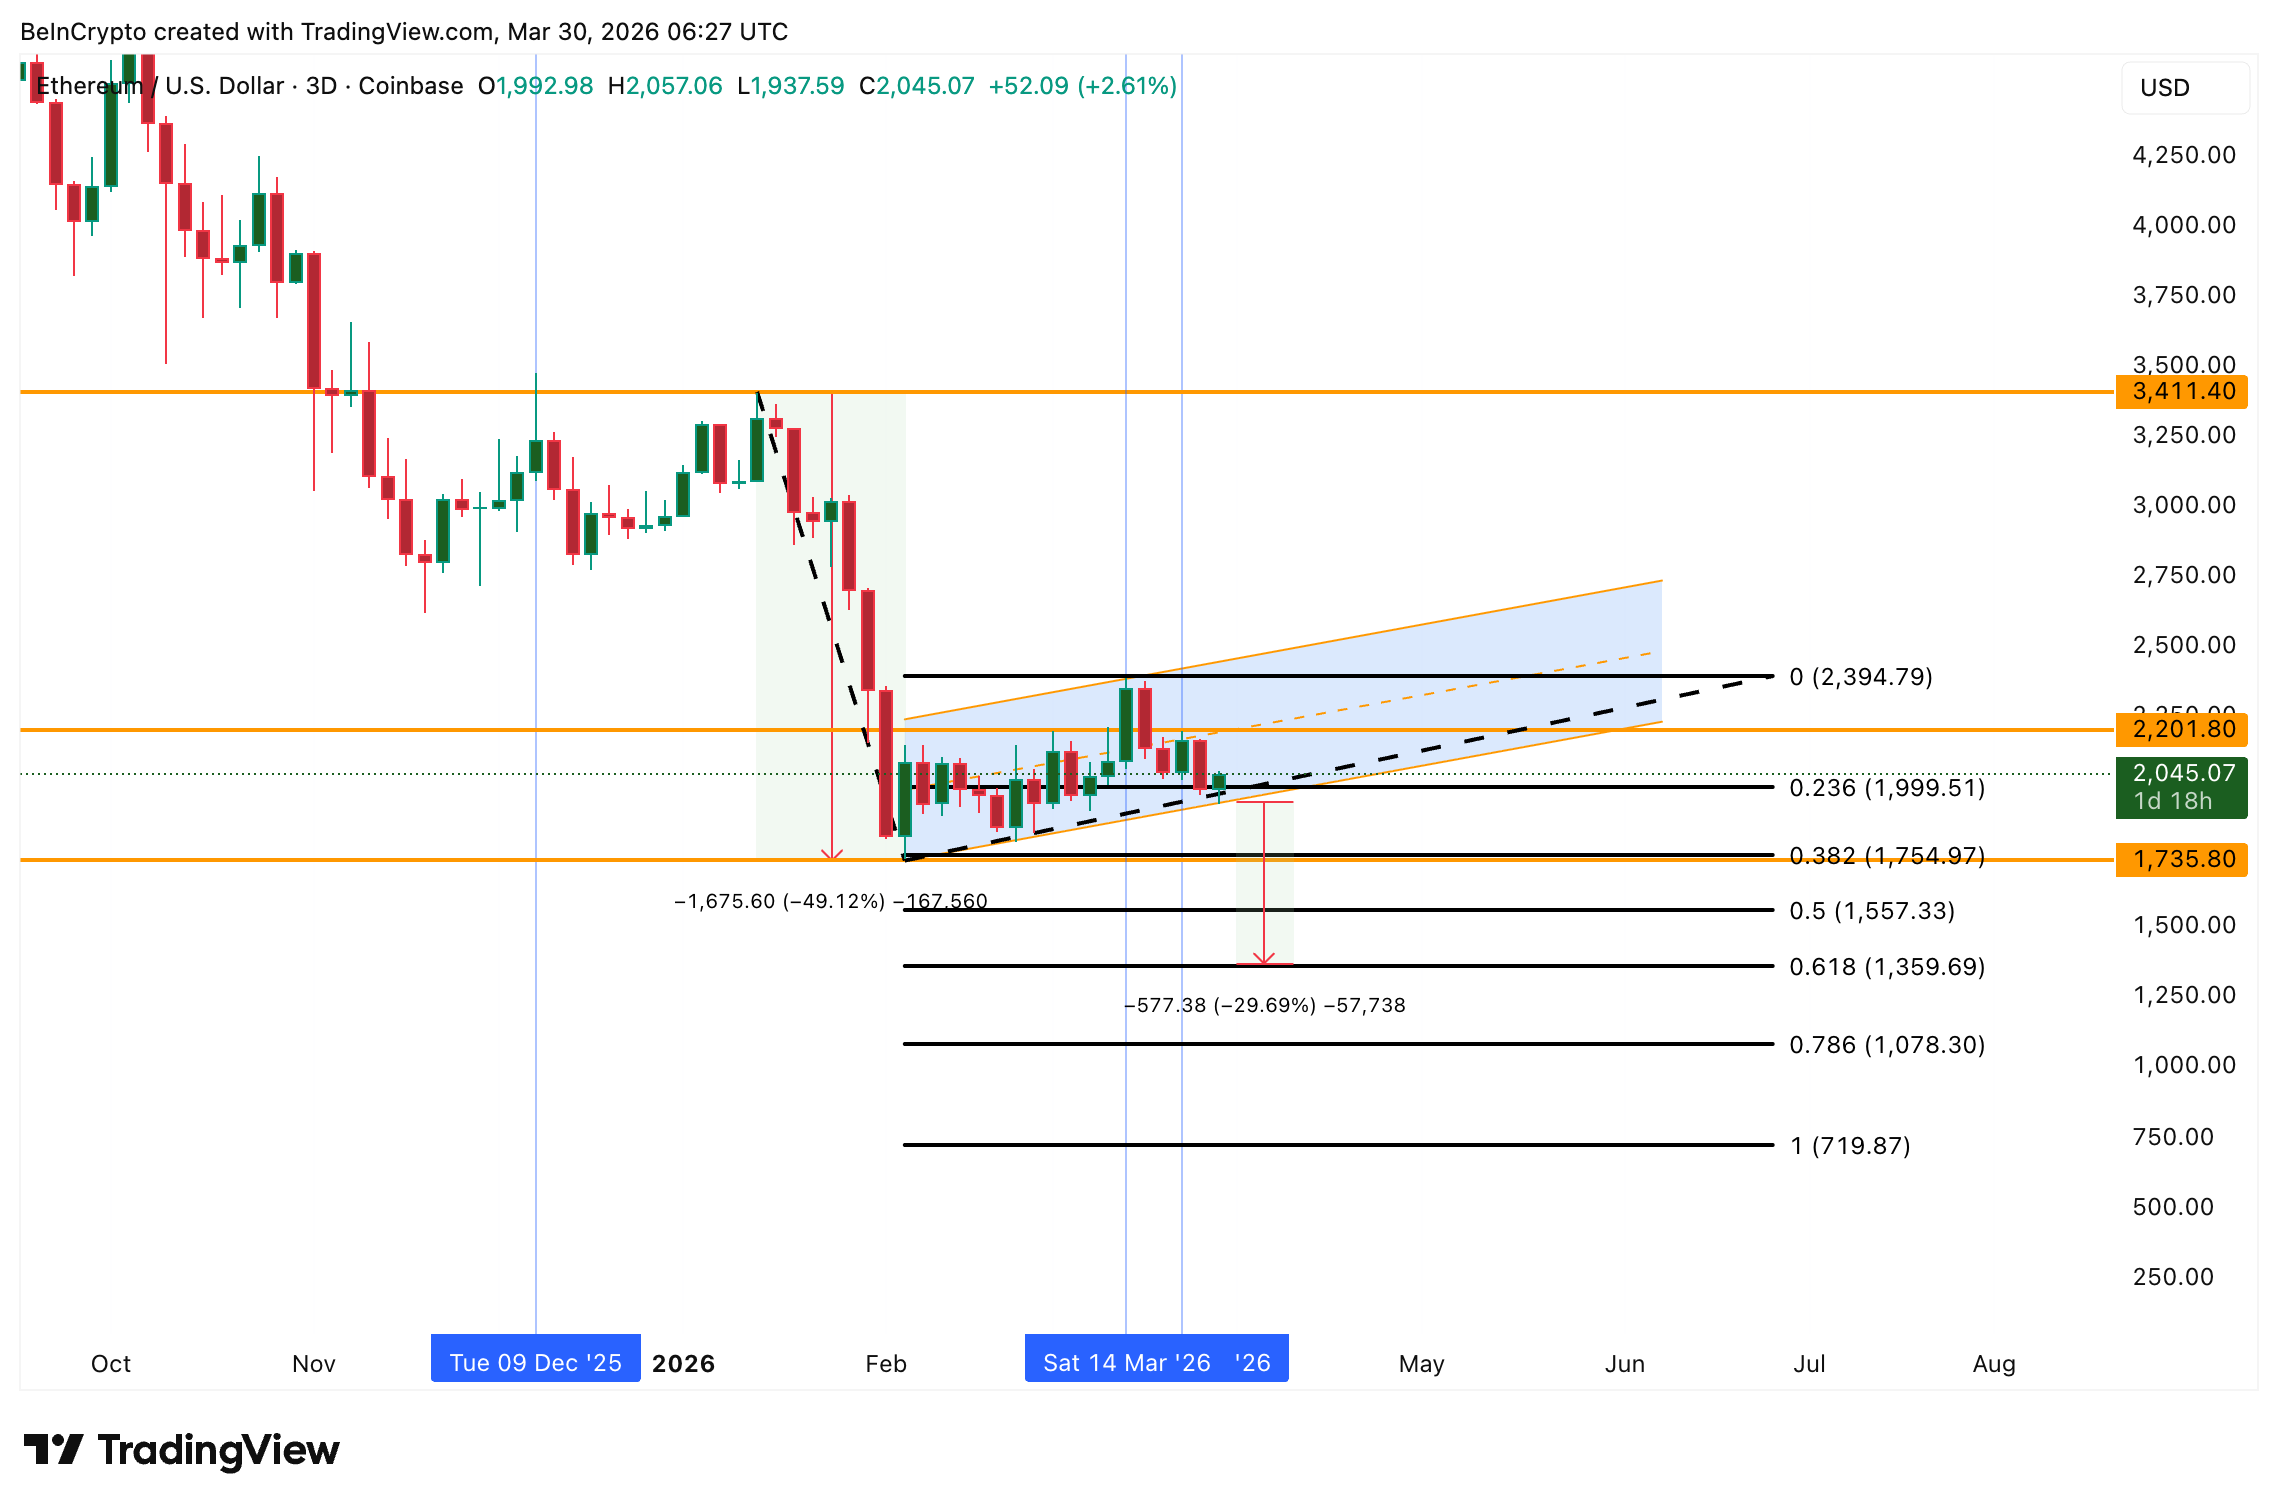 Ethereum Price Analysis: TradingView
If April follows the pattern set in February, where hodler net position change went negative and prices dropped 46%, the 0.618 Fibonacci retracement near $1,350 becomes a realistic target. That would represent a decline of roughly 30% from current levels.
A 3-day close above $2,200 keeps April constructive and aligns ETH with its historically strong seasonal pattern, while a breakdown below $2,000 risks repeating February’s 46% slide with $1,350 as the measured target.
Recommended Articles


