

3 Altcoins To Watch In The Final Week Of March 2026
Some altcoins are standing at technical and fundamental inflection points as March 2026 enters its final week. Each faces a near-term catalyst that could resolve their chart structures in one direction or the other.
Thus, BeInCrypto has analysed three such altcoins that the investors should keep an eye on as March nears its end.
Sandbox (SAND)
The Sandbox (SAND) is trading at $0.0802, up 4.2%, under a descending resistance trendline and a descending support trendline from the February lows.
Price sits above the Fibonacci 0.382 ($0.0799) and under 0.5 ($0.0829) levels, below the EMA at $0.0827, which adds overhead resistance. A break above the 0.5 Fib line would target the 0.618 Fibonacci level at $0.0858 and the 0.786 level at $0.0901.
Want more token insights like this? Sign up for Editor Harsh Notariya’s Daily Crypto Newsletter here.
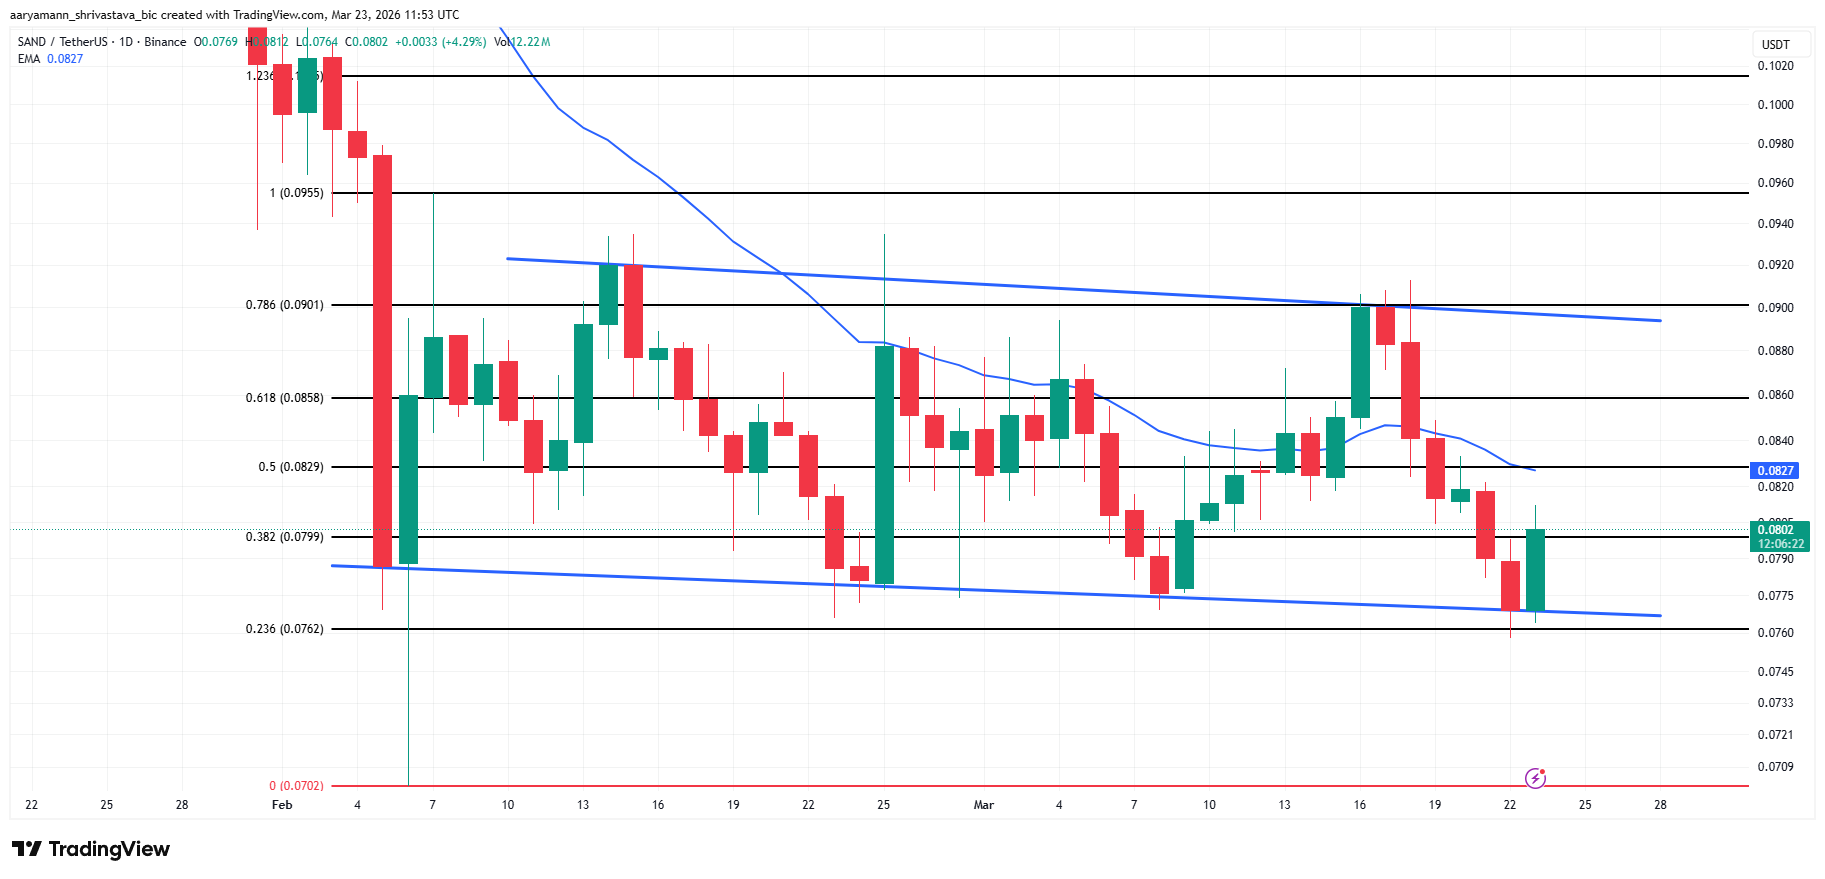 SAND Price Analysis. Source: TradingView
The timing matters. The Sandbox NEXT, a fully mobile third-person shooter built on Unreal Engine, opens its exclusive playtest on March 26. This marks the platform’s first major mobile expansion, directly addressing its user accessibility gap.
However, if the investors opt to sell their holdings, the SAND price could take a hit. The altcoin could end up losing the $0.0762 support, marked by the 23.6% Fib line. Falling through this support would invalidate the bullish thesis.
Onyxcoin (XCN)
Onyxcoin (XCN) is trading at $0.0051 on the daily chart, holding just above the 0.382 Fibonacci level at $0.0051 after a sharp 21.72% decline from its March 15 peak. The EMA has begun curling upward through the $0.0052 zone, offering dynamic support. Volume stands at 23.66M, with today’s session printing a green candle above the 0.236 level at $0.0049.
XCN’s hold above the 0.382 Fibonacci retracement at $0.0051 sets the foundation for a recovery toward the 0.618 level at $0.0054. A sustained push through that zone opens the path to the 0.786 retracement at $0.0057, where prior consolidation occurred in early February. The rising EMA providing support below the current price adds weight to the bullish structure forming on the daily timeframe.
The Goliath mainnet — Onyx’s Layer-1 blockchain for enterprise DeFi with a 25% liquid staking yield — goes live publicly on March 27. This will act as another bullish catalyst for XCN price.
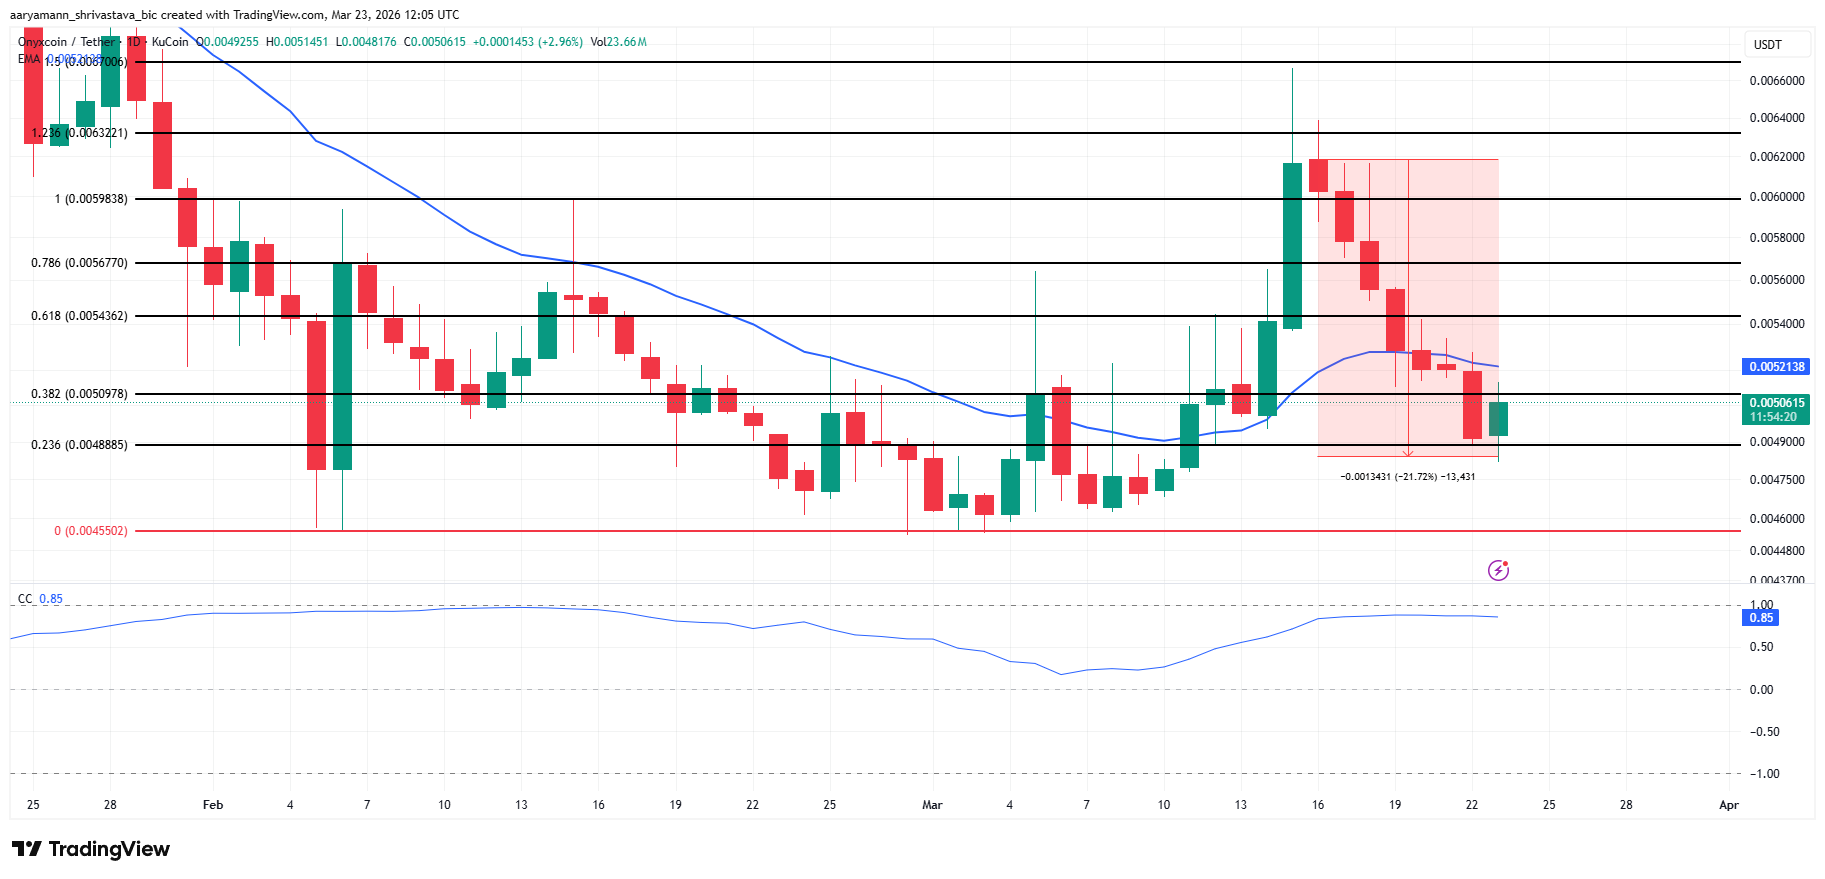 XCN Price Analysis. Source: TradingView
A daily close below the 0.236 Fibonacci level at $0.0049 invalidates the bullish thesis and exposes XCN to the Fibonacci zero baseline at $0.0045, marked by the red horizontal line. That level represents the full retracement of the February-to-March rally. Bulls must defend $0.0049 on a closing basis to keep the recovery structure intact.
Worldcoin (WLD)
Worldcoin (WLD) is trading at $0.3143, down 0.45%, having just completed the first 23.14% measured move from the March 16 high of $0.3990. A second measured move of -13.95% now projects a target of $0.2640 — the current all-time low.
The CMF reads -0.32, the deepest negative reading visible in the entire chart period. Capital is flowing out of WLD at its fastest pace since listing on this timeframe, and selling has been relentless across every session since March 16 without a single meaningful relief bounce.
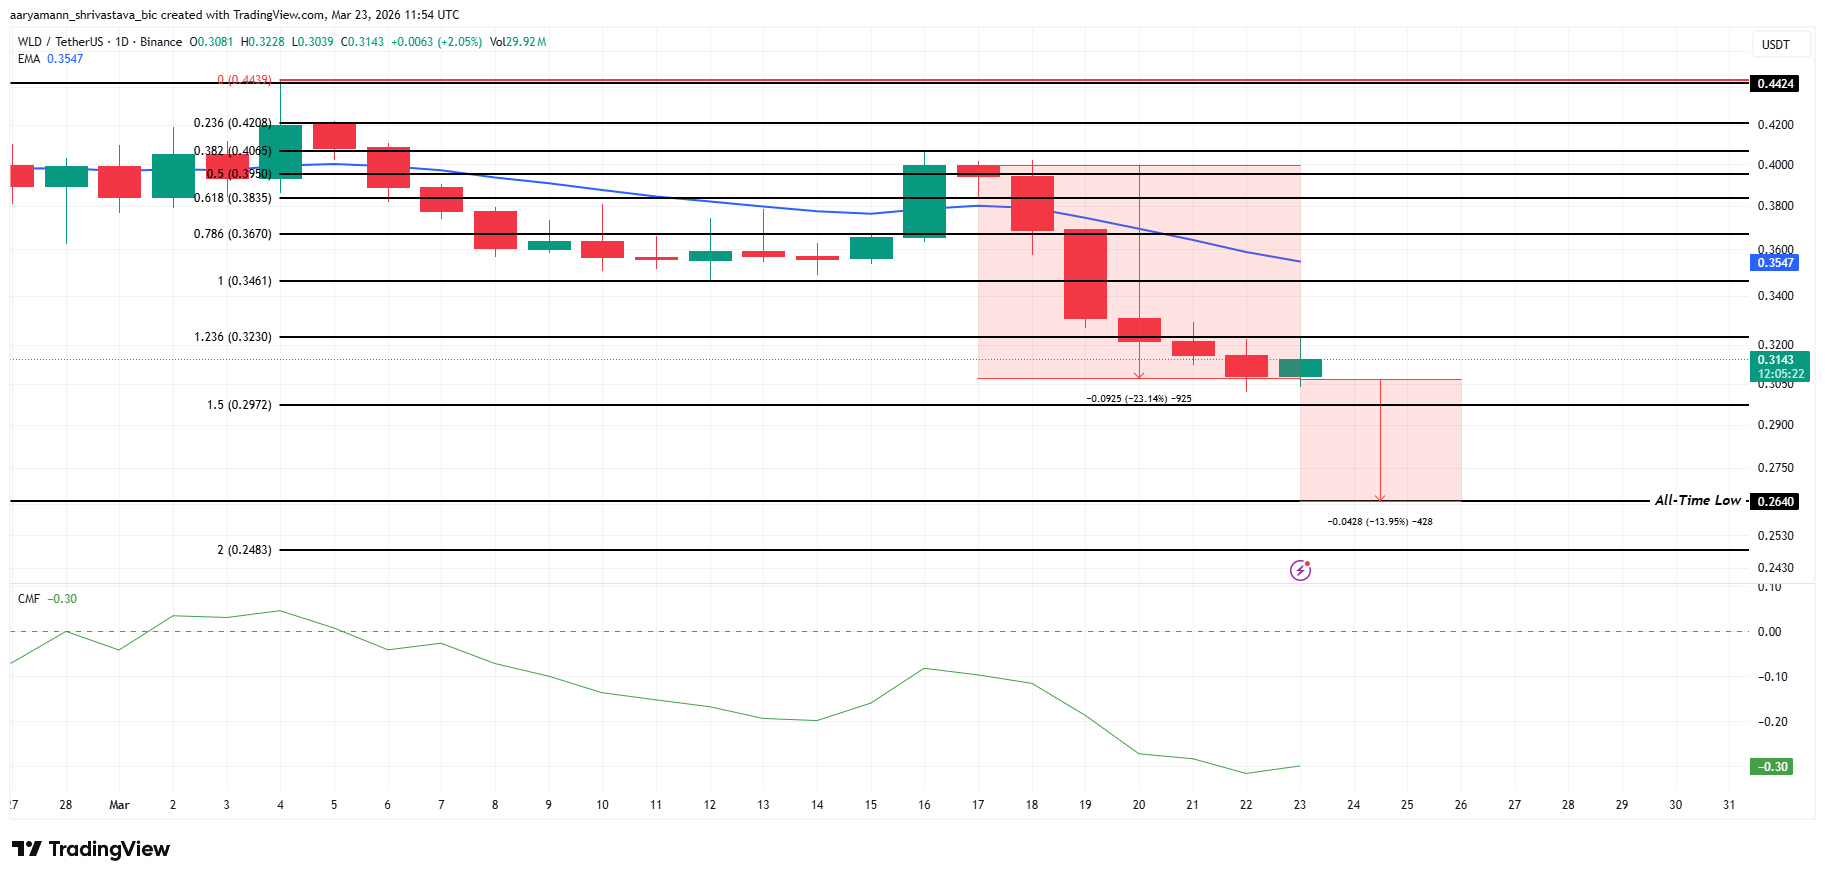 WLD Price Analysis. Source: TradingView
The all-time low at $0.2640 is now the dominant technical target. A sustained daily close below $0.2972 would confirm that the second leg of the measured move is active. This 1.5 Fibonacci level offers the last buffer before the all-time low.
However, if the investors hold off on selling and the broader market conditions exhibit improvement. As a result, WLD price could bounce back. Reclaiming $3230 as support would enable a rise towards $0.3640 resistance, breaching which will invalidate the bearish thesis.
Recommended Articles


