

Top Crypto Gainers: DeXe, Chiliz, and LayerZero sustain gains despite oil prices weighing on Bitcoin
- DeXe rises nearly 9% on Monday after a 7% surge above the 100-day EMA on Sunday.
- Chiliz extends gains on Monday after a 5% rise the previous day.
- LayerZero hovers near $2.00 as buying pressure persists.
DeXe (DEXE), Chiliz (CHZ), and LayerZero (ZRO) are the top-performing cryptos over the last 24 hours. Technically, the altcoins remain at risk as the broader market remains under pressure from the US-Iran war.
Bitcoin (BTC) hovers around $66,000 at press time on Monday after four consecutive days of losses. Rising oil prices amid the Strait of Hormuz shutdown and rising tensions in the Middle East are weighing on BTC, threatening the $60,000 base formed earlier in February.
Oil prices cross above $100, weighing down Bitcoin
US Crude Oil is trading around $113 at early Asian hours on Monday, its highest since July 2022, driven by the rising geopolitical tensions in the Middle East. Disruptions to oil transportation lead to a physical supply shock in major Asian countries. High oil prices risk increased inflation and could threaten quantitative tightening, which almost certainly fuels downside pressure on risk assets such as Bitcoin.
Bitcoin is trading around $66,000 at press time on Monday, retracing from the $66,700 high earlier today, indicating ongoing downside pressure. This increases the risk of extending the four consecutive days of losses recorded by BTC after the 50-day Exponential Moving Average (EMA) capped last week’s recovery around $73,000.
The path of least resistance for Bitcoin targets the $62,500 base from February as the immediate support level. A decisive close below this could target the 1.272 trend-based Fibonacci level at $55,360, measured between the October 6 high of $126,199, November 21 low of $80,600, and the January 14 high of $97,924.
The Relative Strength Index (RSI) at 43 dips below the midline amid Bitcoin’s four-day decline, indicating a gradual increase in selling pressure. The Moving Average Convergence Divergence (MACD) flattens slightly below the zero line, risking a bearish crossover with the signal line, while the MACD histogram contracts, suggesting a reduction in bullish momentum.
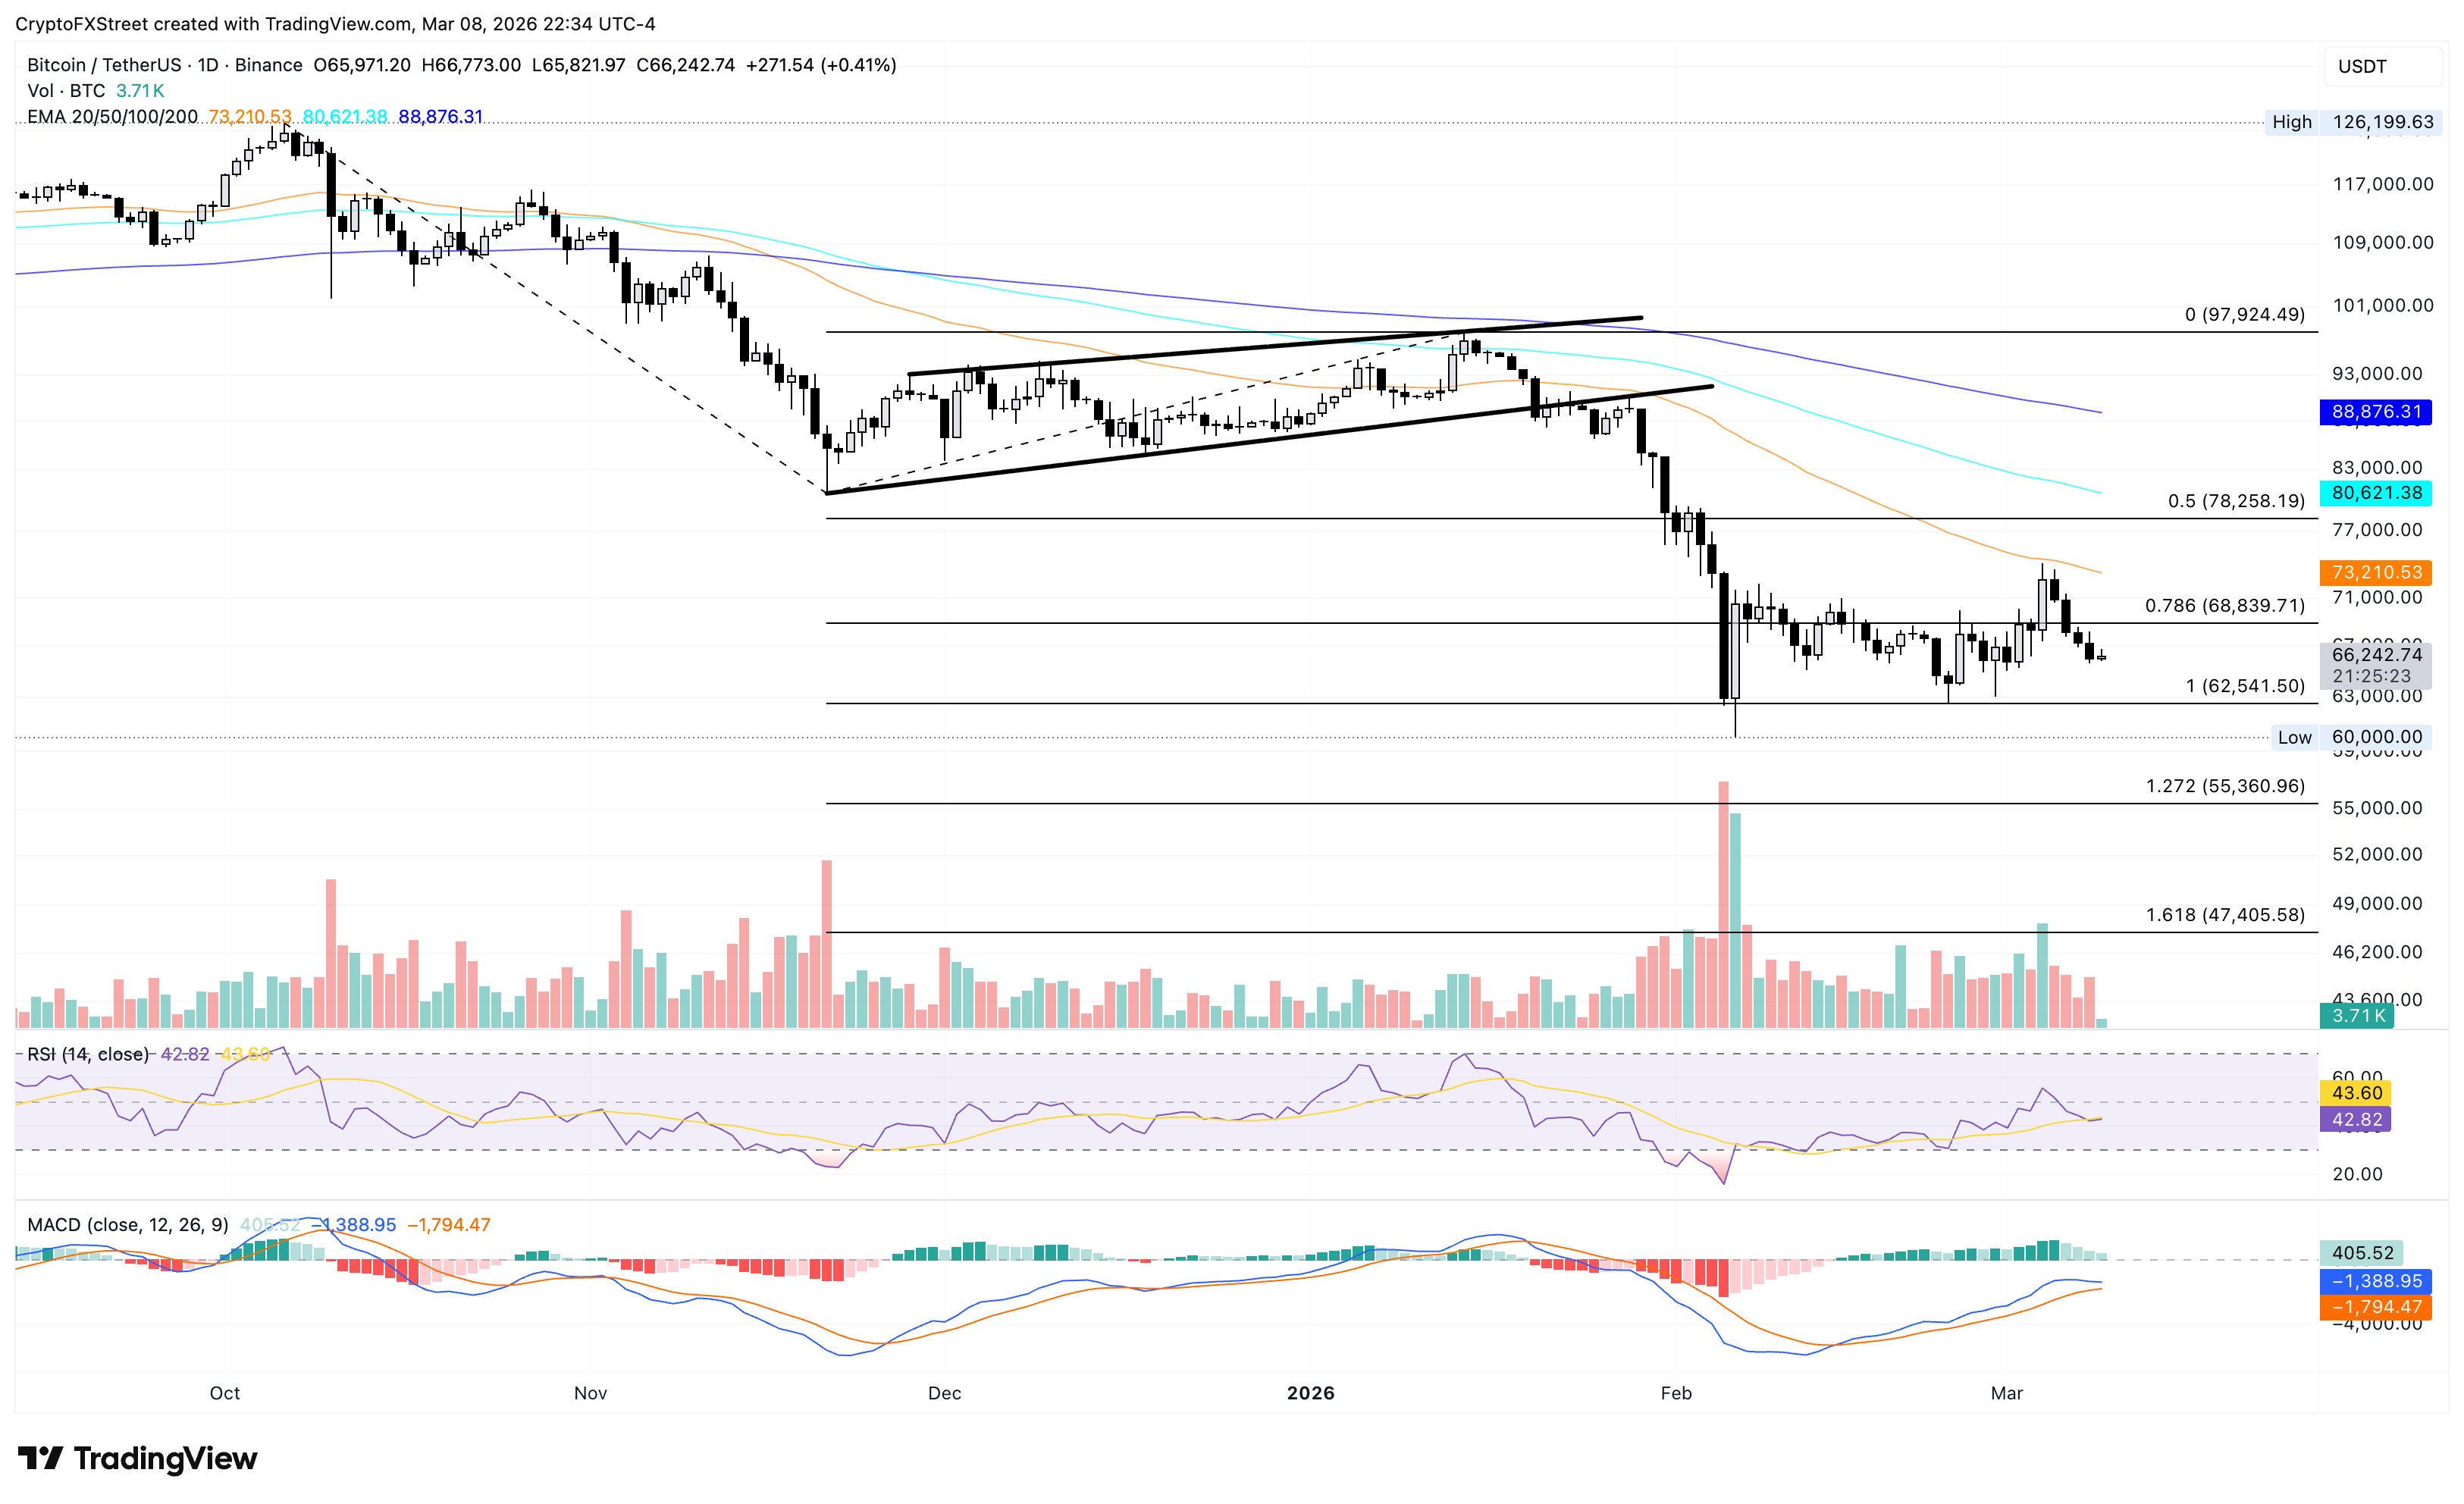
On the upside, Bitcoin should exceed 78.6% trend-based Fibonacci retracement level at $68,839 and the 50-day EMA at $73,220 for a sustained recovery.
DeXe rally crosses above $4 with no hints of slowing down
DeXe is trading above $4 at press time on Monday, extending intraday gains by nearly 9% after Sunday’s 7% recovery. The near-term bias is bullish as DEXE extends well above the 100-day EMA at around $3.59, keeping short-term trend dynamics aligned with the prior advance, as measured by the Fibonacci structure from 1.7260 to 4.2870.
The 200-day EMA near $5.02 still lags above the spot, suggesting the broader backdrop is transitioning away from the earlier downtrend. Momentum remains positive, with the MACD line above its signal and both above the zero line, while a positive and mildly widening histogram signals strengthening upside pressure. The RSI at 73 stays in overbought territory, indicating bulls control the tape, though the risk of a cooling phase increases at these elevated readings.
If DEXE holds a daily close above $4.28, the 200-day EMA at $5.02 and the 1.272 Fibonacci extension level at $5.49, measured from the December 4 high at $4.28 to the February 6 low at $1.72, remain crucial resistance levels.
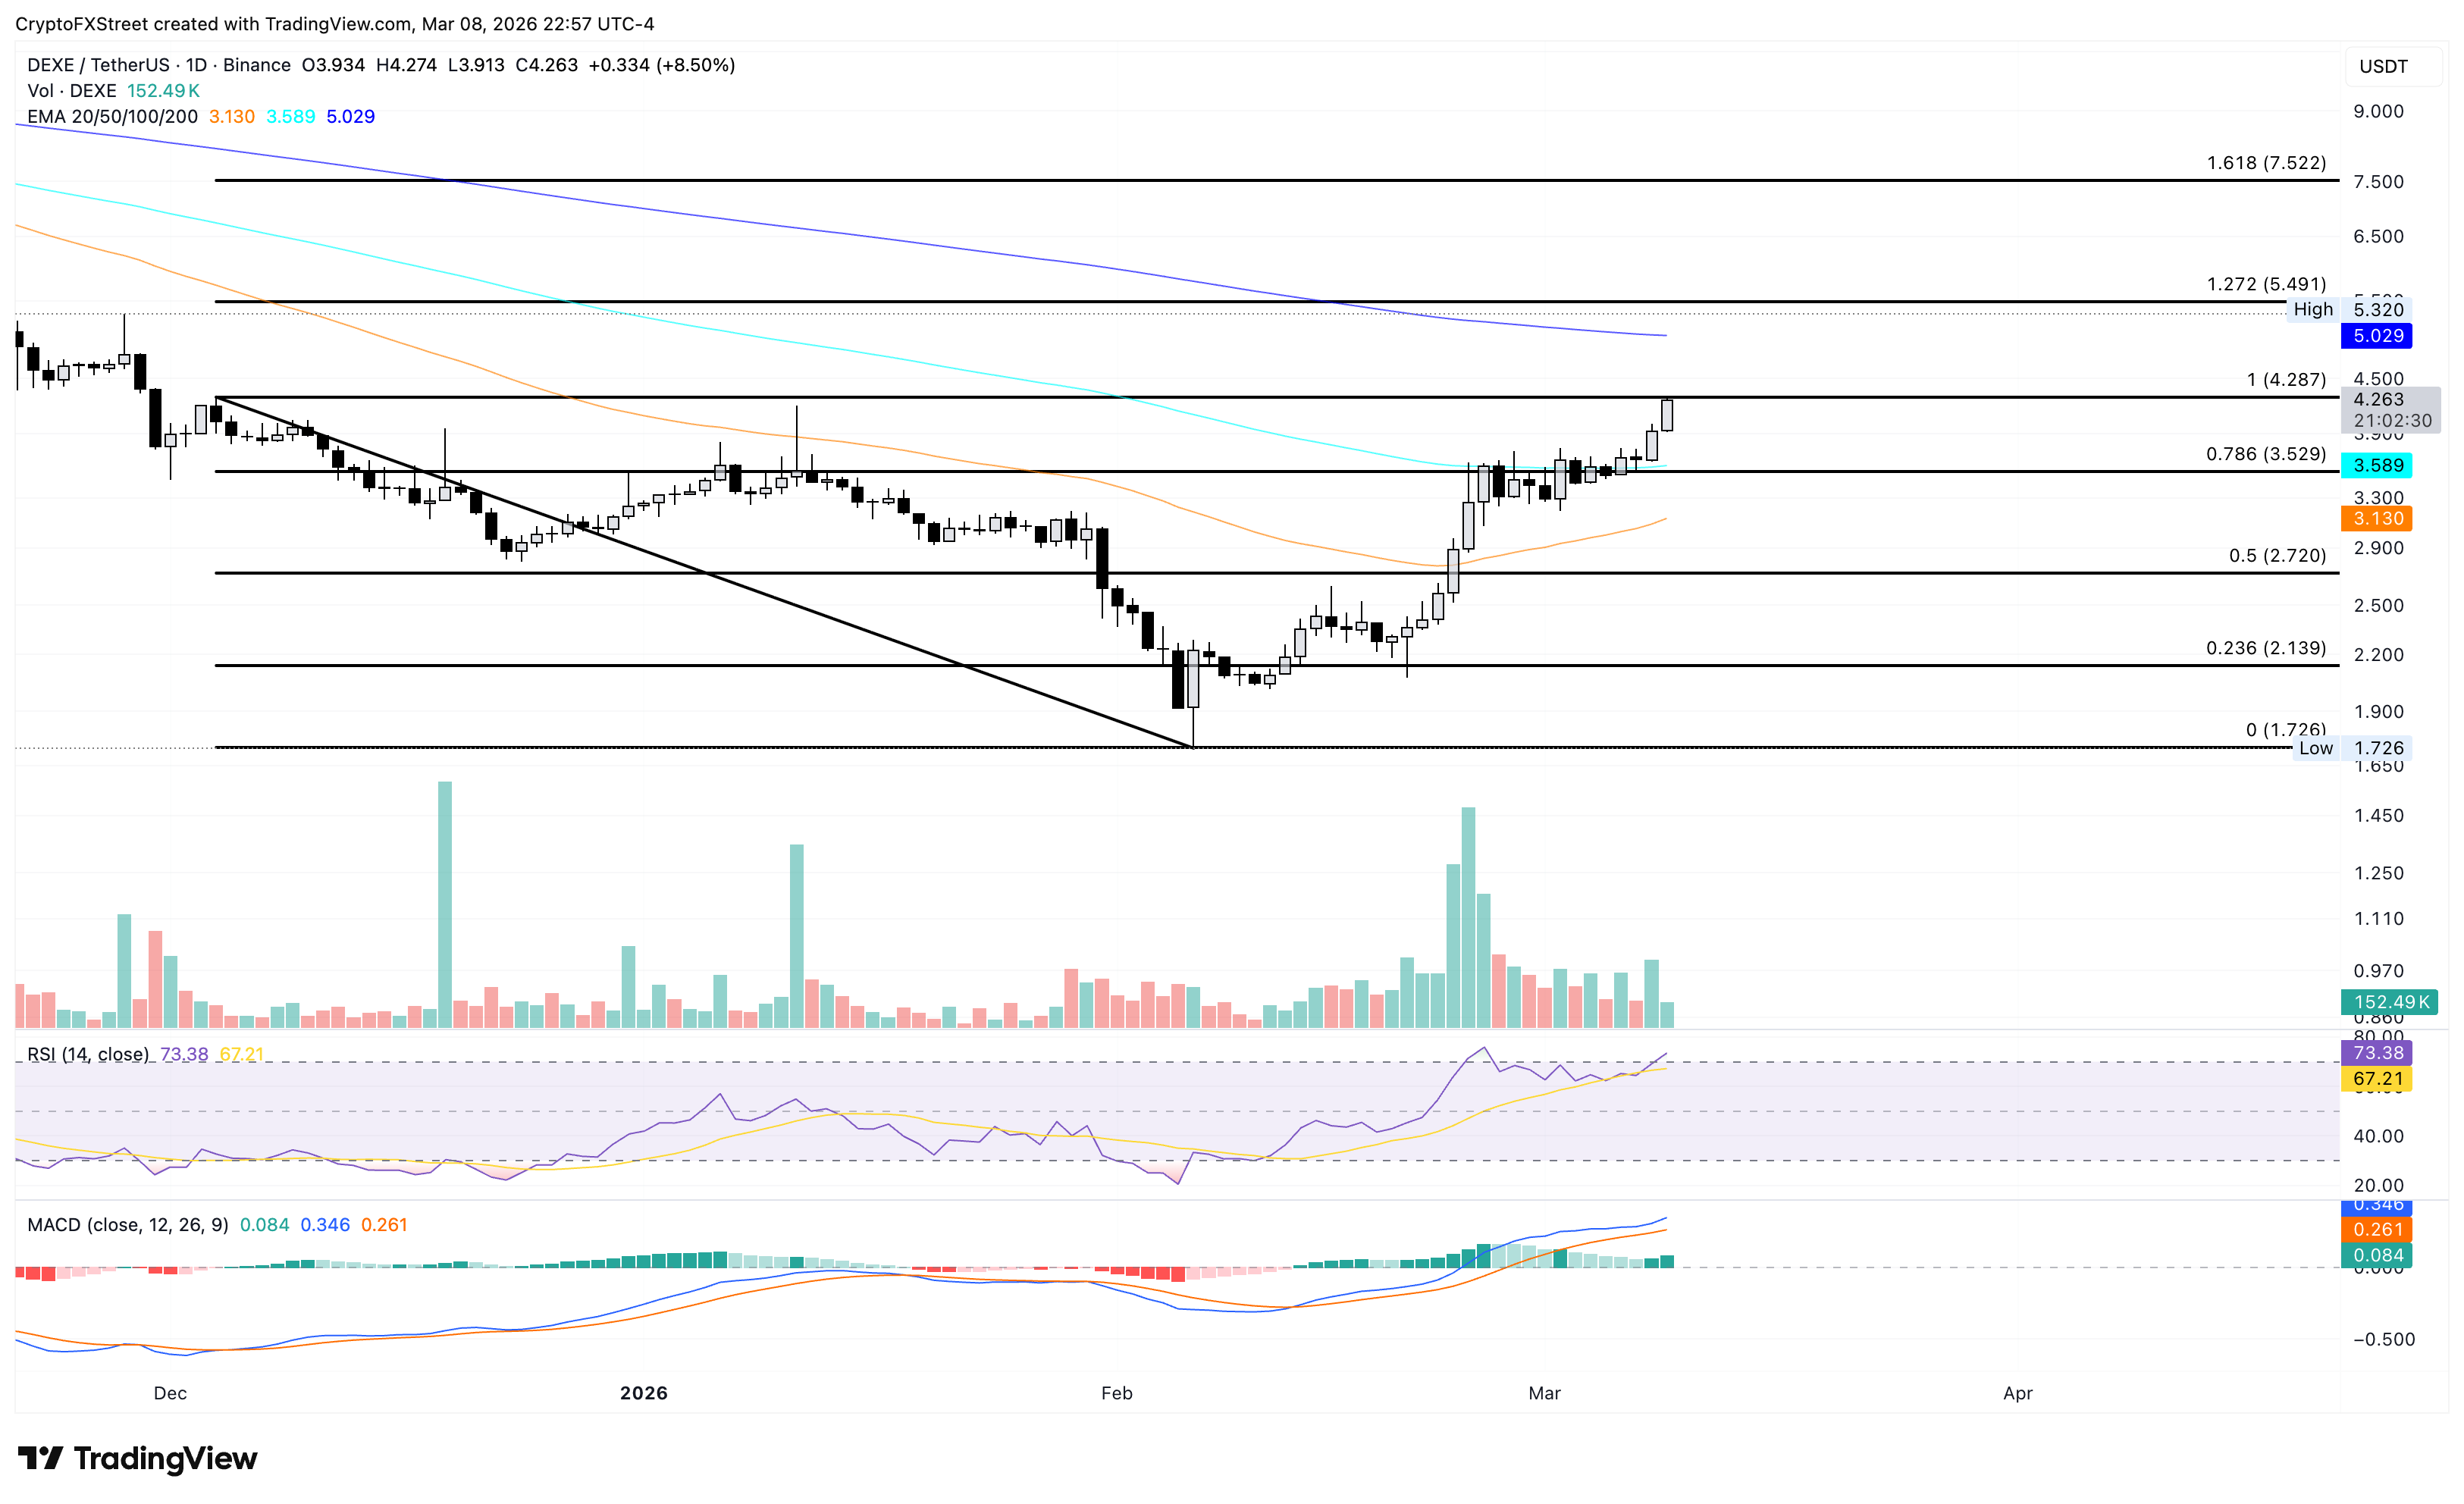
On the downside, the immediate support lies at the 100-day EMA at $3.59, near the 78.6% Fibonacci retracement at $3.52.
Chiliz holds steady recovery as buying pressure returns
Chiliz is up 3% at the time of writing on Monday, building on the 5% rise from the previous day. The near-term bias is neutral with a mild downside tilt as the 50-, 100-, and 200-day EMAs are clustered in a declining trend above the spot price.
The MACD remains marginally positive above the signal line, suggesting modest bullish momentum, while the RSI at 49 remains neutral, signaling a lack of directional conviction.
For a sustained upward trend, CHZ should surpass the 50% retracement level at $0.04136, measured from the November 5 low of $0.02659 to the January 17 high of $0.06424. This could open the door toward the 23.6% Fibonacci retracement level at $0.05223.

The crucial support for CHZ remains at the 78.6% Fibonacci retracement level at $0.03213. If CHZ slips below this level, it would nullify the rebound chances and risk a further decline to $0.02659.
LayerZero eyes recovery above $2 amid Golden Cross chances
LayerZero is trading above $2.00 with 3% intraday gains at press time on Monday, extending its recovery for the third consecutive day. If ZRO clears $2.057, it could extend its rally to $2.599, which capped gains on February 11.
The ZRO price trades above the 200-day EMA while the rising 50-day EMA approaches it for a potential crossover. This Golden Cross pattern would trigger a buy signal for price-action traders, as it indicates an increase in short-term bullish activity outpacing the prevailing trend.
The MACD holds above its signal with a modestly positive histogram, while the RSI remains at 60, suggesting steady upside momentum.
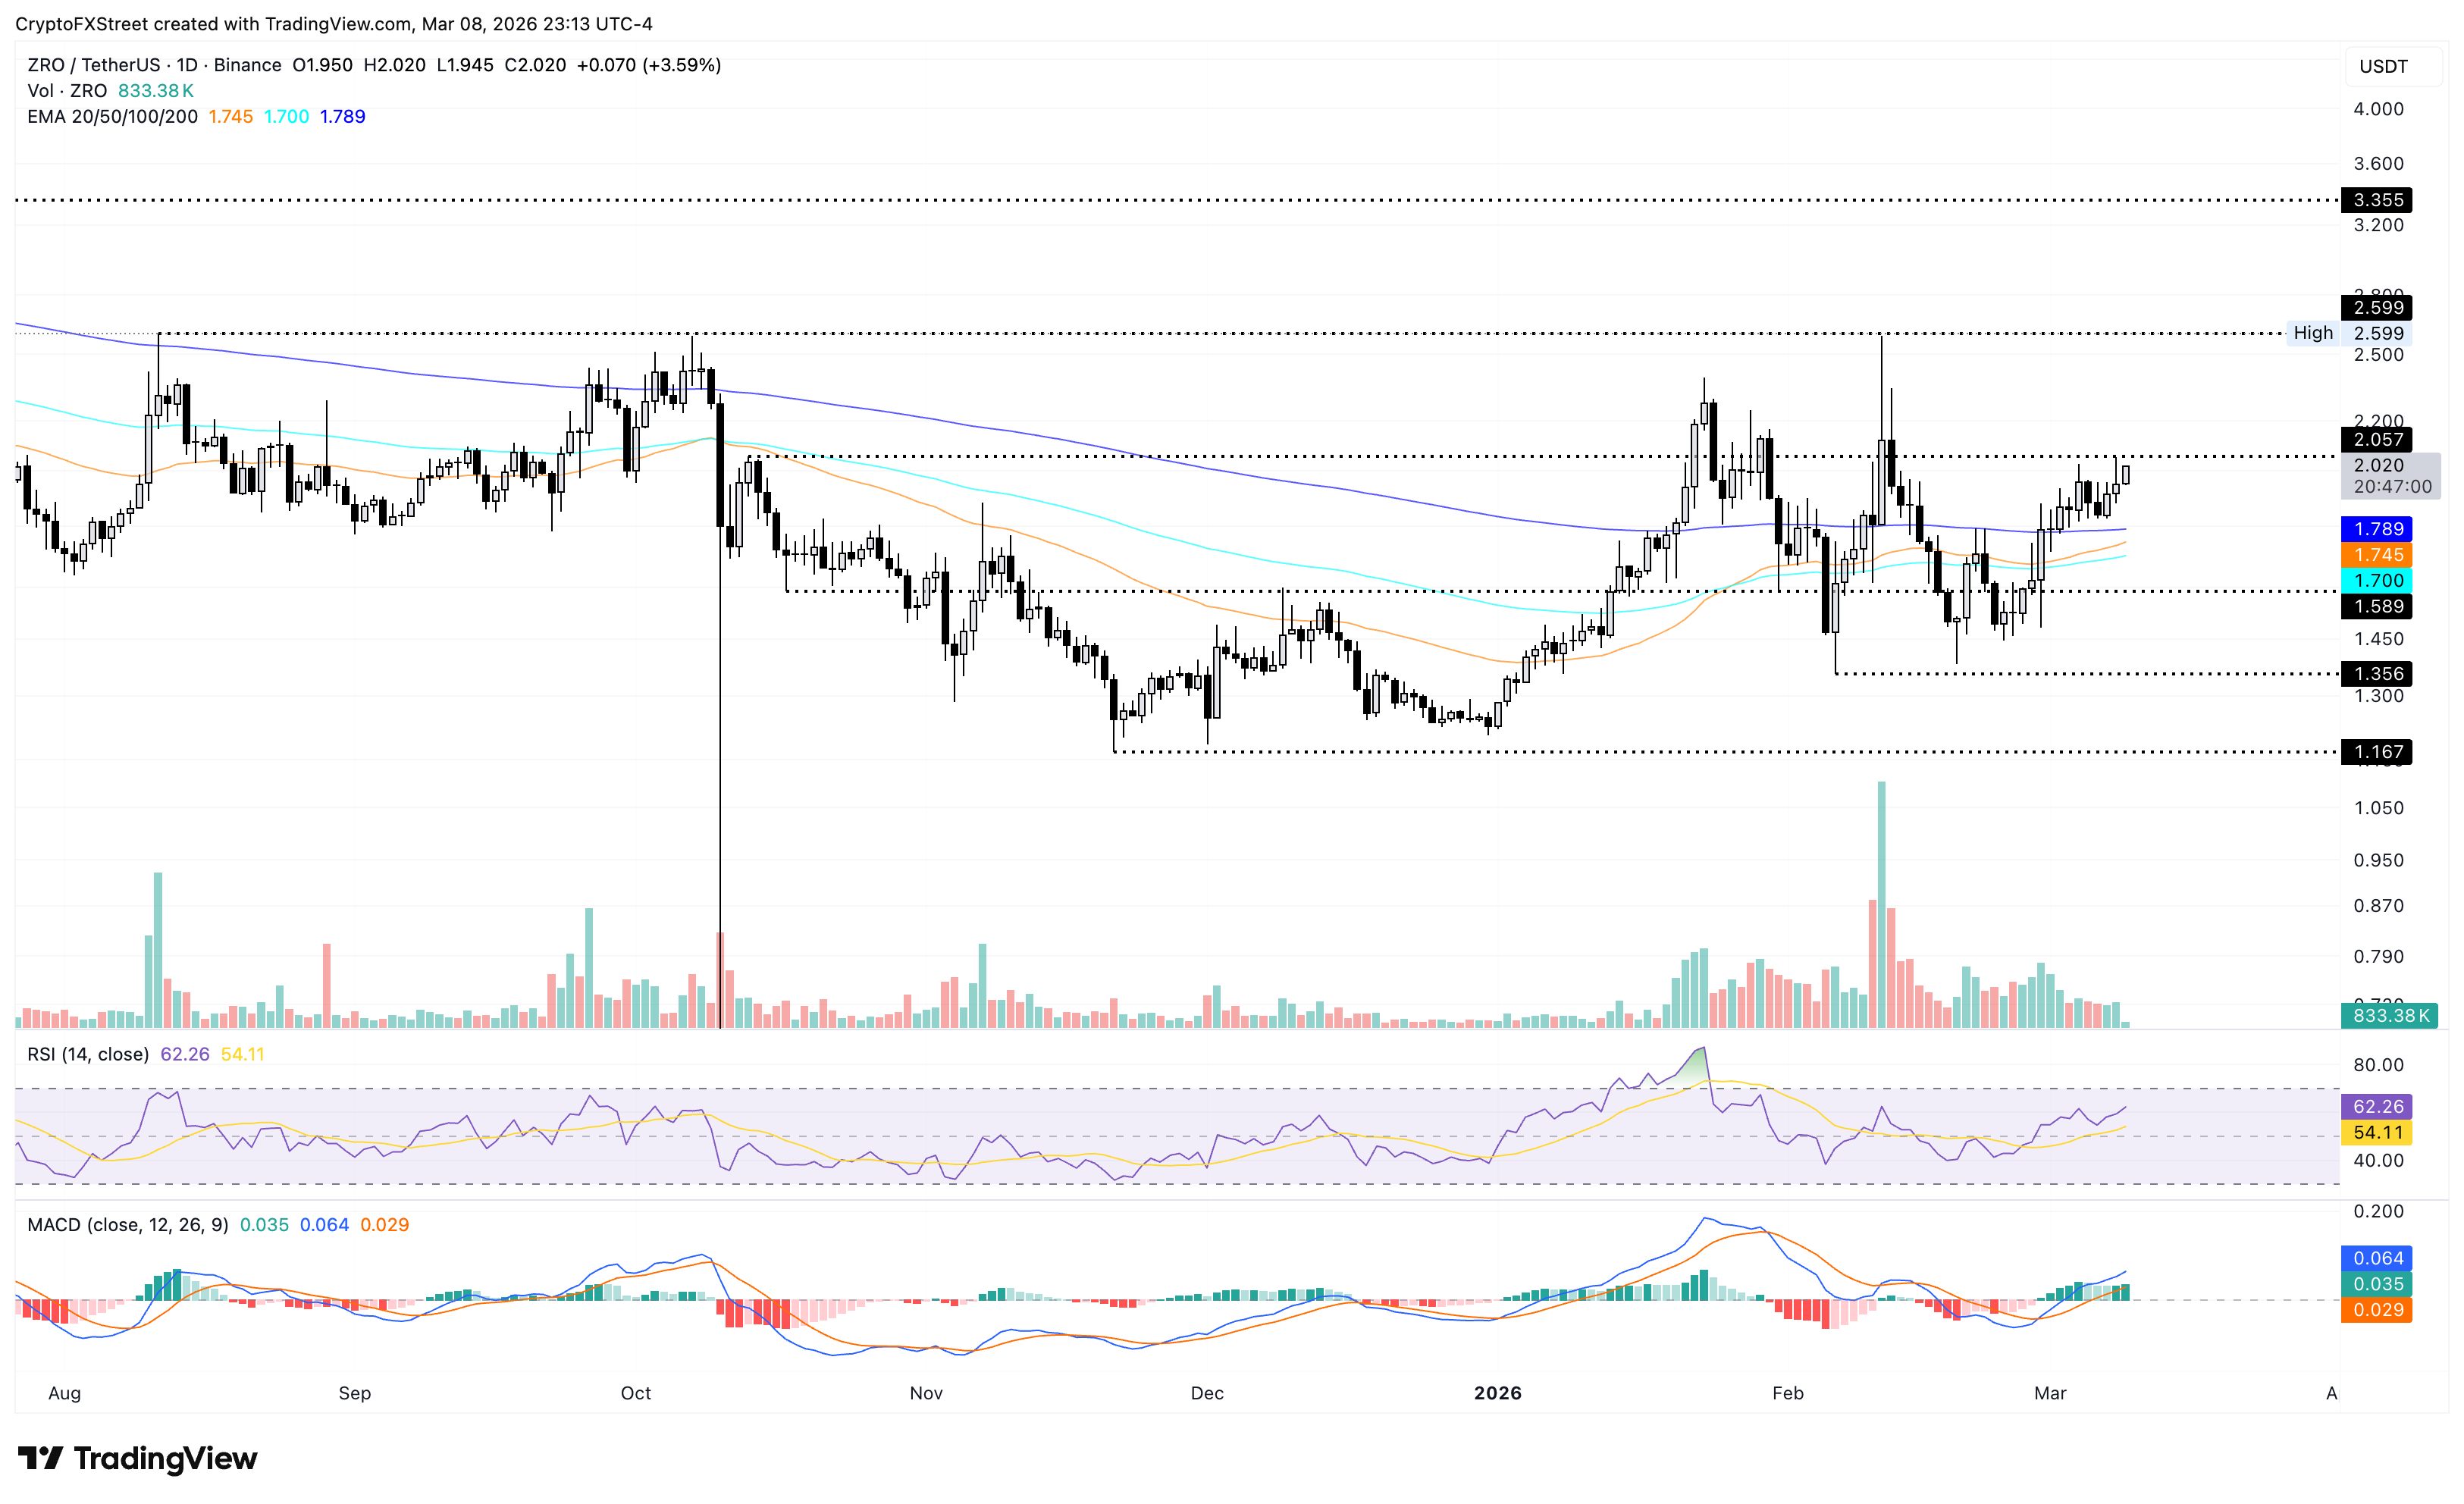
The crucial support for ZRO remains the 200-day EMA at $1.789, followed by the 100- and 50-day EMAs at $1.745 and $1.700, respectively.
(The technical analysis of this story was written with the help of an AI tool.)
Recommended Articles


