

Tom Lee’s BitMine Adds 35,000 ETH, But BMNR Stock Breaks Down
Tom Lee’s BitMine Immersion Technologies just bought another 35,000 ETH, expanding its already massive Ethereum treasury. Normally, such aggressive accumulation would signal confidence and support the stock price. Instead, the BitMine stock price fell nearly 2% in the past 24 hours and is now down more than 8% since February 13.
This creates a strange contradiction. BitMine keeps buying Ethereum, yet its stock keeps falling. At first glance, it looks like two different stories. But underneath, it might all be the same.
BitMine Adds More Ethereum, But the Stock Breaks Down
BitMine’s latest Ethereum purchase reinforces its strategy of becoming one of the largest ETH treasury companies. Buying 35,000 ETH, in two batches, in a single day, shows long-term conviction. The purchase pushed its total holdings to 4.371 million ETH, with combined cash and crypto reserves now worth around $9.6 billion.
Want more insights like this? Sign up for Editor Harsh Notariya’s Daily Crypto Newsletter here.
Companies usually increase holdings when they expect higher future prices, not lower ones. However, the stock price reaction tells a very different story. Since February 13, BitMine stock has dropped over 8%, and the technical chart now shows a breakdown.
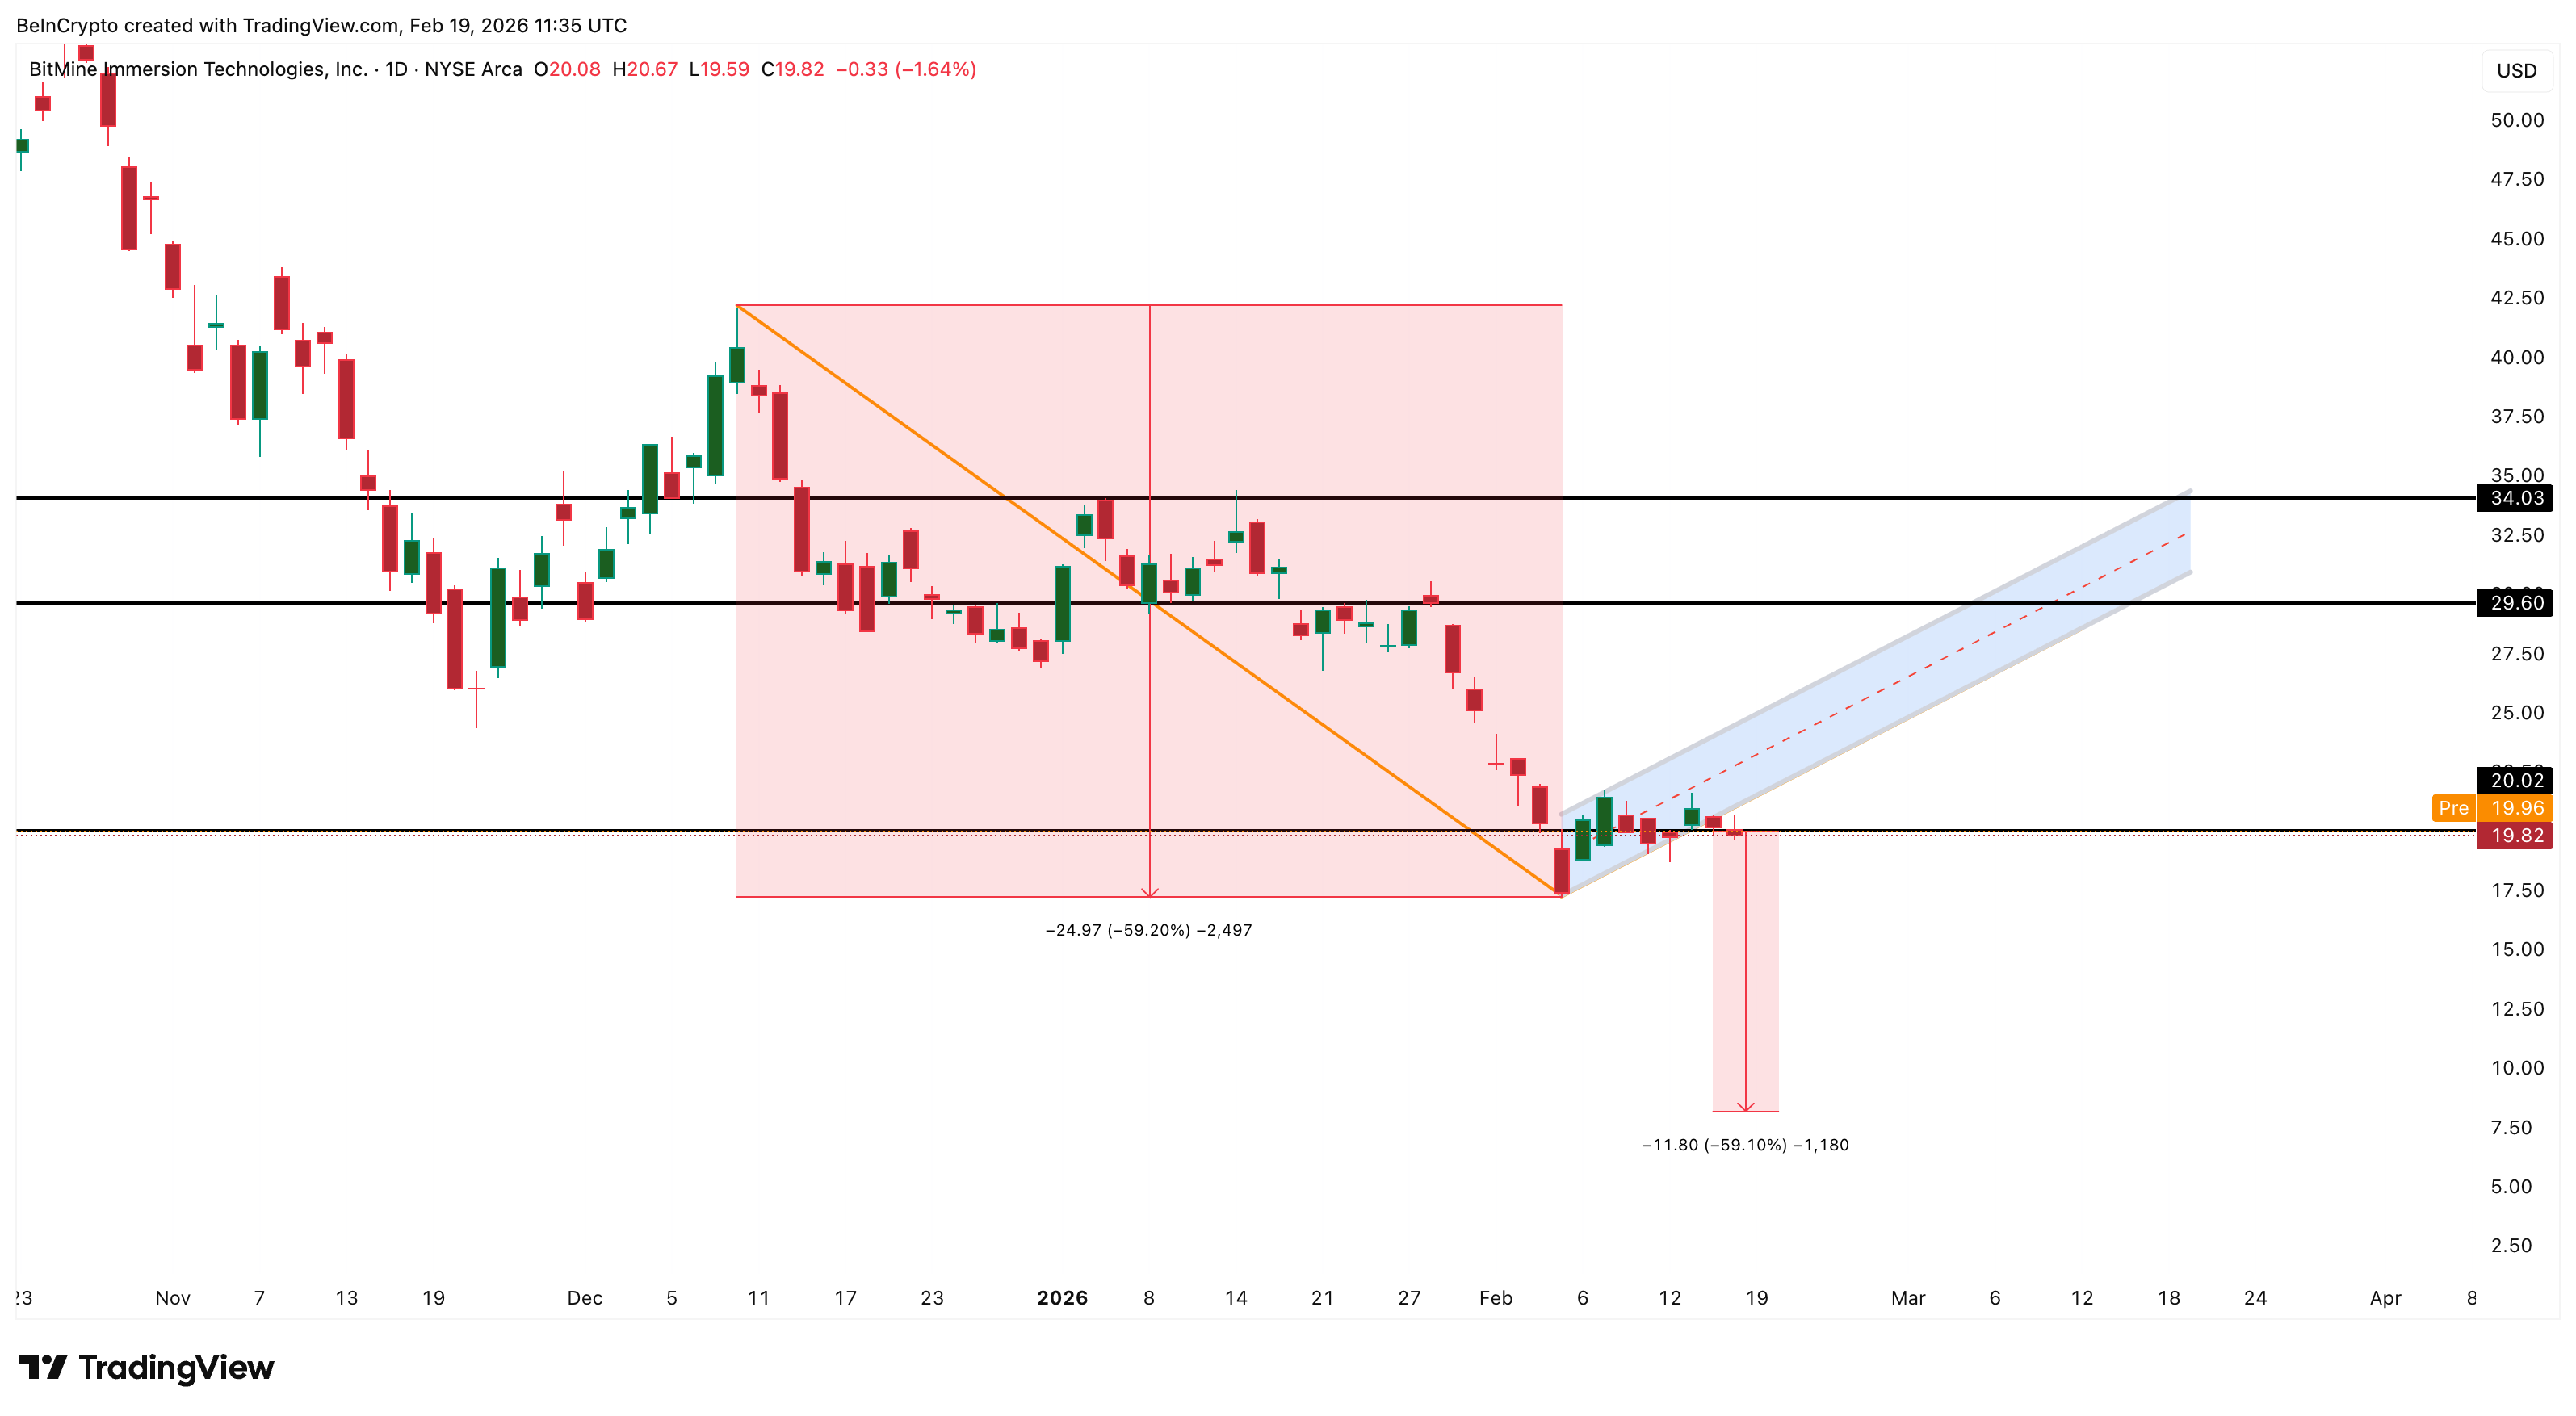
The stock recently fell below the lower boundary of a bear flag pattern. A bear flag forms after a sharp drop, followed by a weak recovery.
 BitMine Stock Price And A Bearish Pattern: TradingView
When the lower support breaks, it often signals that the prior recovery structure has weakened and the stock has entered a technically fragile zone. Based on the pattern structure, the ongoing breakdown path could extend by over 50% if the weakness persists. However, this price decline does not automatically confirm active investor selling, which we will see in the next section.
This creates a disconnect between BitMine’s strengthening treasury position and its weakening stock price, suggesting that other external factors may be influencing the move.
Retail Buying Improves, But Big Money Remains Cautious
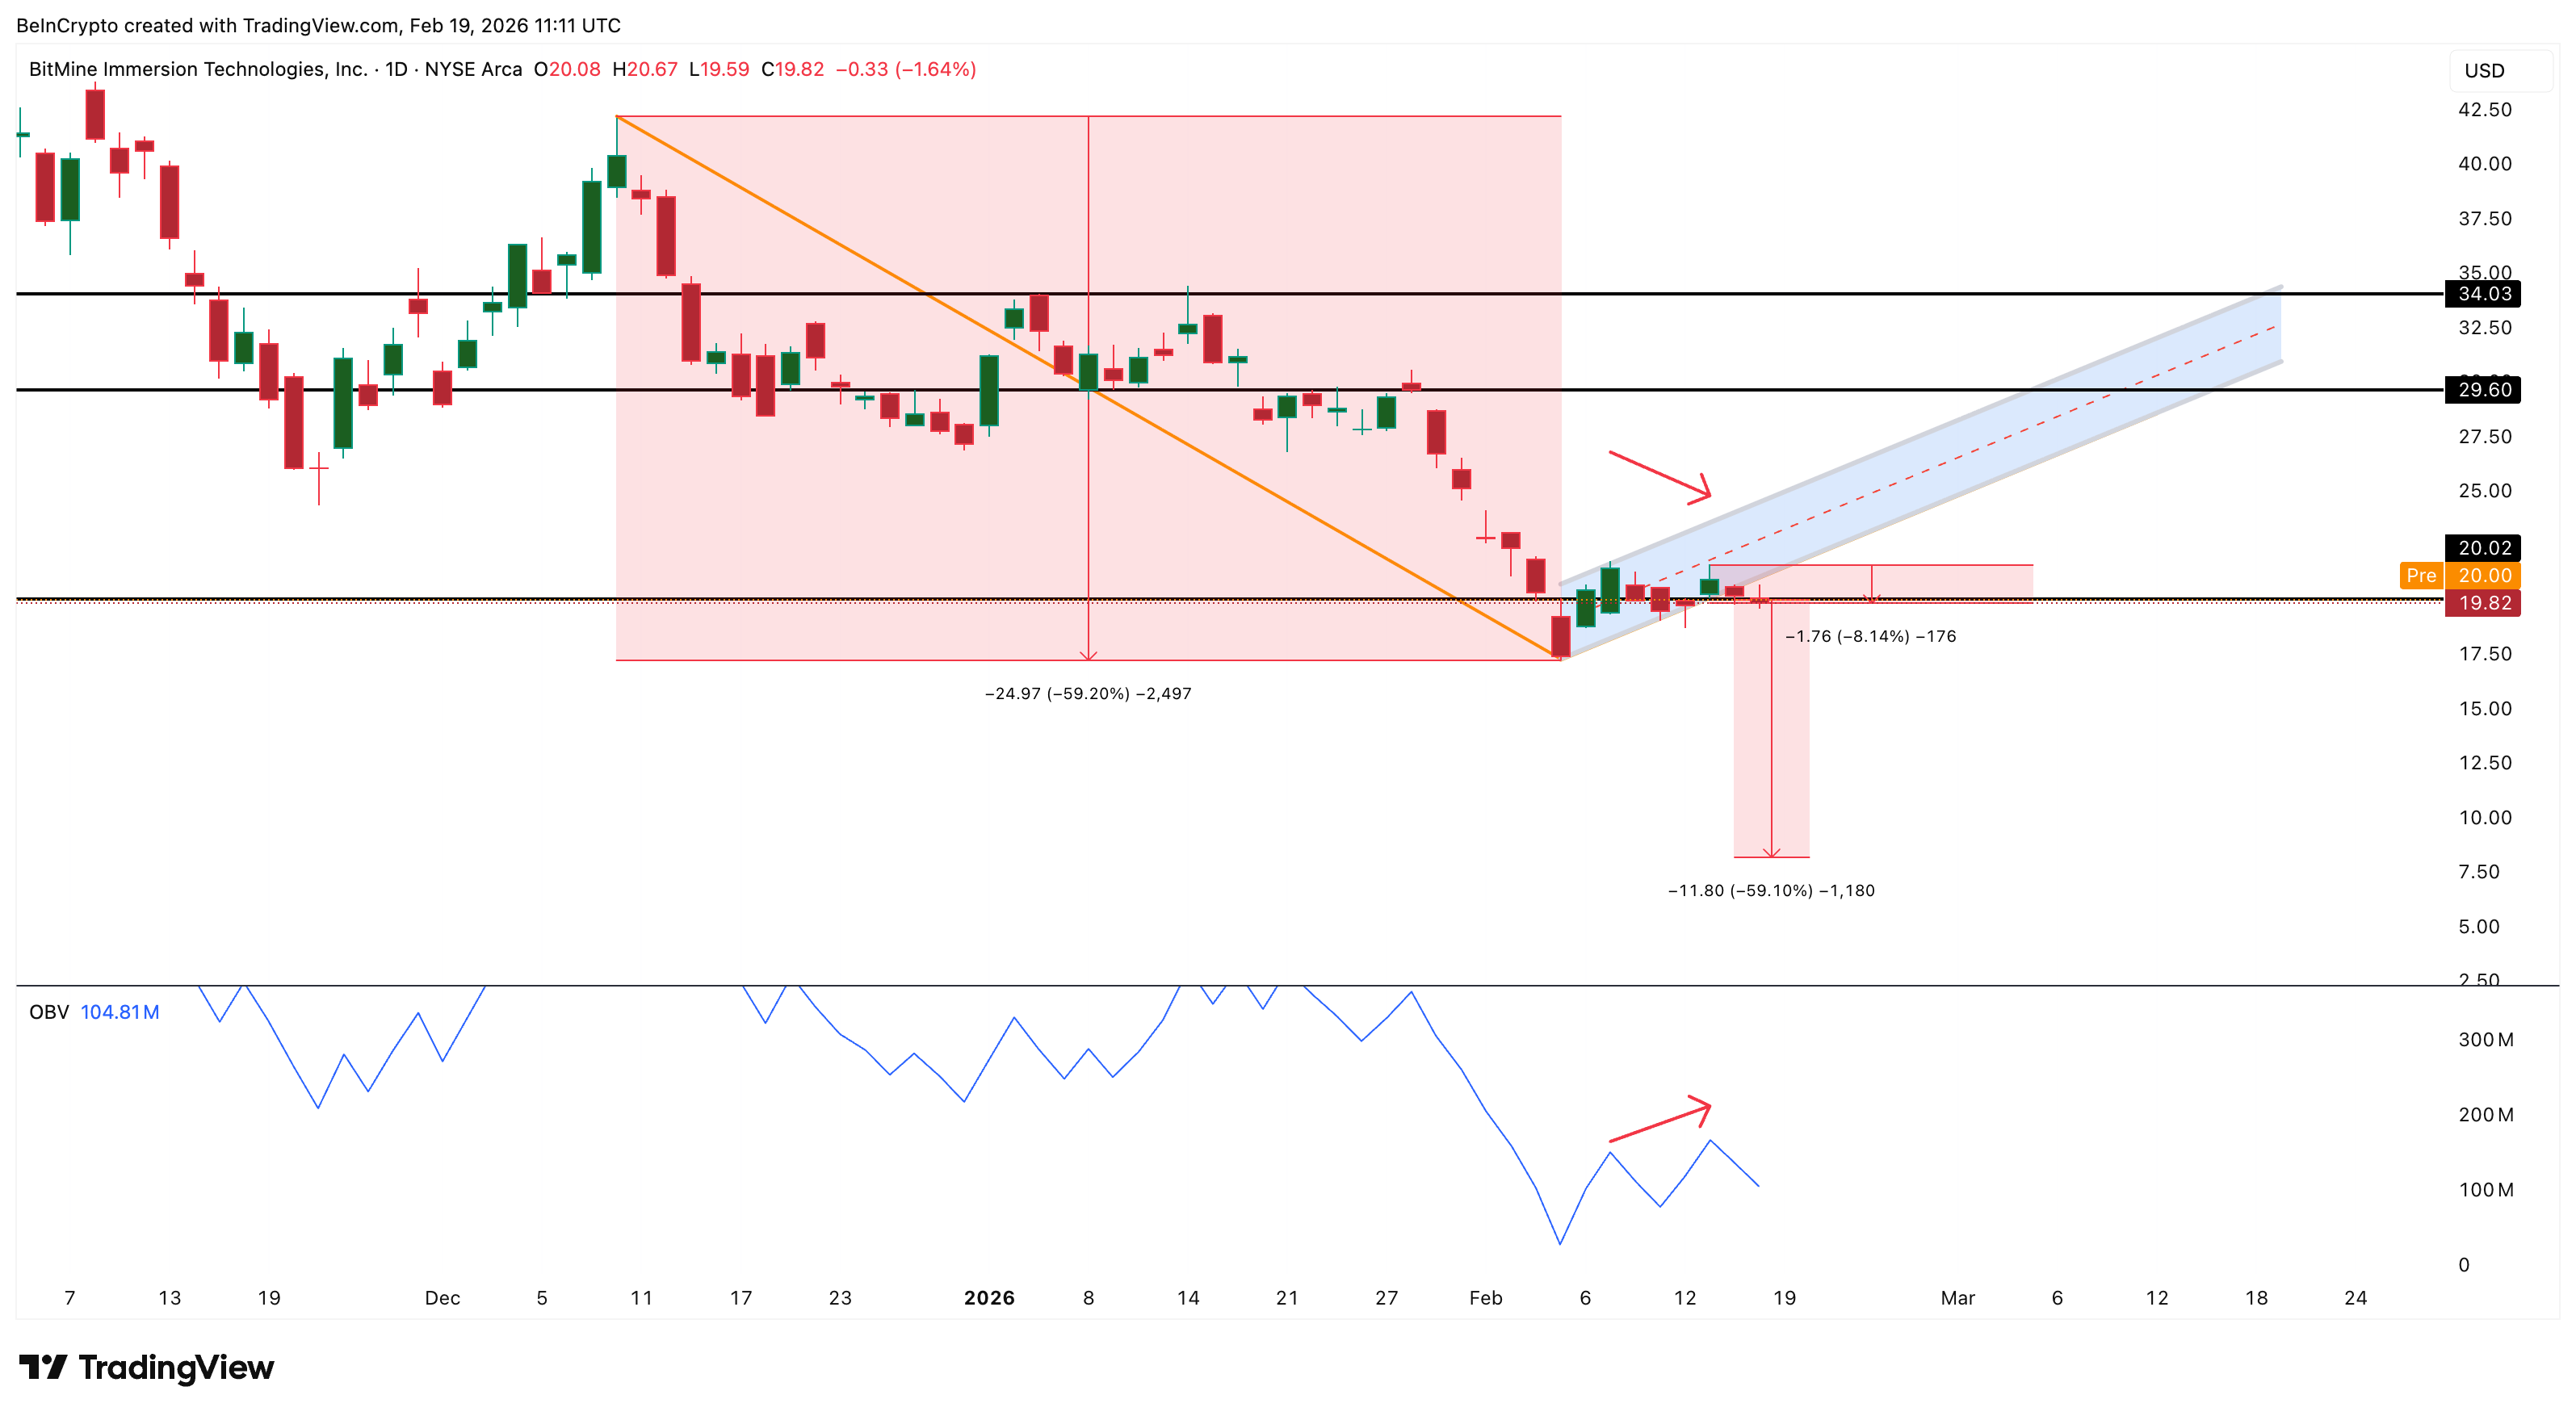
Despite the falling price, investor behavior beneath the surface shows some early strength. One key indicator is On-Balance Volume, or OBV. This metric tracks cumulative buying and selling pressure. When OBV rises, it means investors, possibly retail, are buying. possibly retail, are accumulating, even if the price has not responded yet.
 Retail Participation Improves: TradingView
Between February 9 and February 13, BitMine’s stock price formed a lower high, showing weakening price strength. However, OBV formed a higher high during the same period. It signals that buying activity is increasing quietly. This suggests retail investors were still accumulating BitMine stock despite the falling price.
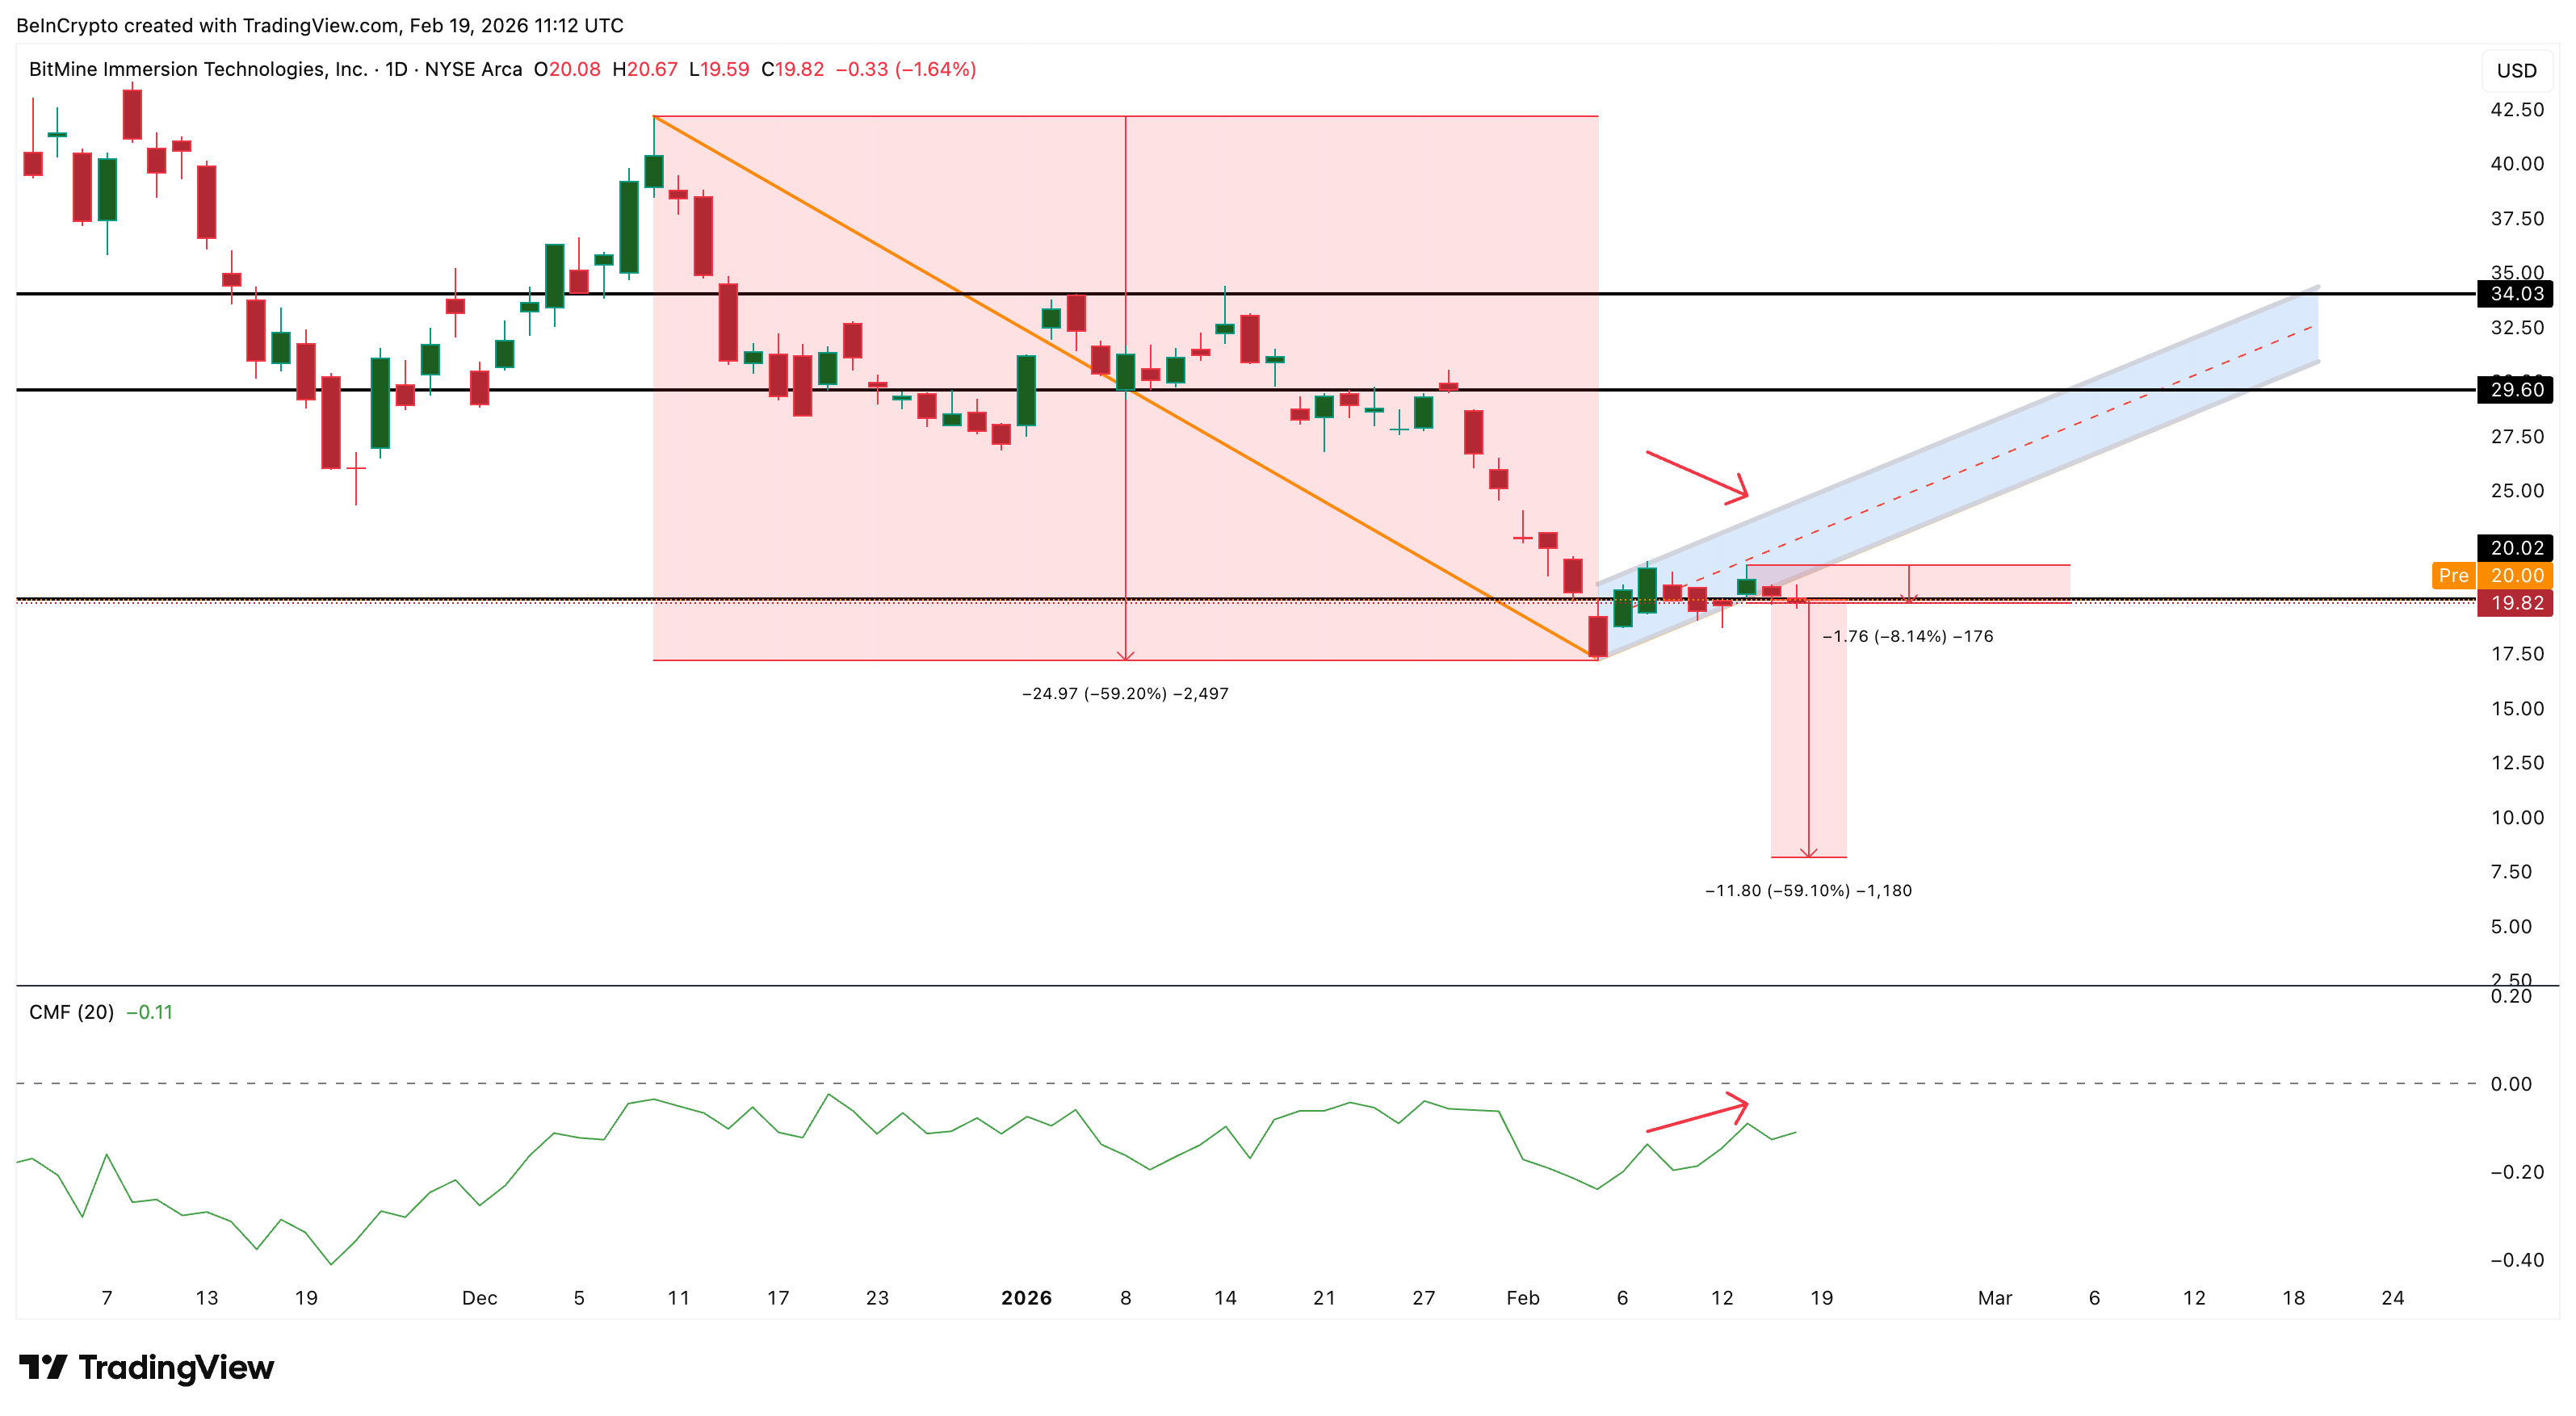
Another important indicator, the Chaikin Money Flow, or CMF, also shows improving conditions.
CMF measures whether large capital is entering or leaving a stock. The indicator has been rising recently, showing improving inflows and showing divergence similar to OBV.
However, CMF remains below the zero line, which means overall capital flow into BitMine is still negative. This suggests that large institutional investors are not fully supporting the recovery yet. Retail investors are stepping in, but institutional money remains cautious.
 Big Money Weak But Improving: TradingView
Together, the rising OBV and improving CMF suggest that underlying participation is stabilizing rather than collapsing. This indicates that the recent breakdown may not be driven by aggressive selling from BitMine investors. Instead, the stock’s weakness appears more closely linked to Ethereum’s own price pressure, reflecting BitMine’s growing role as a high-beta proxy for ETH rather than a stock moving independently.
Ethereum Weakness Is Dragging BitMine Stock Price Lower
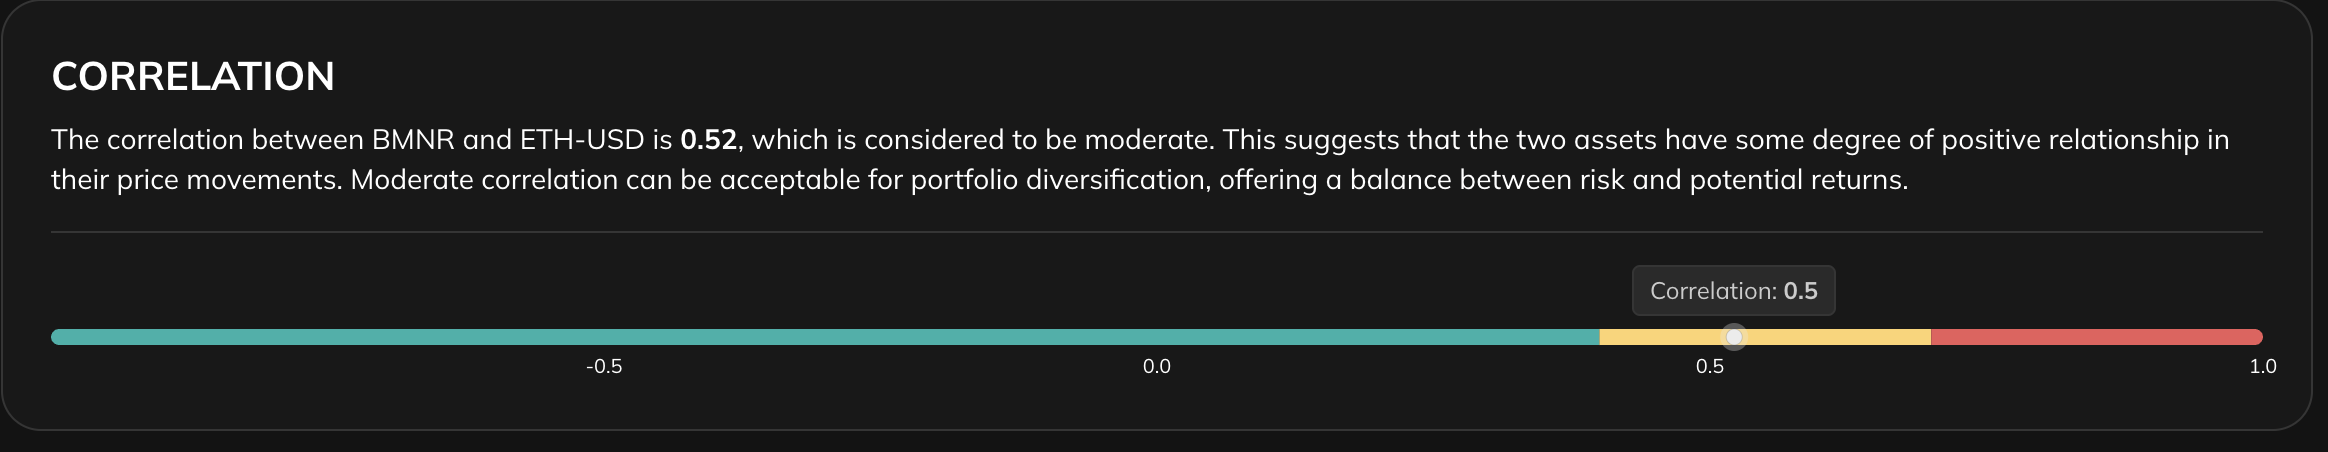
The biggest reason behind BitMine’s stock decline becomes clear when comparing it with Ethereum. BitMine’s price is highly correlated with Ethereum’s price. Correlation measures how closely two assets move together. BitMine’s correlation with Ethereum has increased from 0.50 to 0.52. This means the stock is behaving more like a direct proxy for Ethereum.
 BMNR-ETH Correlation: Portfolio Slab
At the same time, Ethereum’s futures market shows rising bearish sentiment. The Ethereum long-short ratio has dropped to extremely low levels. This ratio measures how many traders expect prices to rise compared to fall. A low ratio means most traders expect further declines.
This bearish positioning directly impacts BitMine. Because BitMine holds a massive Ethereum treasury, its stock tends to weaken when Ethereum itself faces bearish pressure.
The technical chart now shows key levels ahead. BitMine has already lost support near $19. The next major support sits near $15. If that level breaks, the stock could fall toward $12 and even $9, which would be closer to the projected bear-flag breakdown level.
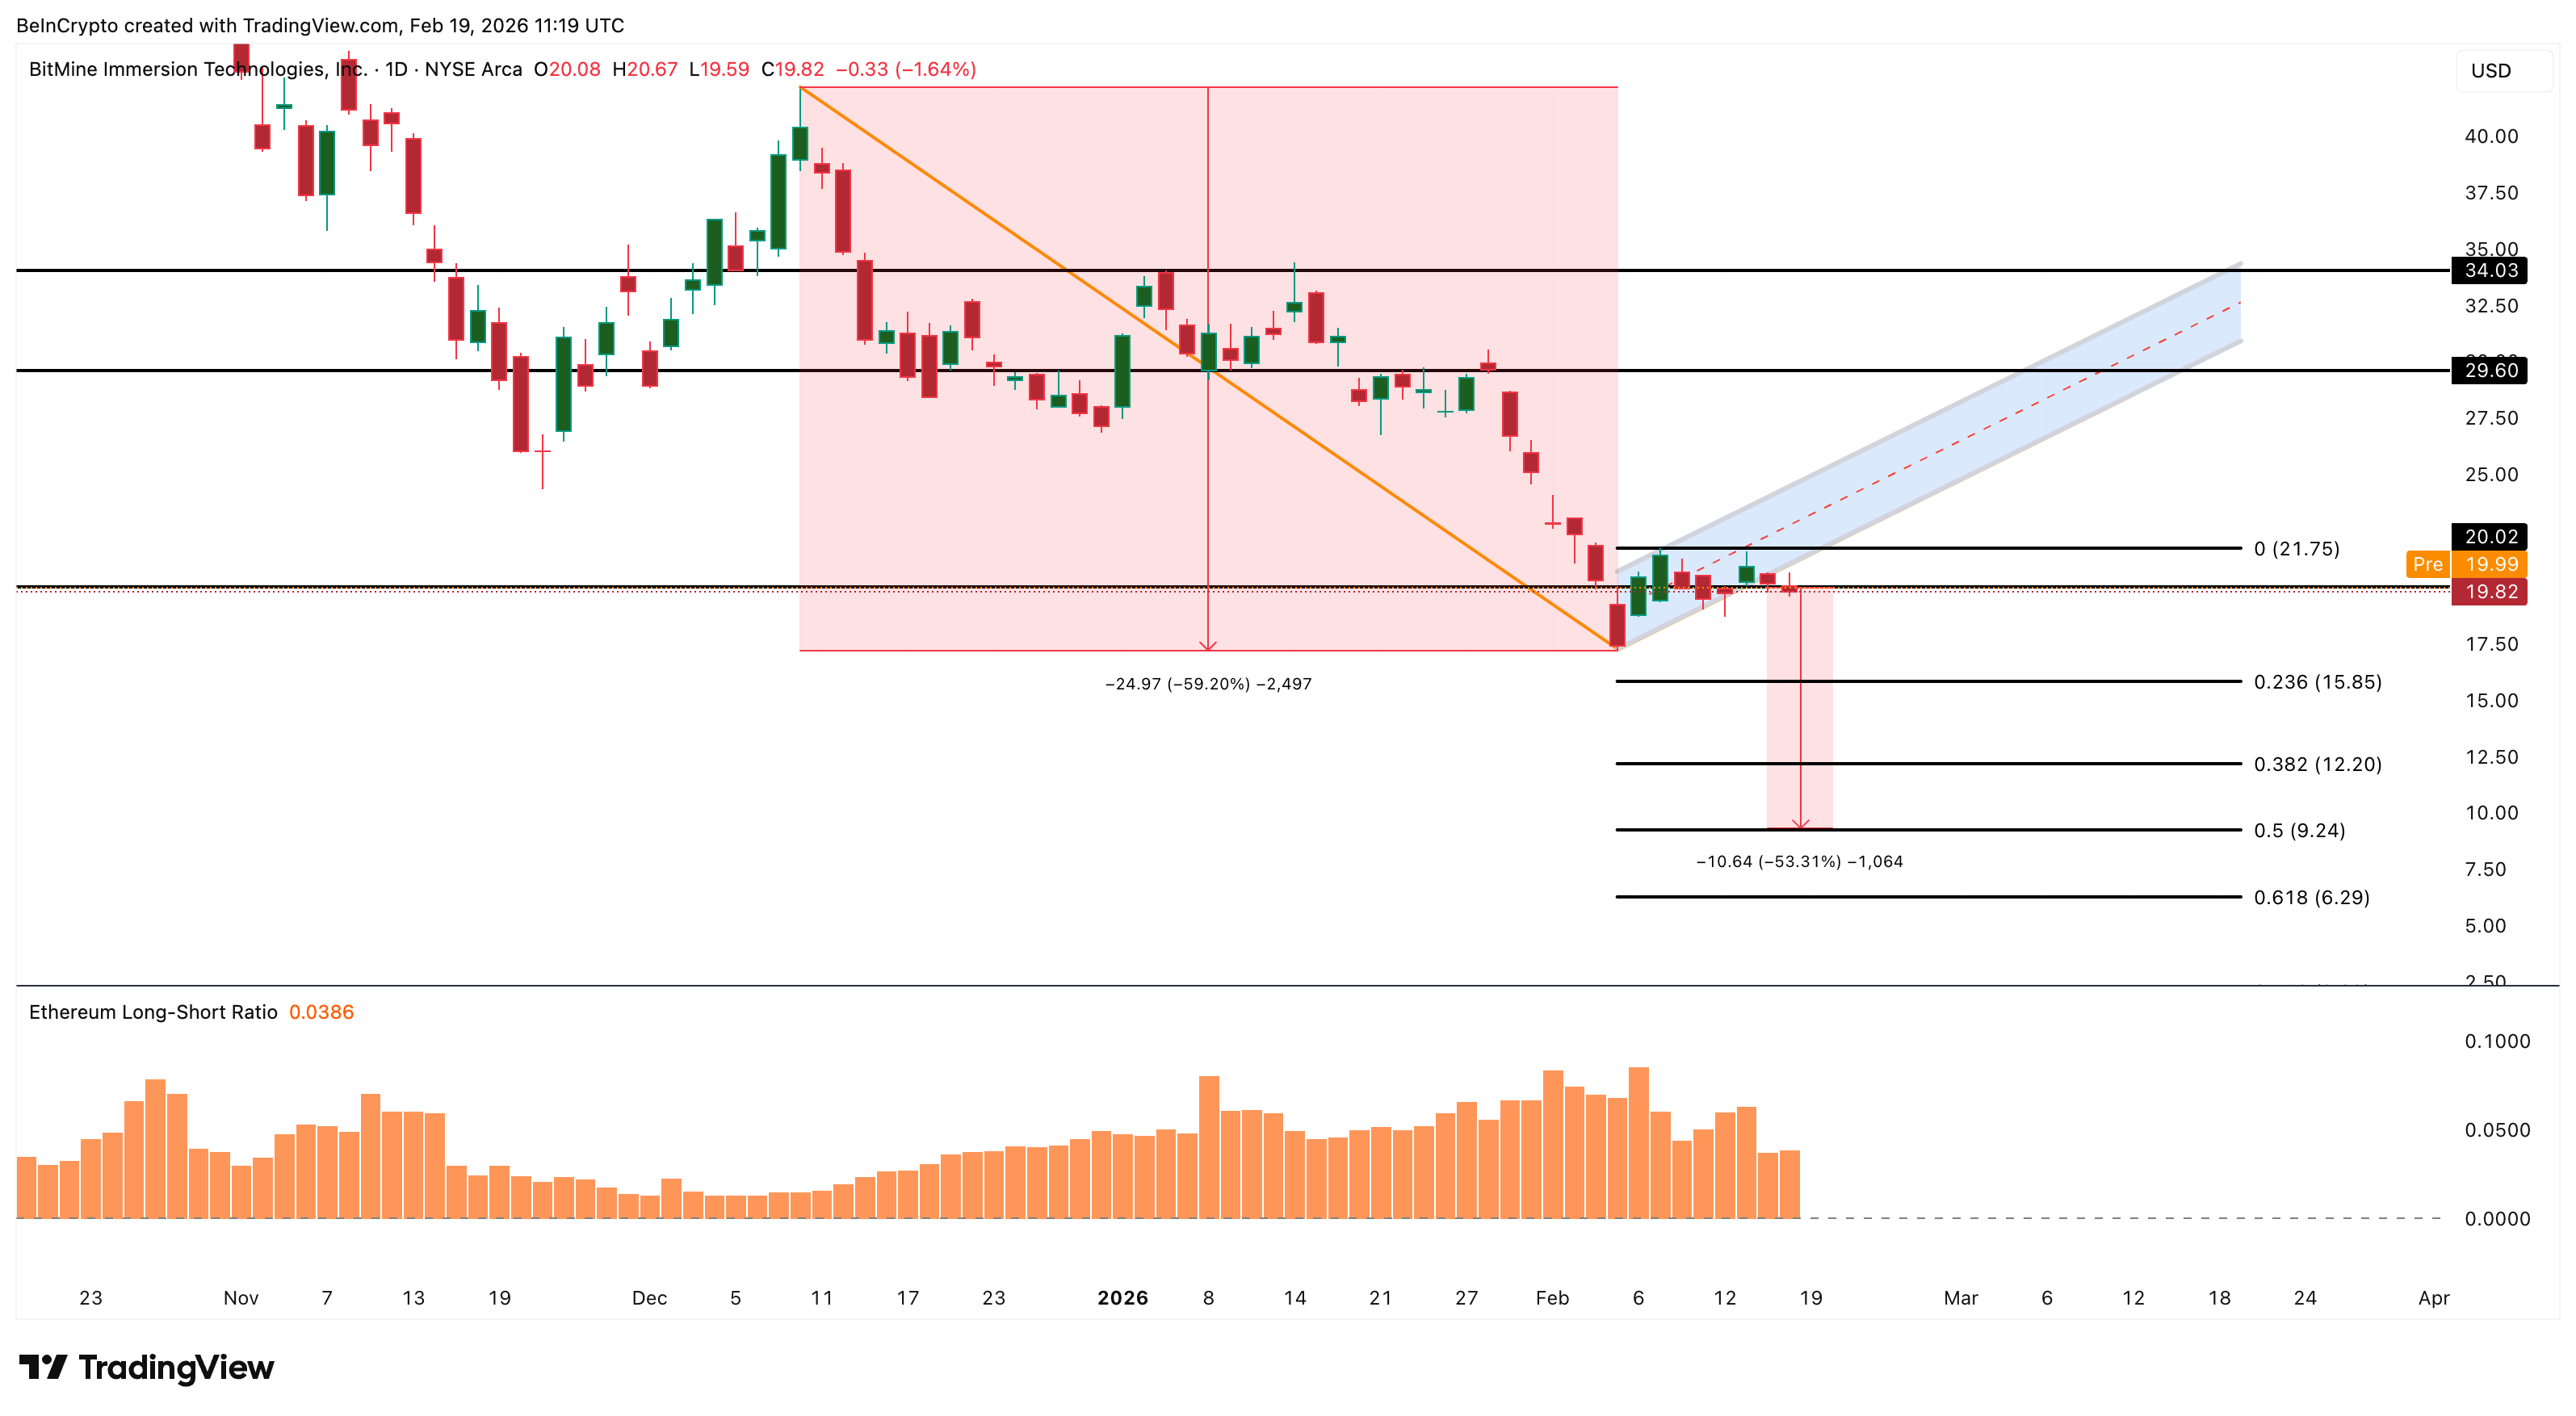 BMNR Price Analysis: TradingView
On the upside, recovery would first require reclaiming $21. A stronger bullish reversal would need a move above $29.
BitMine buying more Ethereum should have been a bullish signal. Retail investors are slowly accumulating, and capital inflows are improving. However, institutional money remains cautious, and Ethereum itself is facing bearish sentiment. Because BitMine now moves closely with Ethereum, its stock direction depends heavily on Ethereum’s strength. If Ethereum remains weak, BitMine may continue facing pressure regardless of its purchases.
On the surface, BitMine buying Ethereum and BitMine stock falling look like two different events. But in reality, they reflect the same underlying force.
Recommended Articles


