

Is Bitcoin Price Entering a New Bear Market? Here’s Why Metrics Say Yes
Bitcoin has extended its recent pullback, raising concerns across the crypto market. While the correction appears orderly, underlying data signals deeper structural stress.
Historically, similar patterns have marked early bear market transitions. Current on-chain metrics suggest capital rotation remains weak. Yet, some indicators show conditions have not fully deteriorated, creating a complex picture for investors.
Bitcoin May See An Extended Bear Market
The Realized Profit/Loss Ratio offers key insight into Bitcoin’s capital flow dynamics. This metric measures the proportion of realized gains relative to realized losses. Its 90-day moving average has declined into the 1–2 range.
Historically, this zone has characterized transitions from early bear phases toward more stressed environments. When the ratio approaches 1, realized losses begin to dominate market activity. This compression reflects subdued profit-taking and limited liquidity rotation.
Want more token insights like this? Sign up for Editor Harsh Notariya’s Daily Crypto Newsletter here.
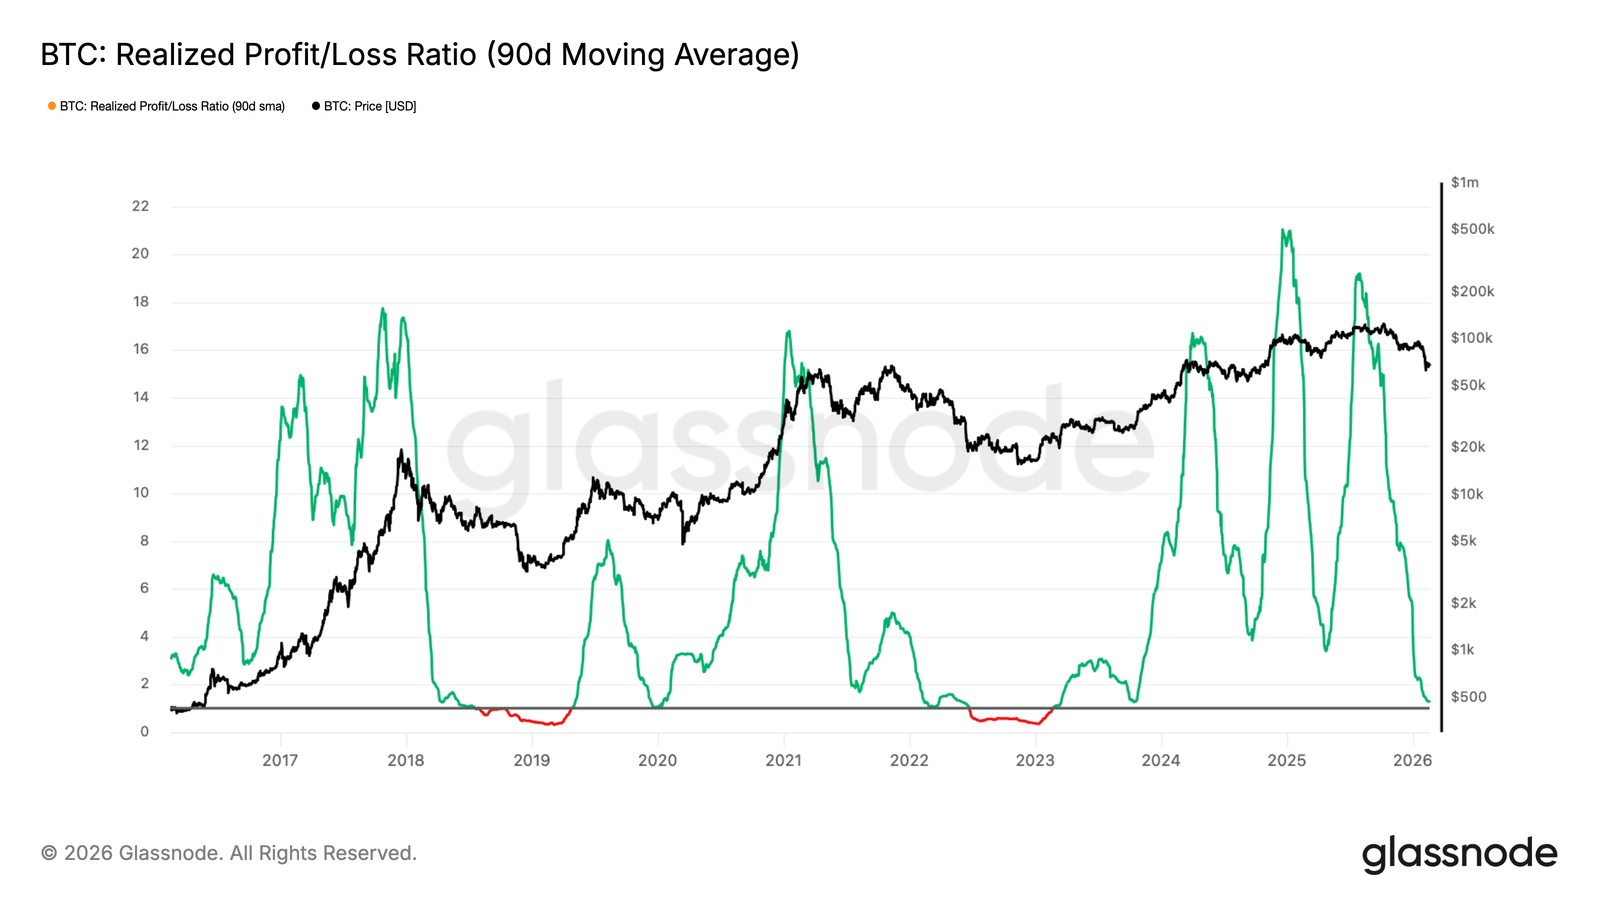 Bitcoin Realized Profit/Loss Ratio. Source: Glassnode
Until the Realized Profit/Loss Ratio decisively reclaims levels above 2, structural weakness may persist. A sustained move higher would indicate renewed profitability and stronger capital inflows. Without that shift, the broader market bias remains tilted toward caution.
Network activity data presents another warning signal. Compared to five years ago, Bitcoin has registered 42% fewer unique BTC addresses making transactions. Additionally, new BTC addresses have declined by 47%.
This divergence highlights slowing network growth despite price resilience. Healthy bull cycles typically coincide with expanding user participation. A durable recovery will likely require rising active addresses and accelerating wallet creation, signaling renewed organic demand.
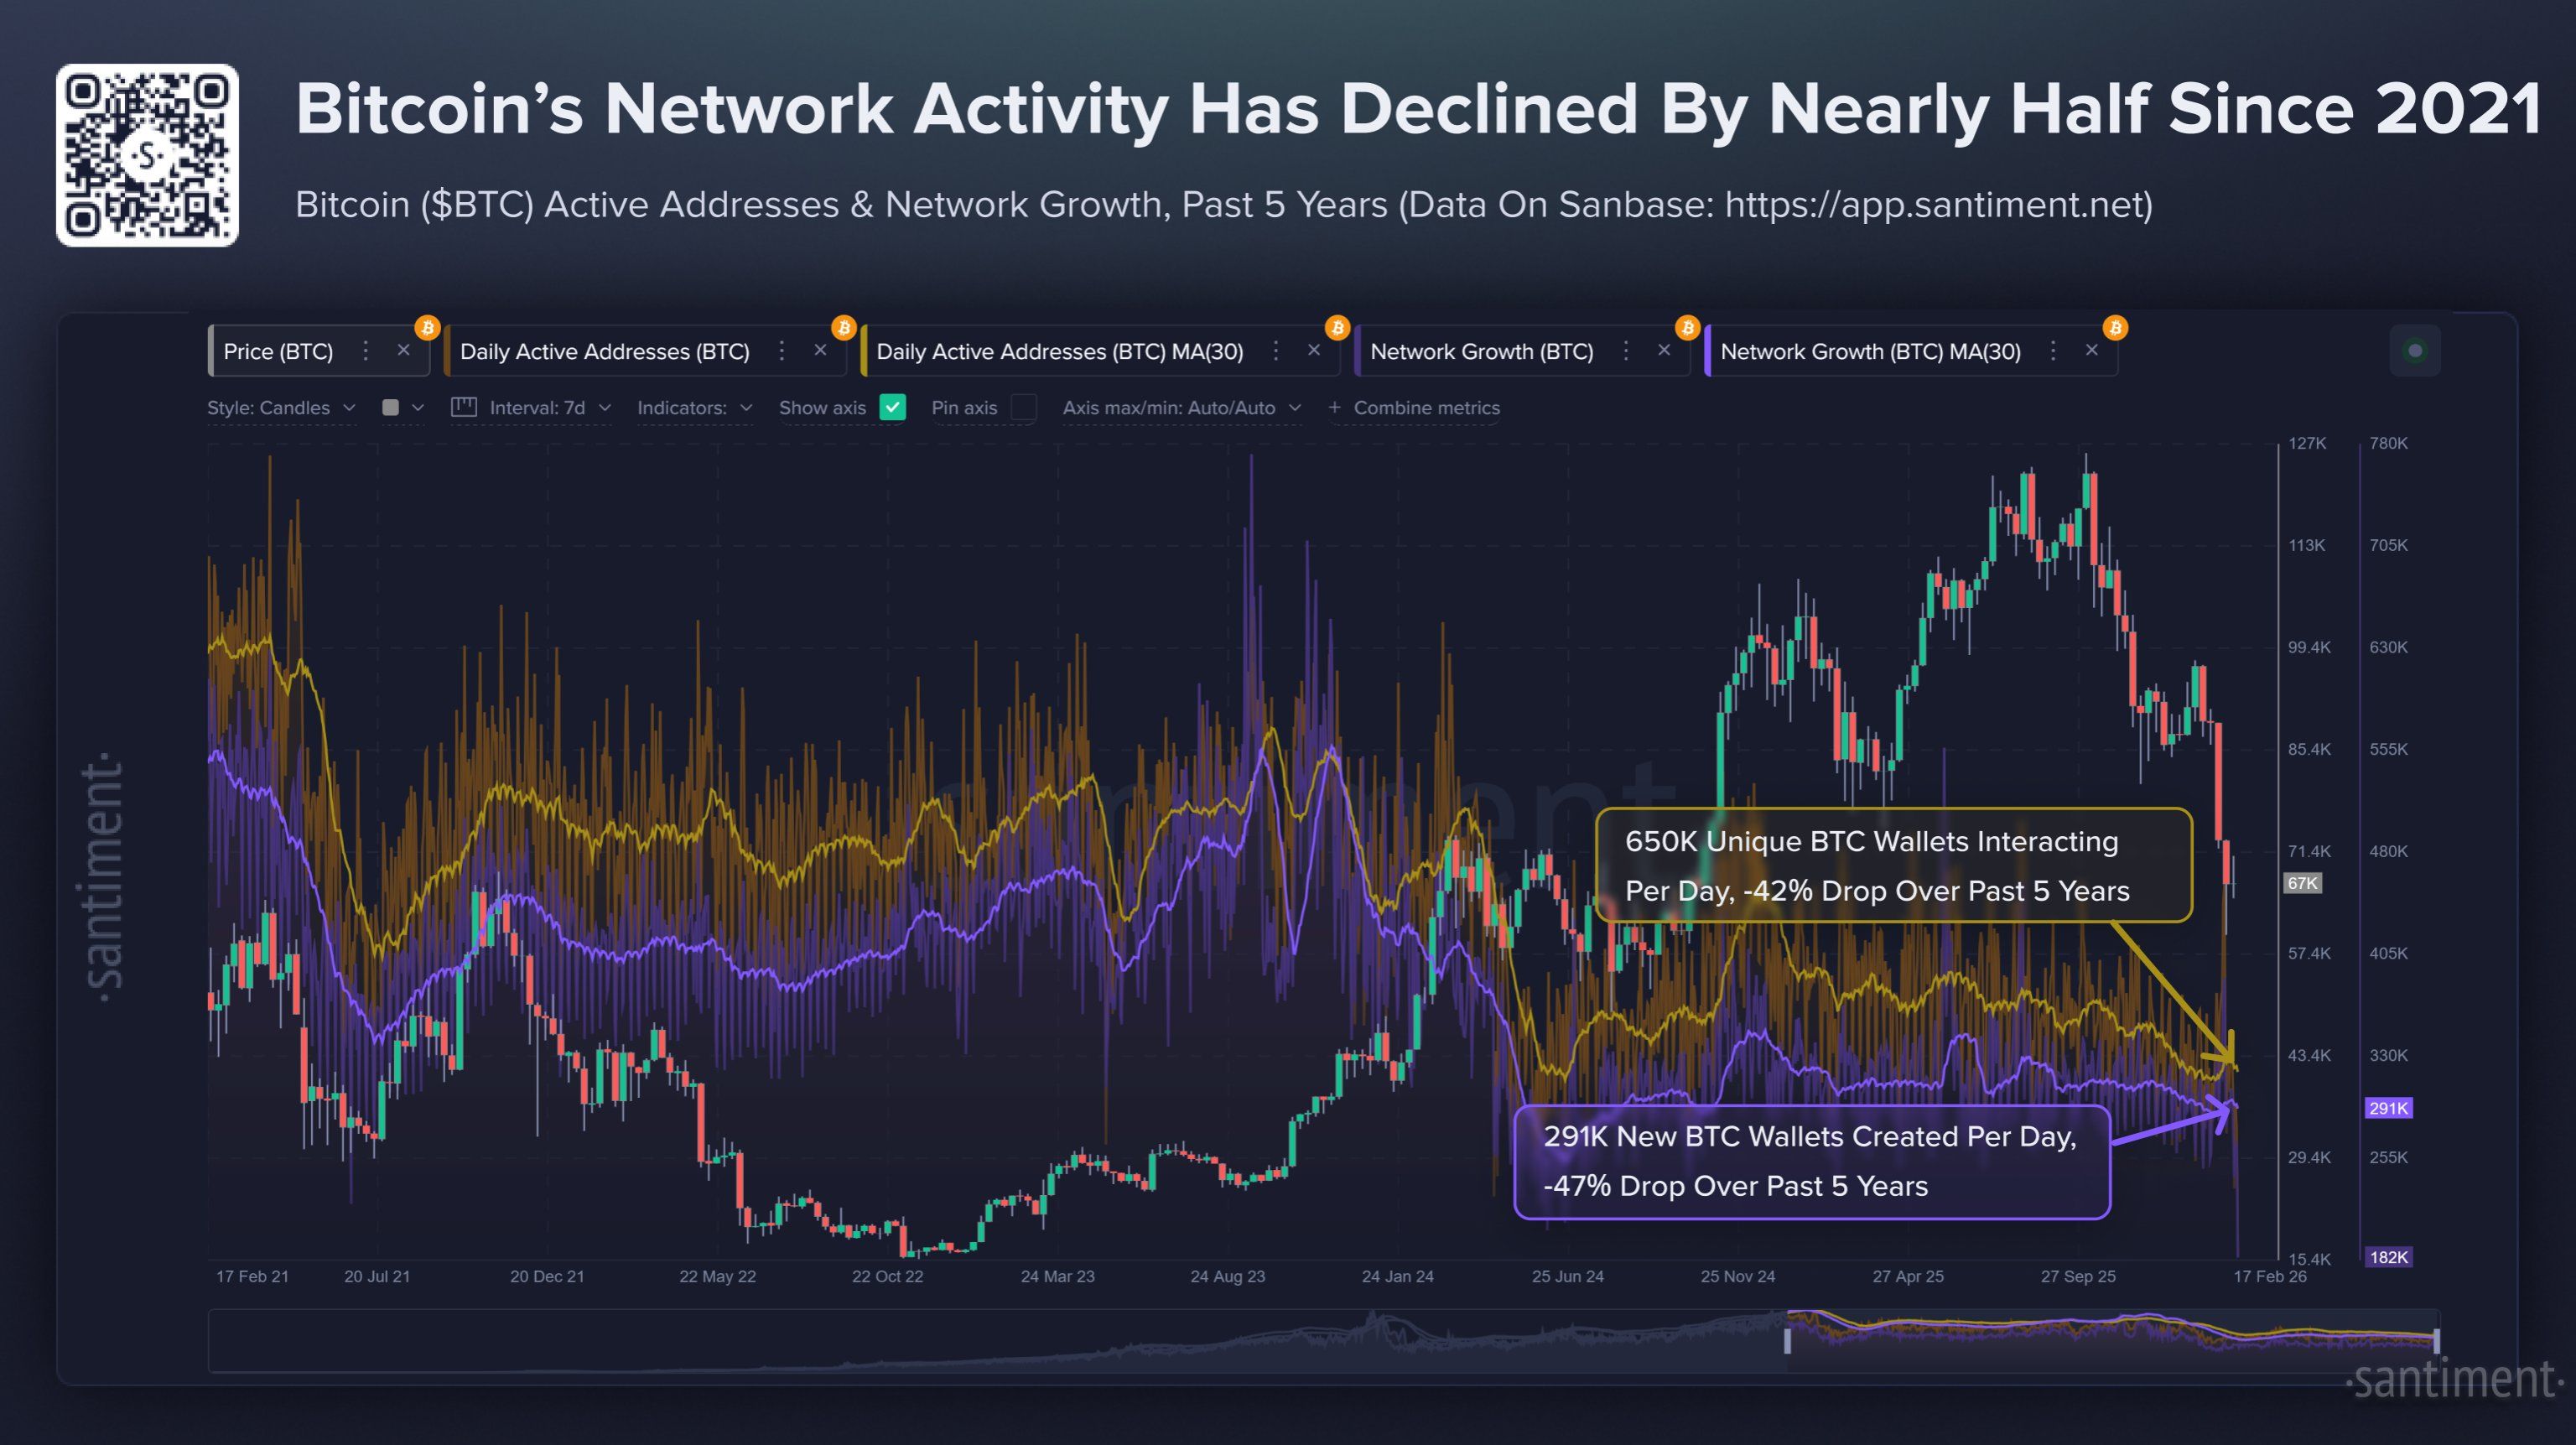 Bitcoin Network Activity. Source: Santiment
BTC Price Needs To Avoid Losing This Support
Bitcoin price is trading at $66,721 at the time of writing. The price remains slightly above the critical $66,550 support level. This zone has prevented a sharper breakdown for several sessions. However, BTC continues to respect a downtrend that began in late January.
If bearish momentum persists, Bitcoin may struggle to break above descending resistance. A failure to invalidate the downtrend could drive price toward the $60,000 support region. Loss of that level may trigger accelerated selling, exposing the next major support near $52,775.
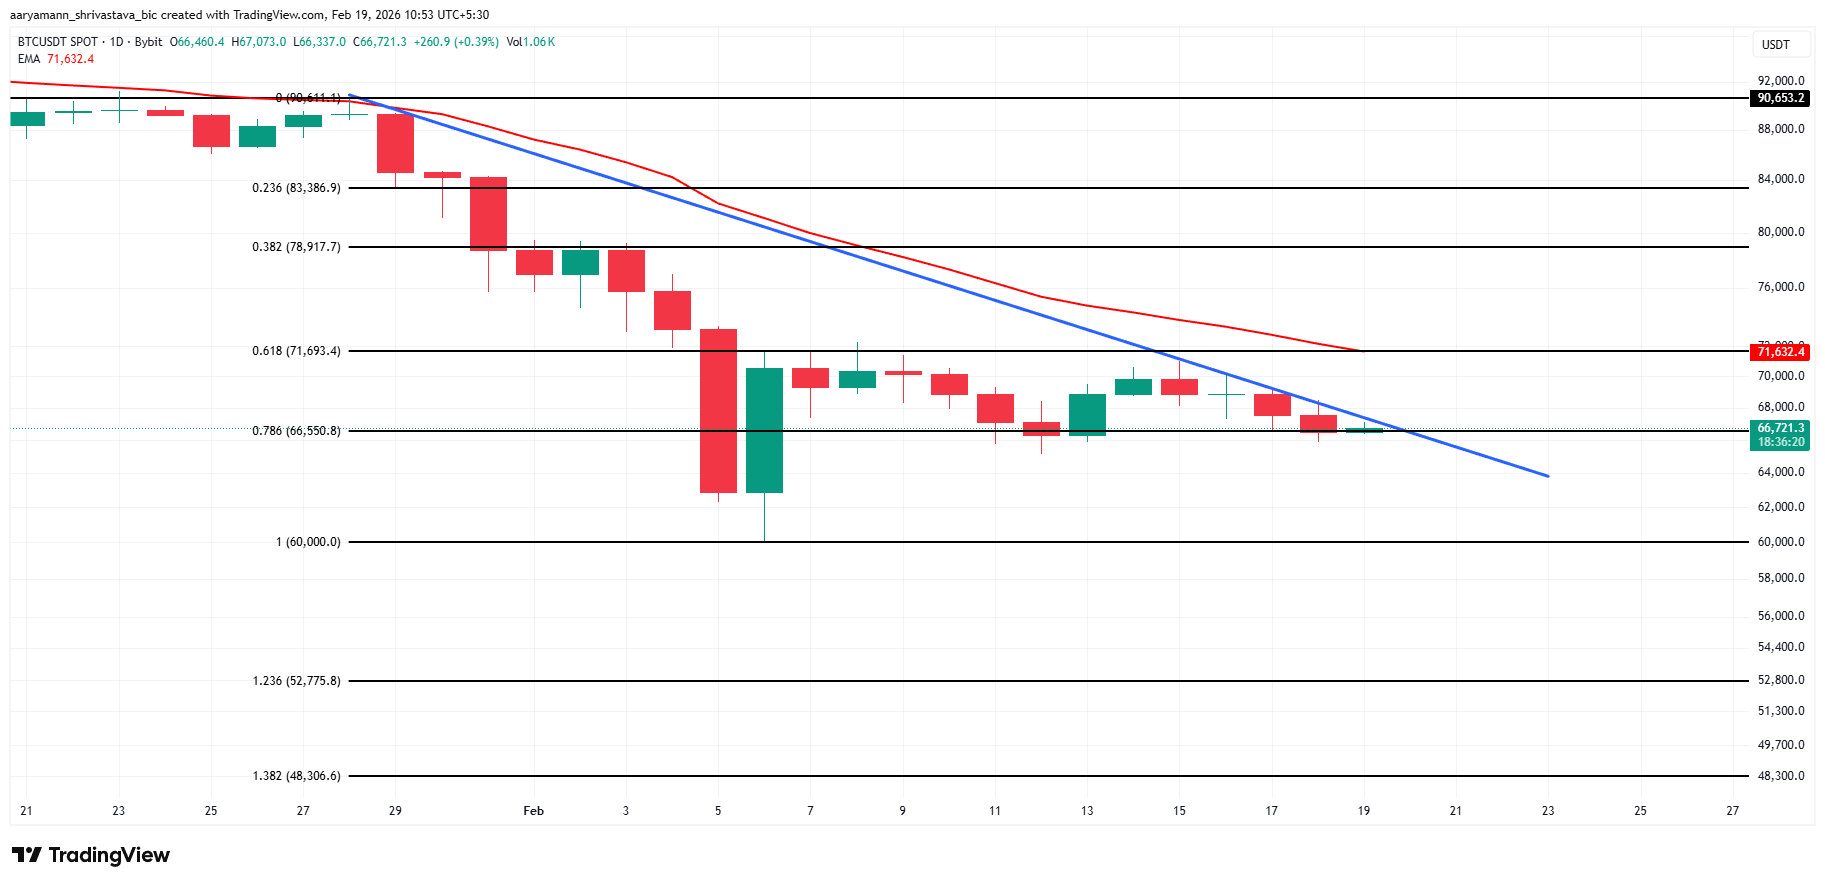 BTC Price Analysis. Source: TradingView
The Realized Price currently stands at $54,920. Historically, extended bear markets have followed sustained breaks below this benchmark. A decline toward the 1.23 Fibonacci level would increase that risk. Such a move could mark the formal onset of a prolonged bearish cycle.
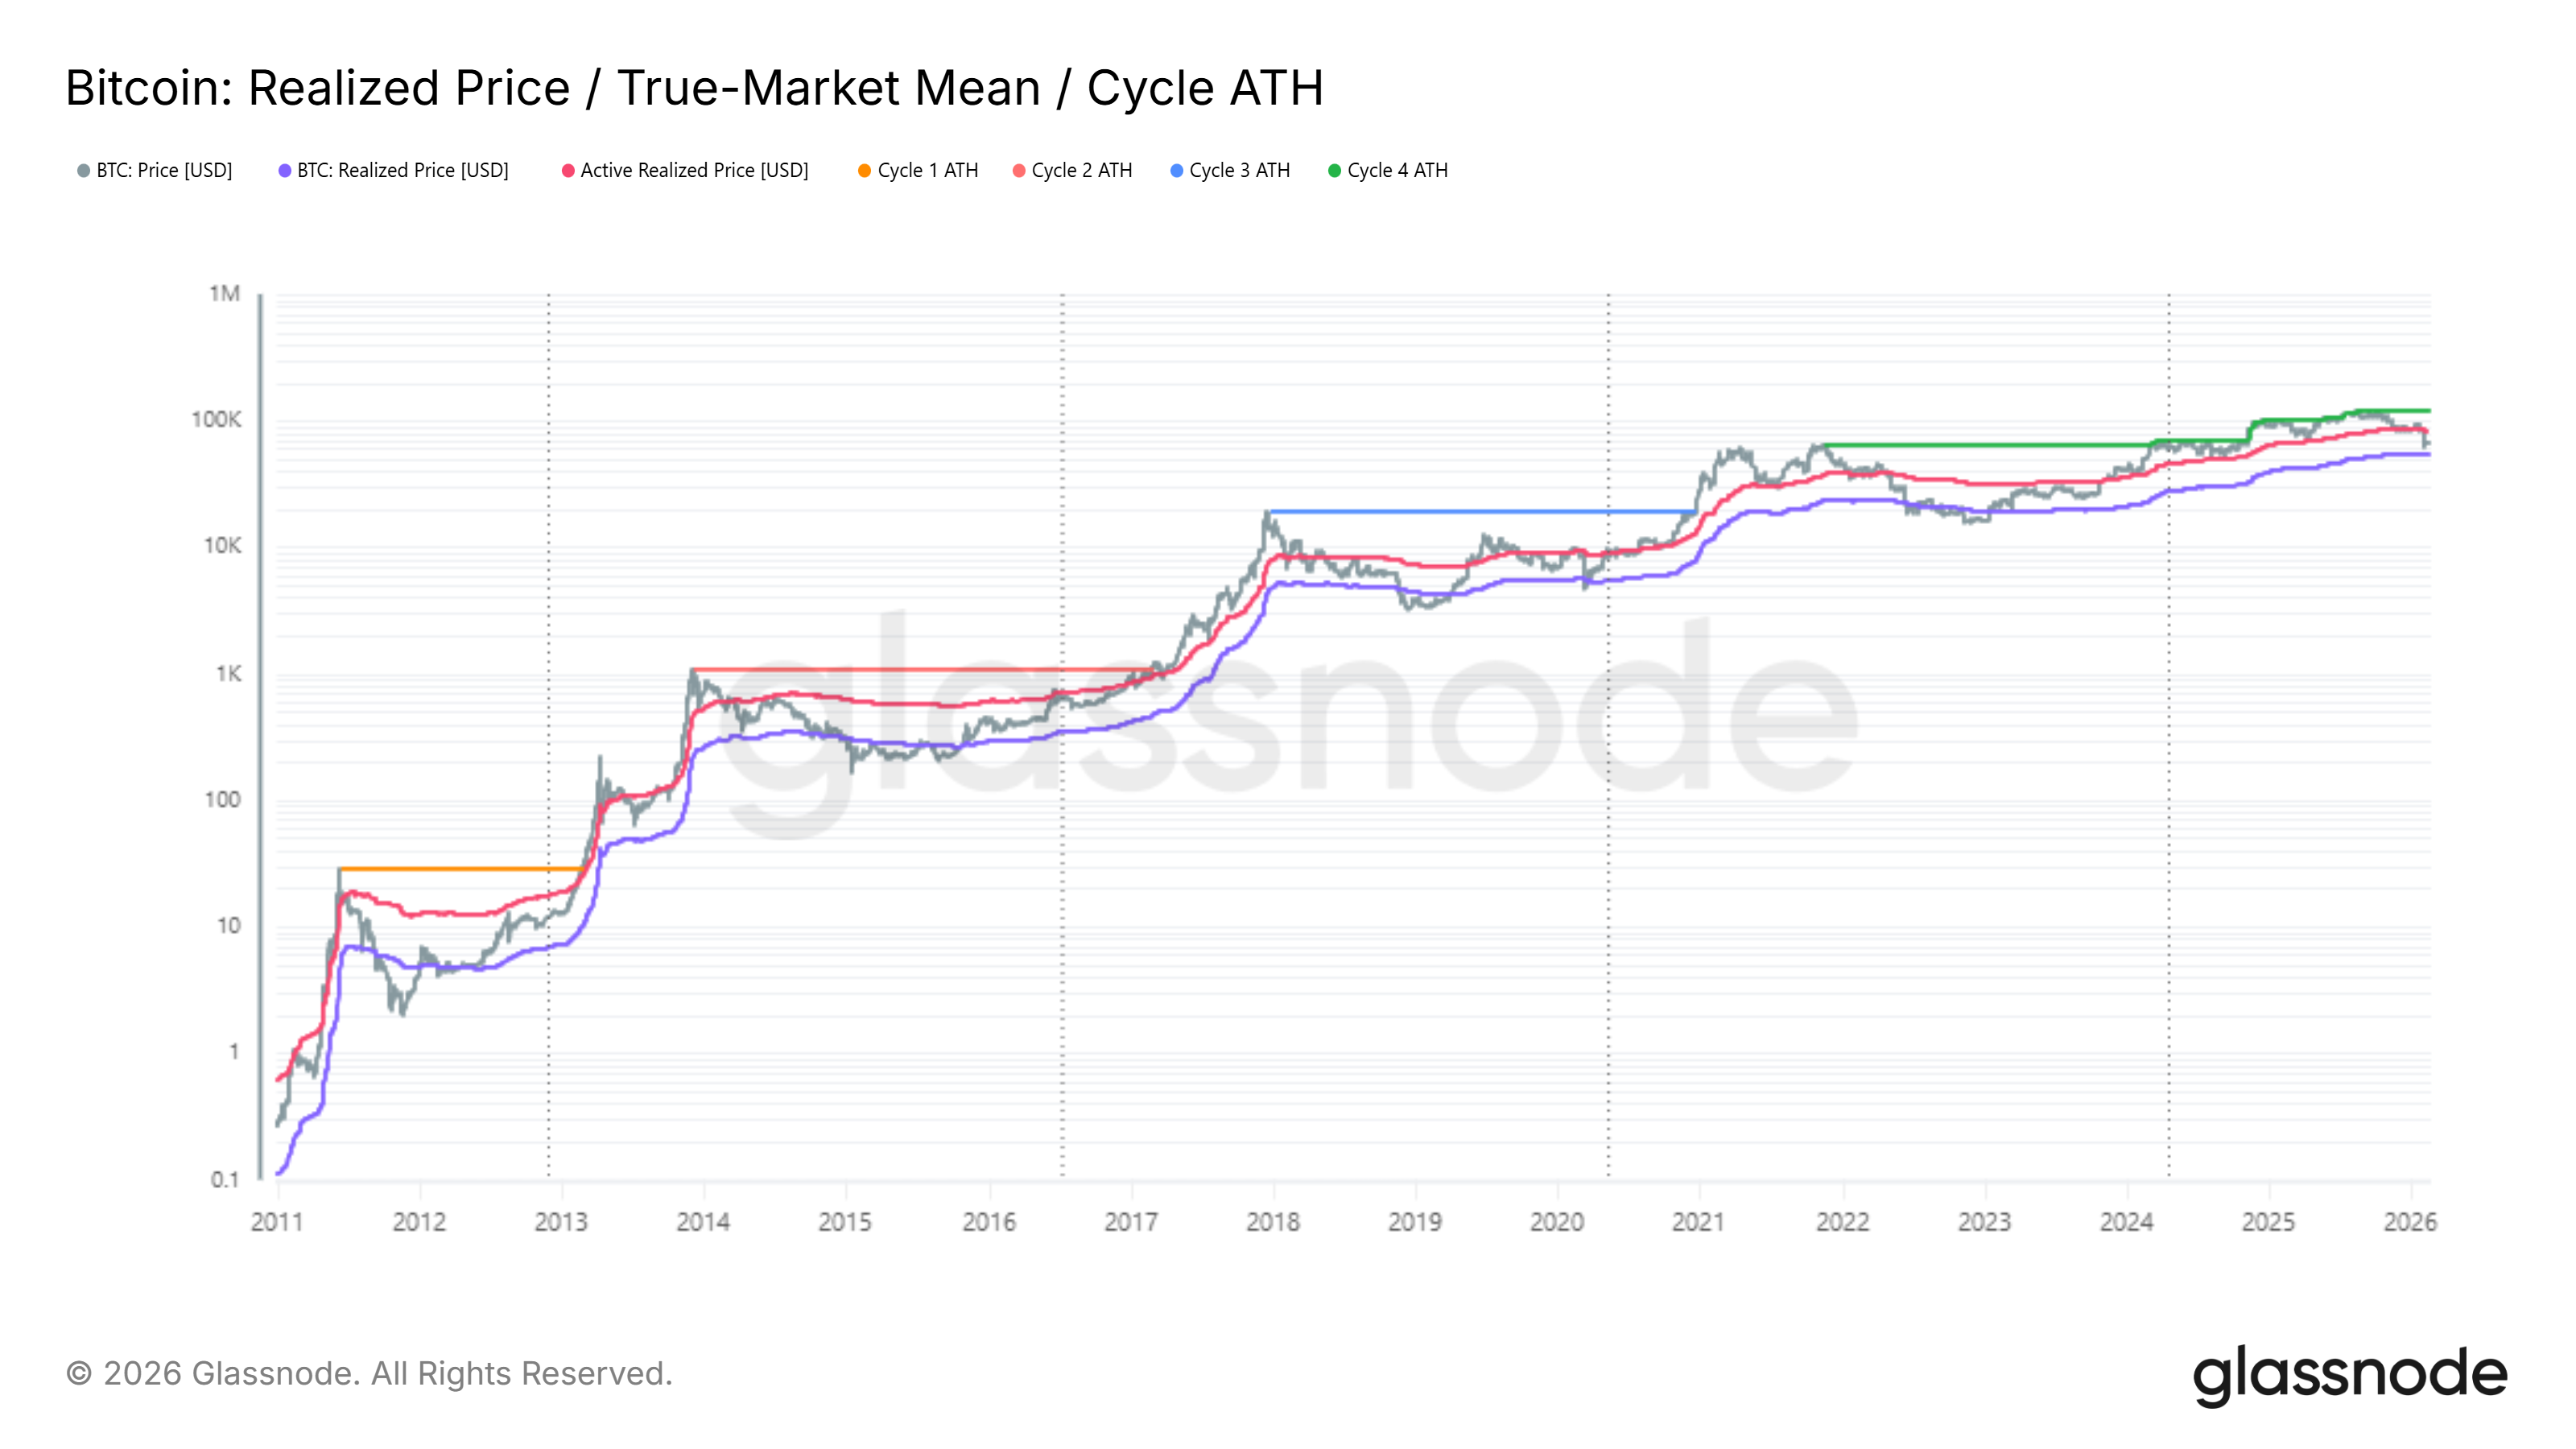 Bitcoin Realized Price. Source: Glassnode
To invalidate the bearish thesis, Bitcoin must rebound decisively from $66,550. A breakout above $71,693 would signal strengthening momentum. Reclaiming the short-term 20-day EMA would reinforce recovery prospects. A confirmed move beyond $80,000 would provide stronger evidence of renewed long-term confidence.
Recommended Articles


