

Onyxcoin’s Month-Long Price Crash To Deepen Amid 40% Surge in Holder Exodus?
Onyxcoin price is down nearly 2% in the past 24 hours and remains locked in a steep downtrend. Between January 6 and February 6, XCN lost close to two-thirds of its value. After briefly rebounding from $0.0045 to $0.0059, the XCN price has started weakening again. On-chain data shows accelerating holder exits, while only one major support zone is still holding.
The question now is whether this is just consolidation or the start of another deep sell-off.
Bear Flag Breakdown Keeps Downside Pressure Intact
Onyxcoin’s recent rebound has formed inside a bear flag pattern on the daily chart. A bear flag appears when a sharp decline is followed by a weak, narrow rebound. It usually signals continuation, not recovery. In XCN’s case, the drop from early January to early February created the flagpole. The move toward $0.0059 formed the flag.
Recently, the XCN price slipped below the lower boundary of this structure.
Want more token insights like this? Sign up for Editor Harsh Notariya’s Daily Crypto Newsletter here.
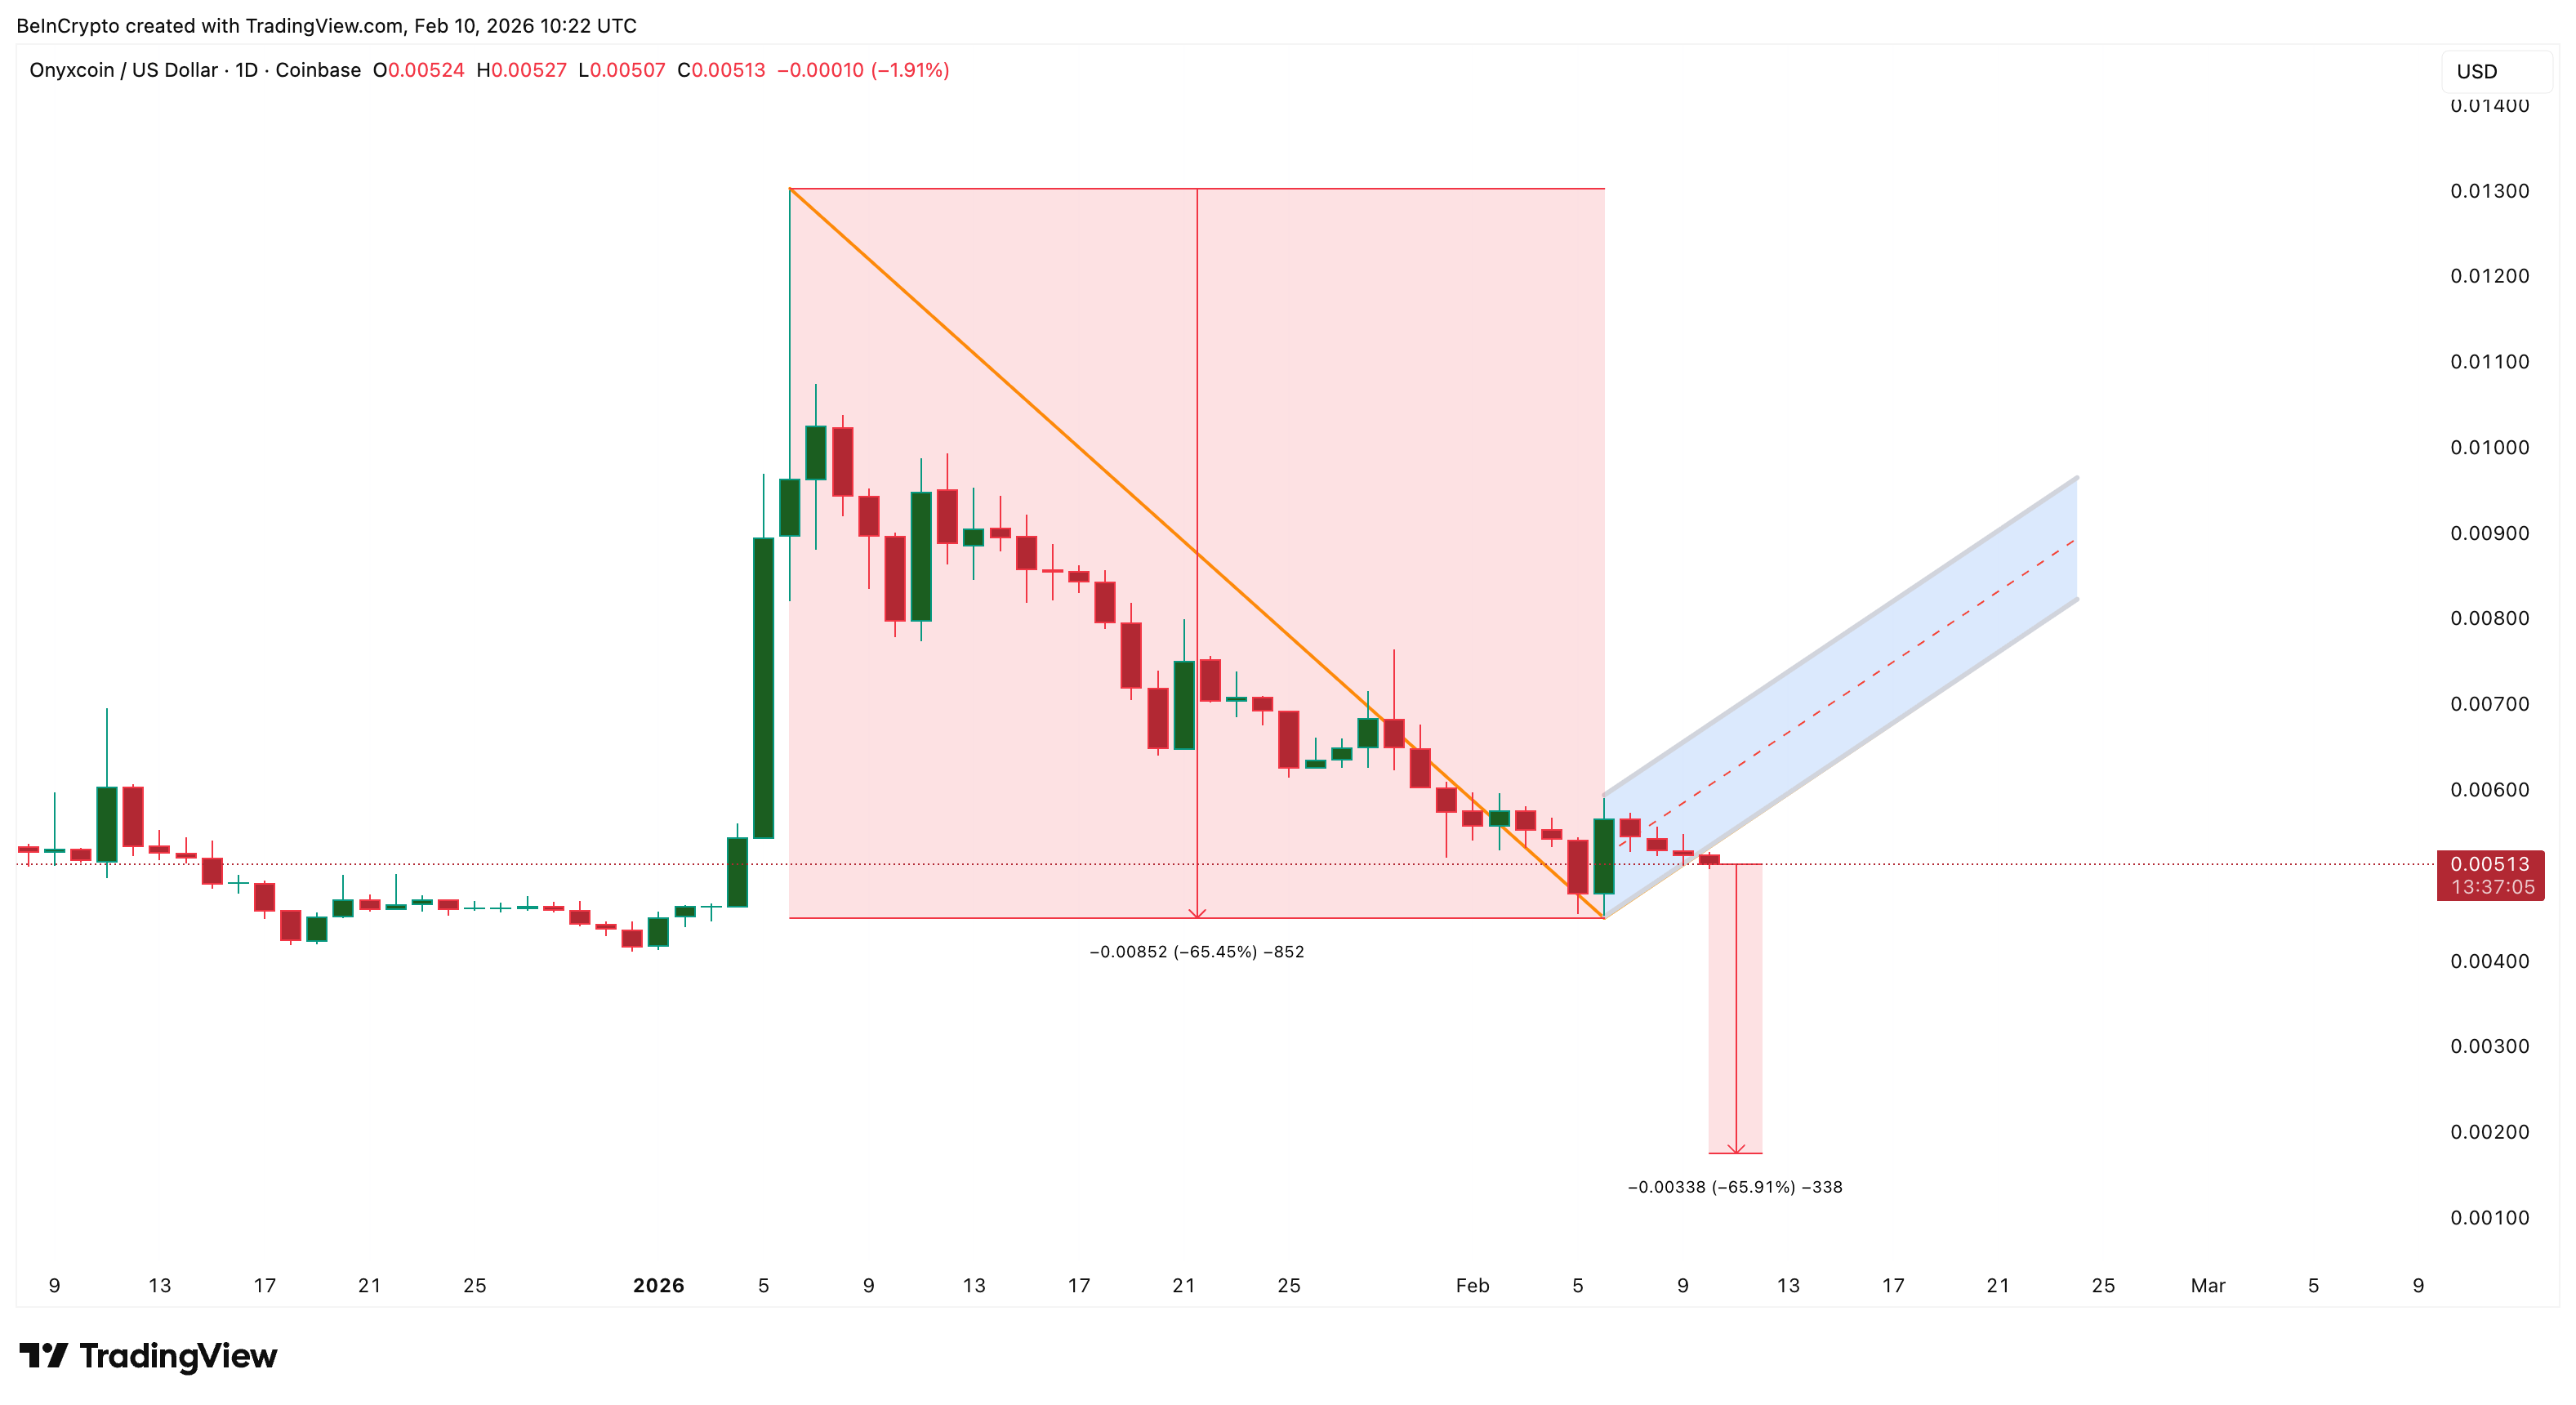 Onyxcoin Price Structure: TradingView
This breakdown suggests that buyers failed to regain control after the rebound. Instead of building momentum, selling pressure resumed. When bear flags fail, the next decline often mirrors the size of the first move. With XCN already down around 65% from January levels (pole’s height), this structure keeps downside risk elevated.
Whether this weakness is reversed by a move back inside the flag, or confirmed by a sustained breakdown, now depends on on-chain behavior.
Holder Exodus Accelerates While Whales Show Fragile Confidence
On-chain data shows that long-term investors are leaving faster.
This is reflected in Hodler Net Position Change, which tracks whether wallets holding coins for more than 155 days are accumulating or distributing over 30 days. When the metric is negative, long-term holders are selling.
On February 6, this figure stood near -34 million XCN. By February 9, it had widened to roughly -47.8 million XCN. That represents a rise in net selling of about 40% in just a few days. This shows that conviction holders are accelerating exits.
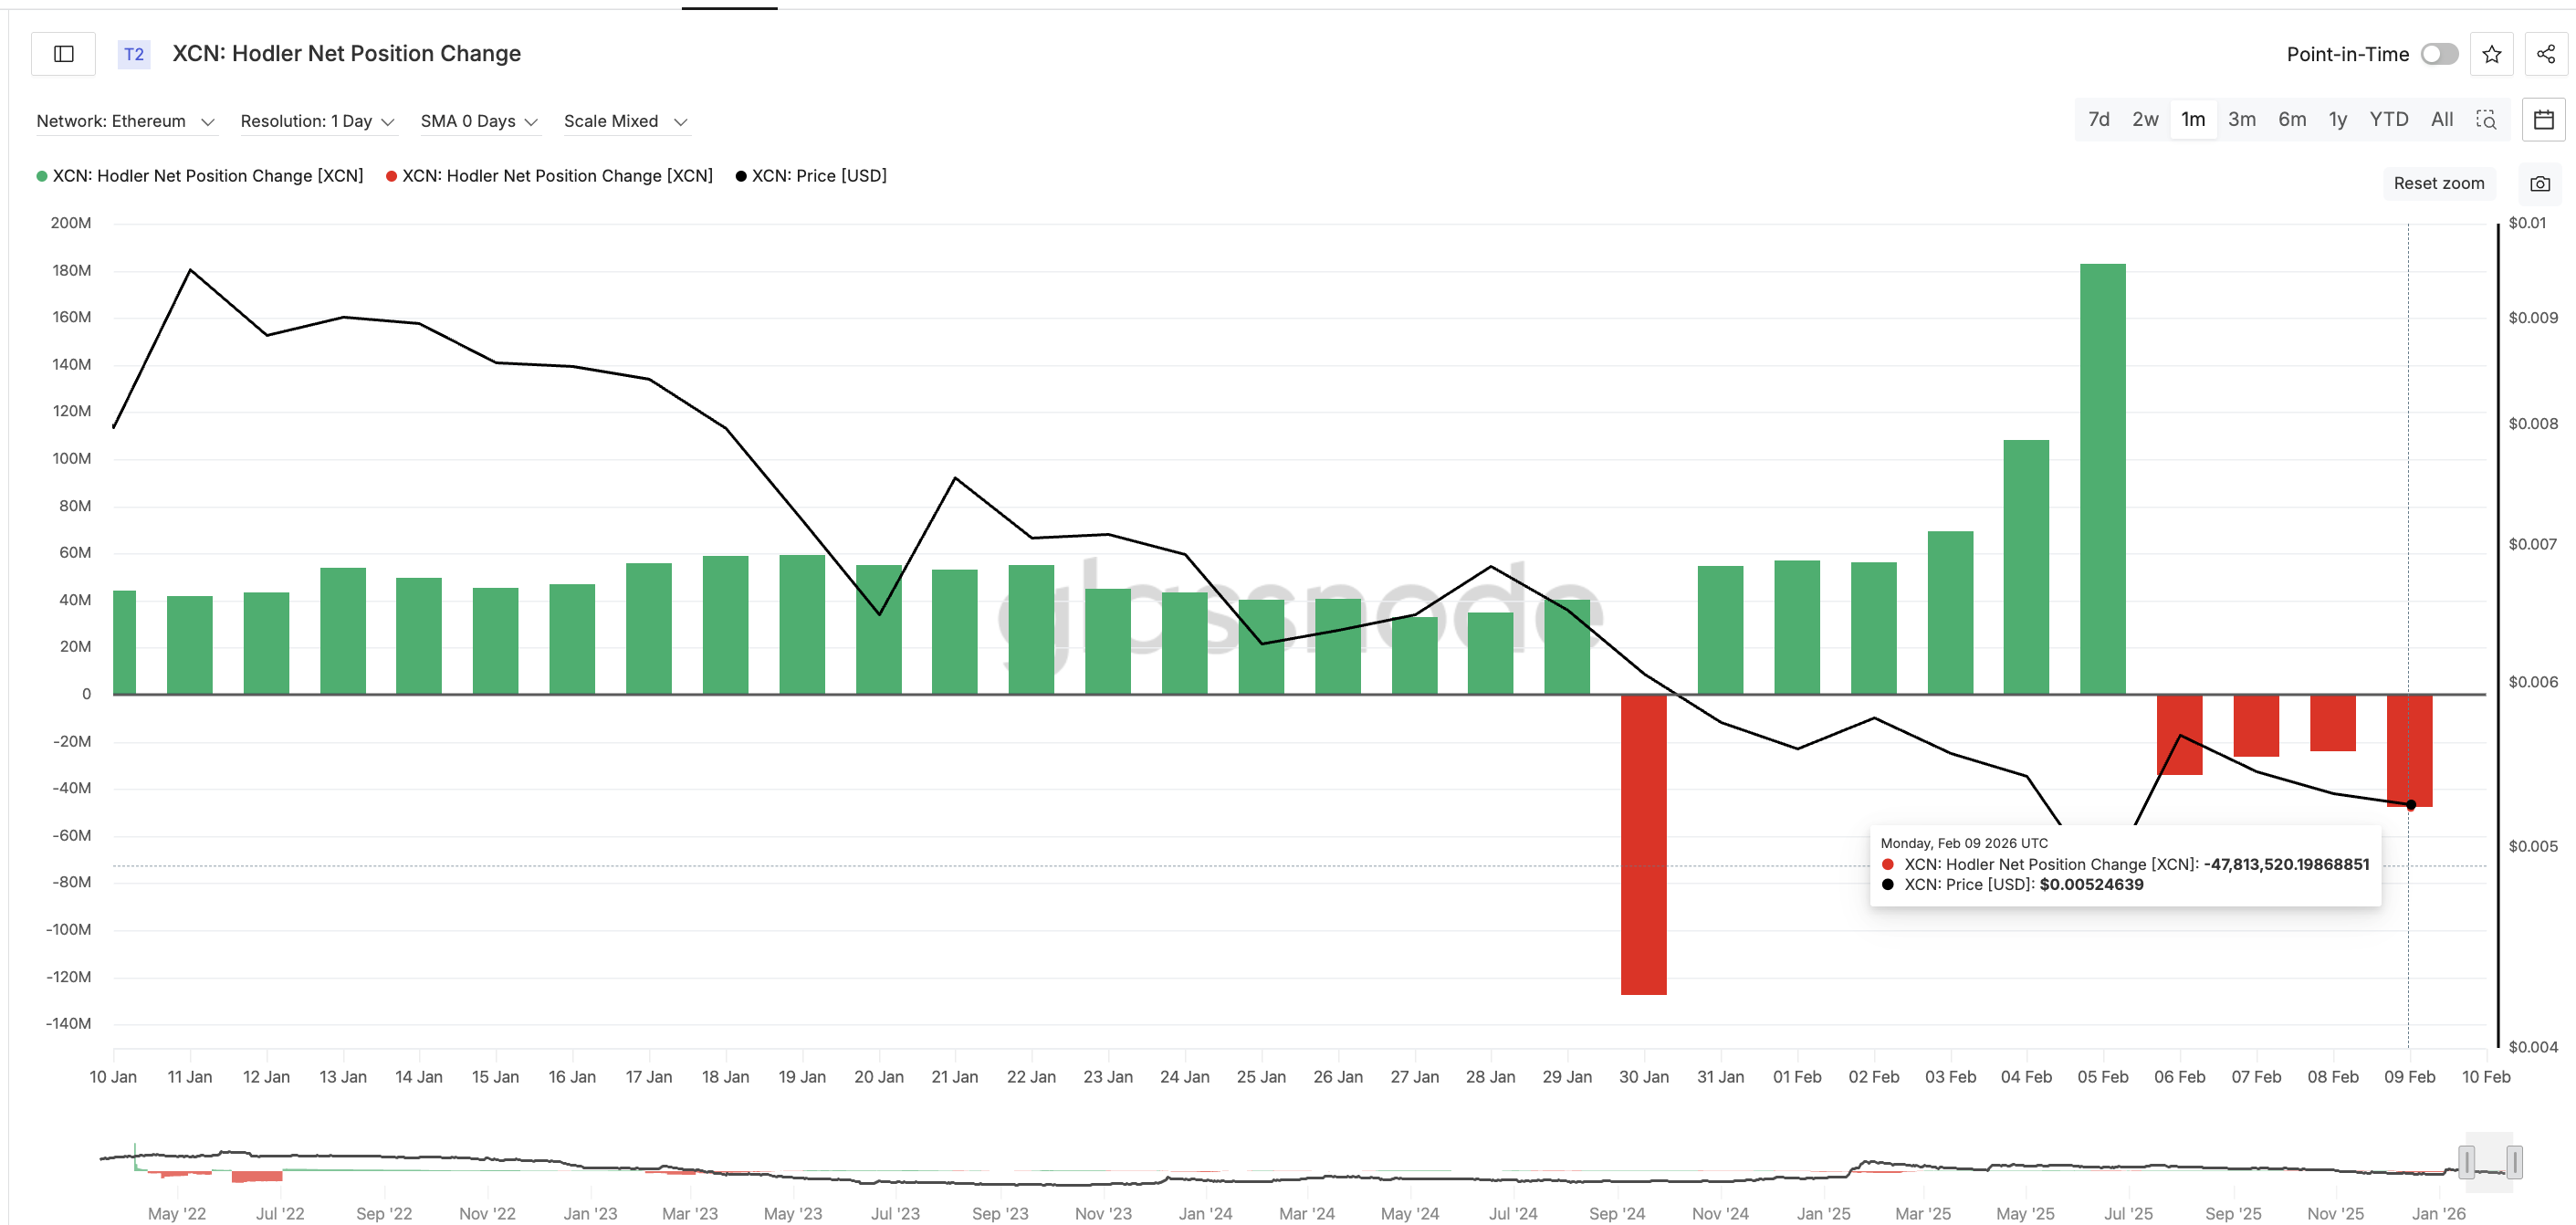 XCN Holders: Glassnode
These are not short-term traders. These are usually investors who held through earlier cycles. When this group starts distributing aggressively, it usually reflects weakening confidence in future recovery.
Whale behavior adds another layer to the story. Large wallets reduced their holdings sharply after February 6, falling from about 52.55 billion XCN to around 48.60 billion. That was a major exit during the prior consolidation. However, holdings have since edged up slightly to around 48.78 billion.
 Whales In Action: Santiment
This small recovery suggests limited dip buying. Whales are not fully abandoning the market. But they are not rebuilding aggressively either. Their partial re-entry appears linked to one remaining support level that could still hold.
If that level fails, this fragile optimism may disappear. To understand why whales are hesitating, we need to look at where most holders possibly bought.
Cost Basis and Onyxcoin Price Levels Show the Last Line of Defense
Cost basis heat maps show where large holders possibly accumulated tokens. These zones often act as support when price revisits them. For Onyxcoin, most major cost clusters have already failed.
Support near $0.0053 and $0.0052 has been broken. The only significant remaining cluster sits near $0.0050, where nearly 3.9 billion XCN are concentrated. This makes $0.0050 the final major demand zone.
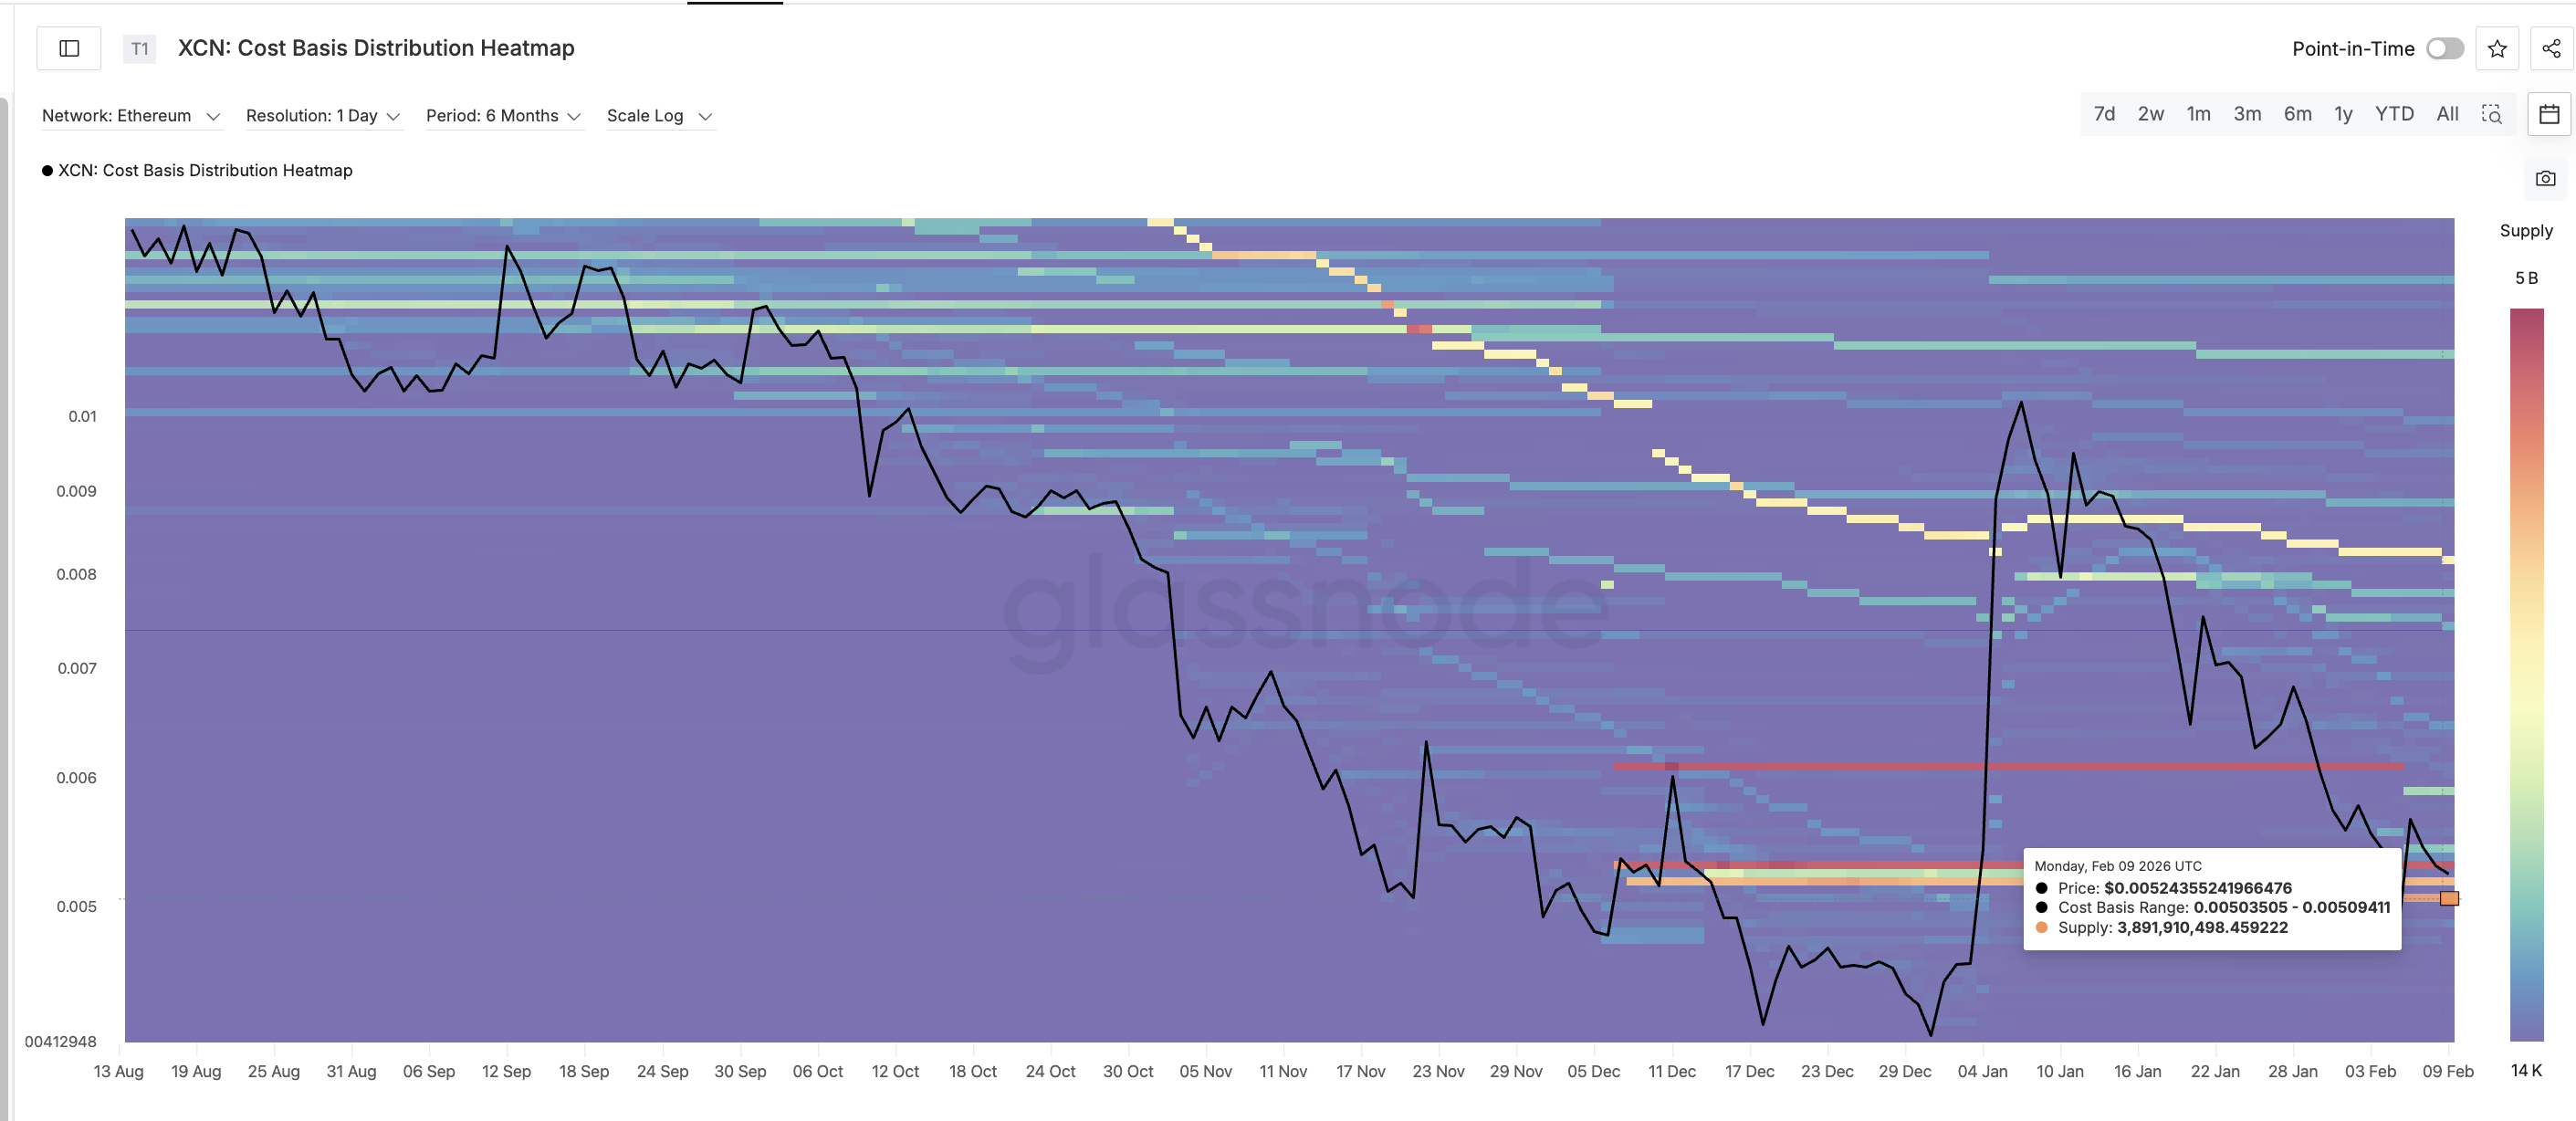 Cost Basis Heatmap: Glassnode
Holders who bought near this level are close to break-even. As long as the price stays above it, they may hold. If it breaks, many will move into losses and may rush to exit due to the lack of conviction and fear of an extended breakdown.
That is where cascading risk emerges. When a major cost basis cluster fails, neutral holders become underwater. Selling accelerates. Liquidity weakens. Fear spreads. This often leads to sharp follow-through declines. The Onyxcoin price structure aligns closely with this data.
Right now, XCN must hold above $0.0050 to avoid further damage. A sustained break below it would confirm the bear flag breakdown and validate continuation lower.
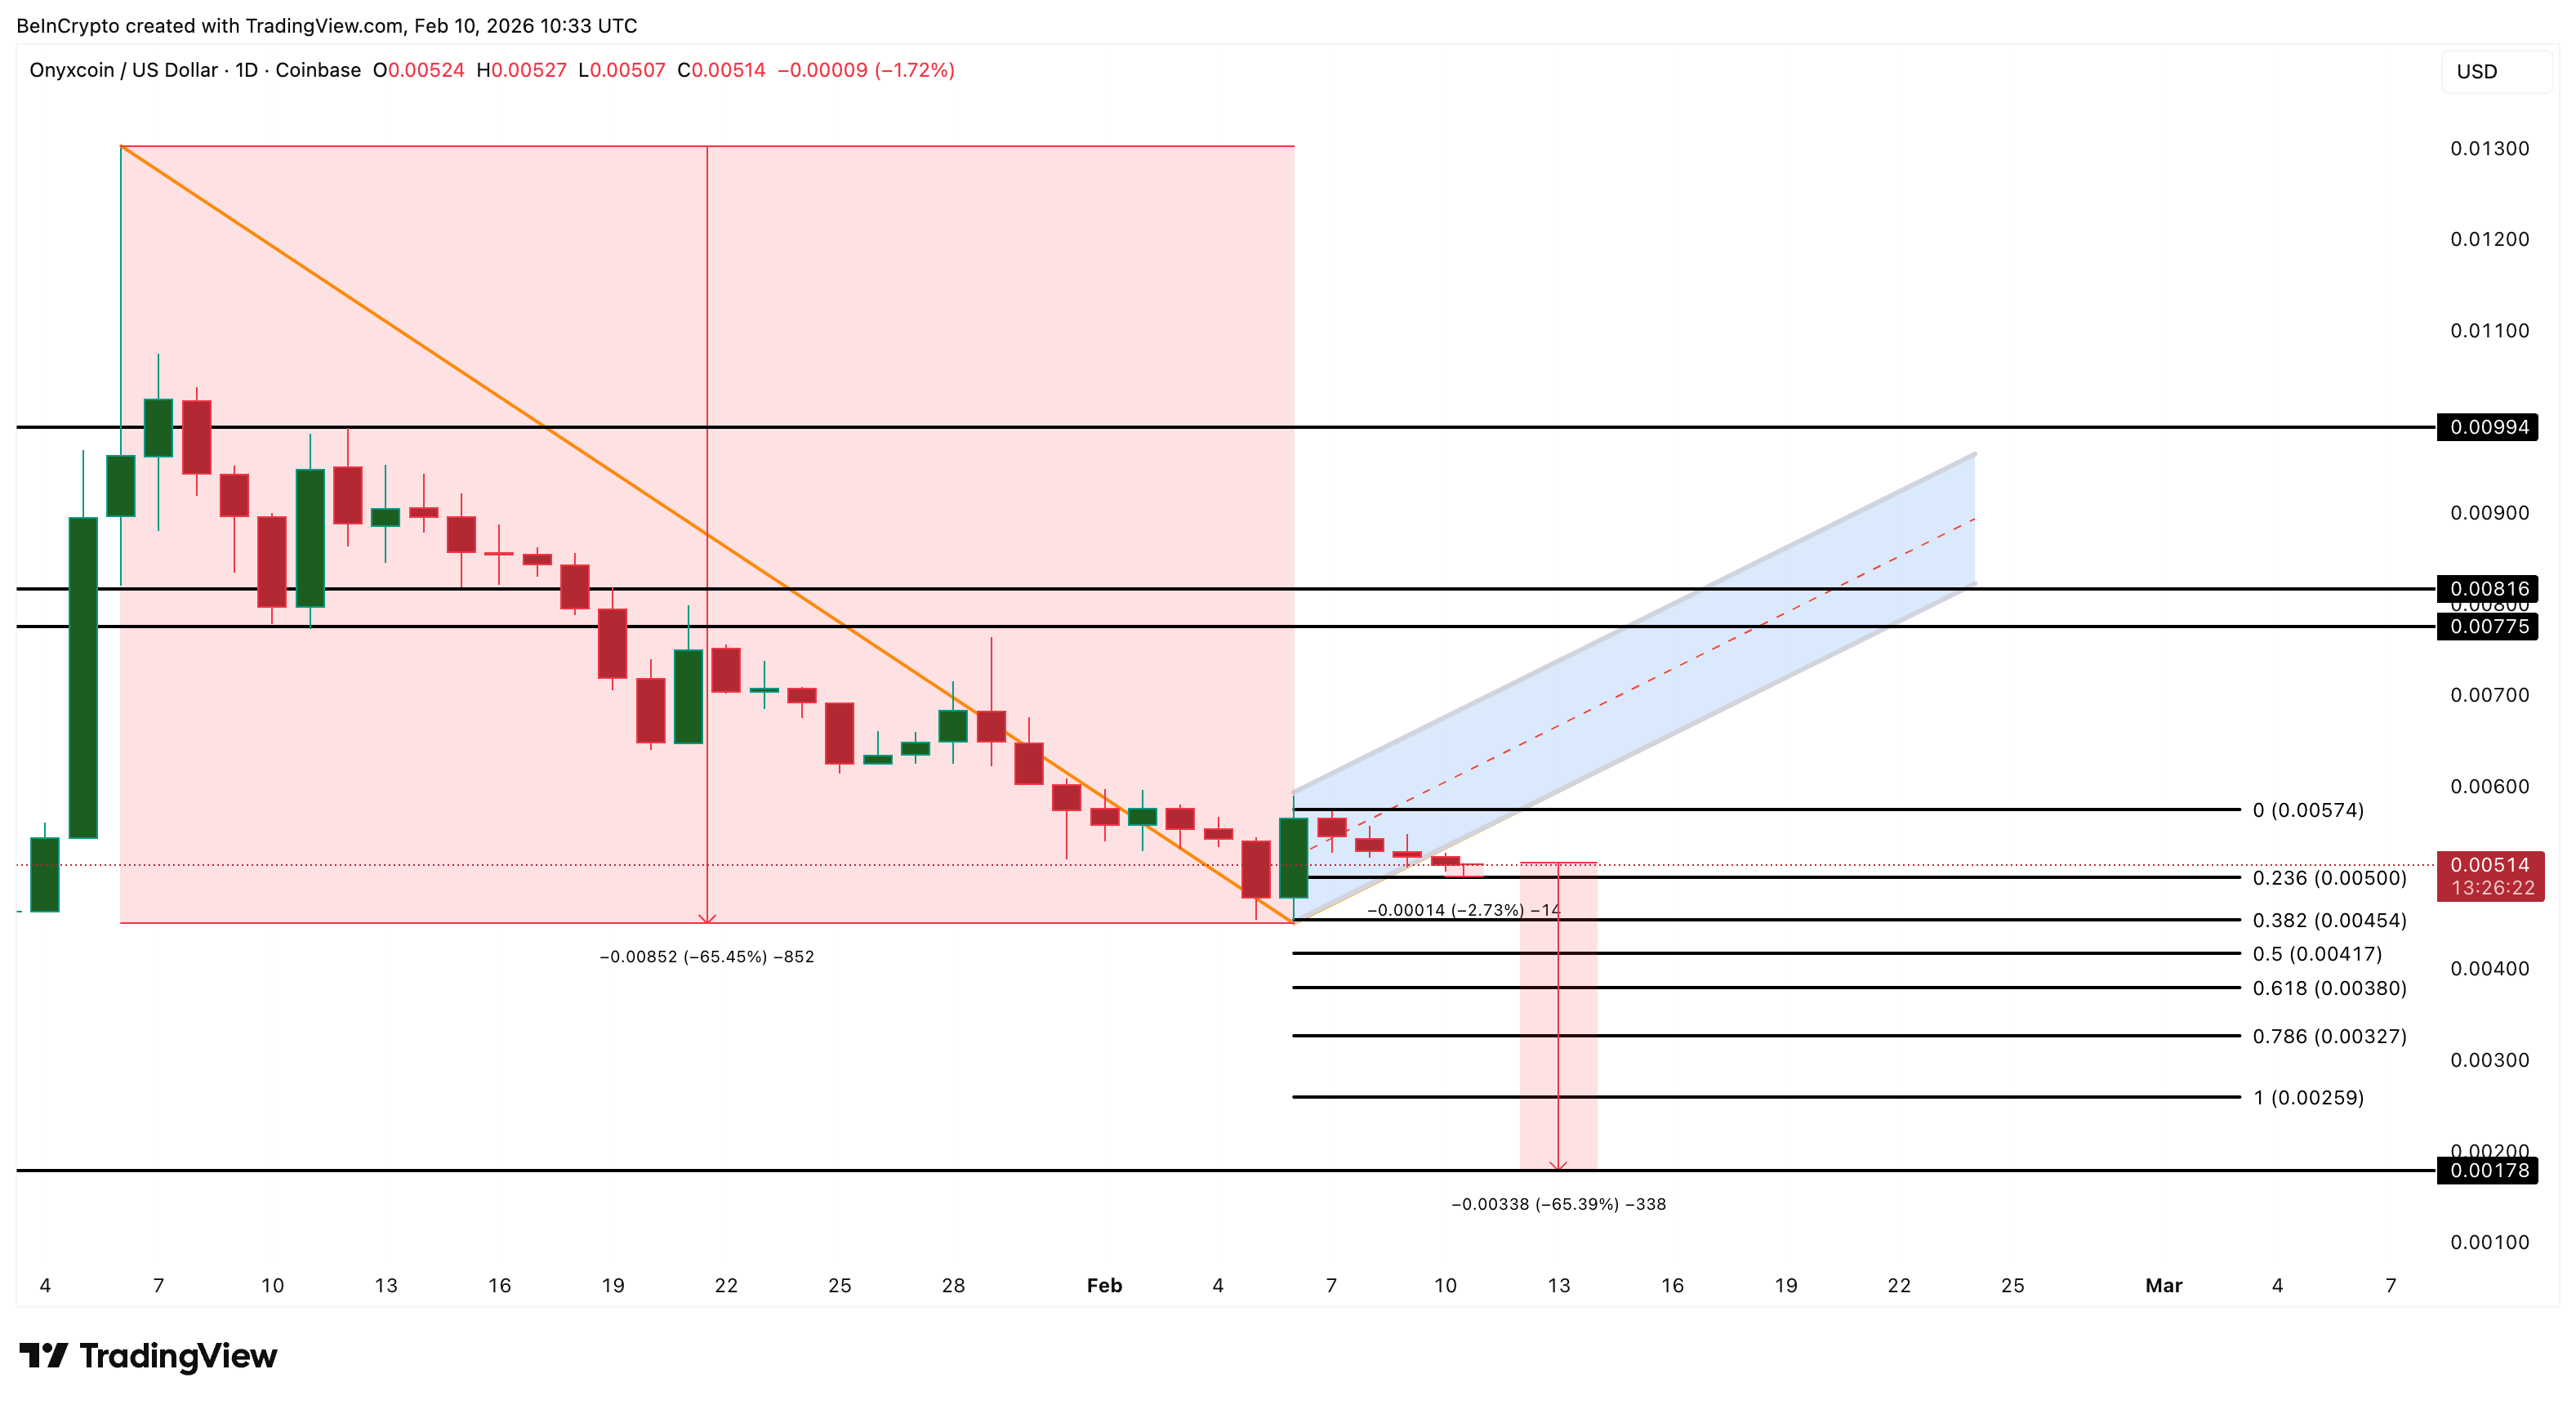 Onyxcoin Price Analysis: TradingView
If that happens, the next major targets sit near $0.0025 and $0.0017. On the upside, recovery remains difficult.
To regain short-term stability, XCN needs to reclaim $0.0057. Above that, $0.0070 and $0.0081 mark key resistance zones. These were former breakdown levels where selling intensified. Full invalidation of the bearish structure would require a move above $0.0099. Until then, rallies are likely to remain corrective.
Recommended Articles


