

Ripple Price Forecast: XRP rally cools as on-chain metric signals profit taking
- XRP fights to hold above the 100-day EMA amid intensified selling pressure around the $2.42 resistance band.
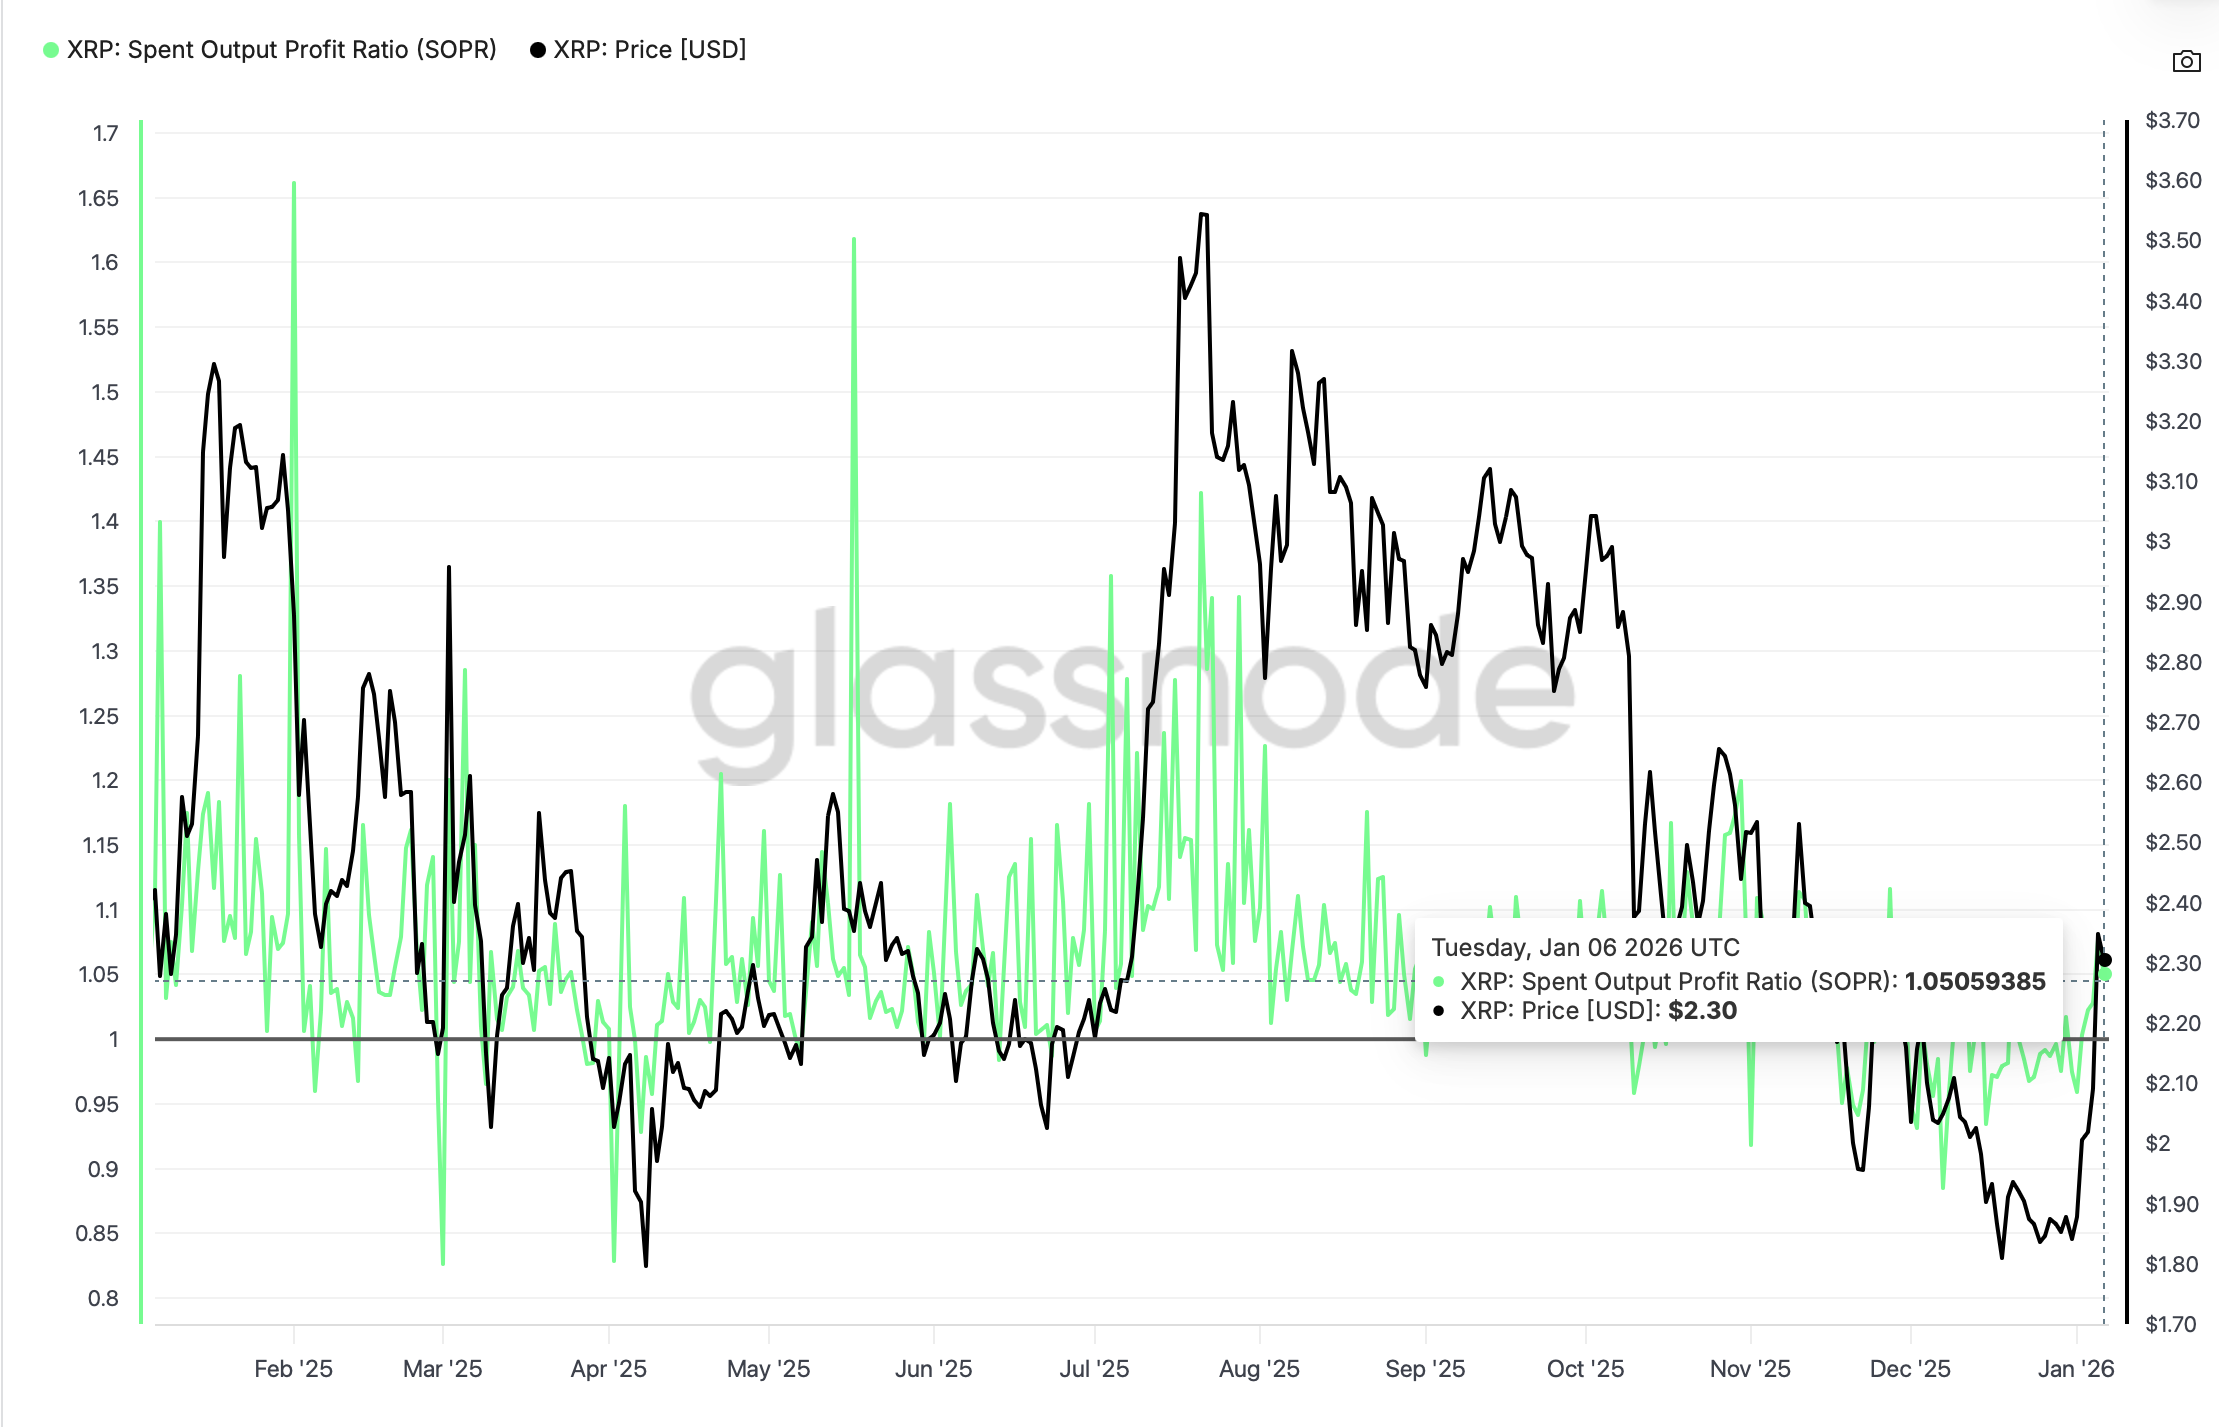
- The SOPR metric has reset after a steady rise since January 1, suggesting profit-taking is increasing.
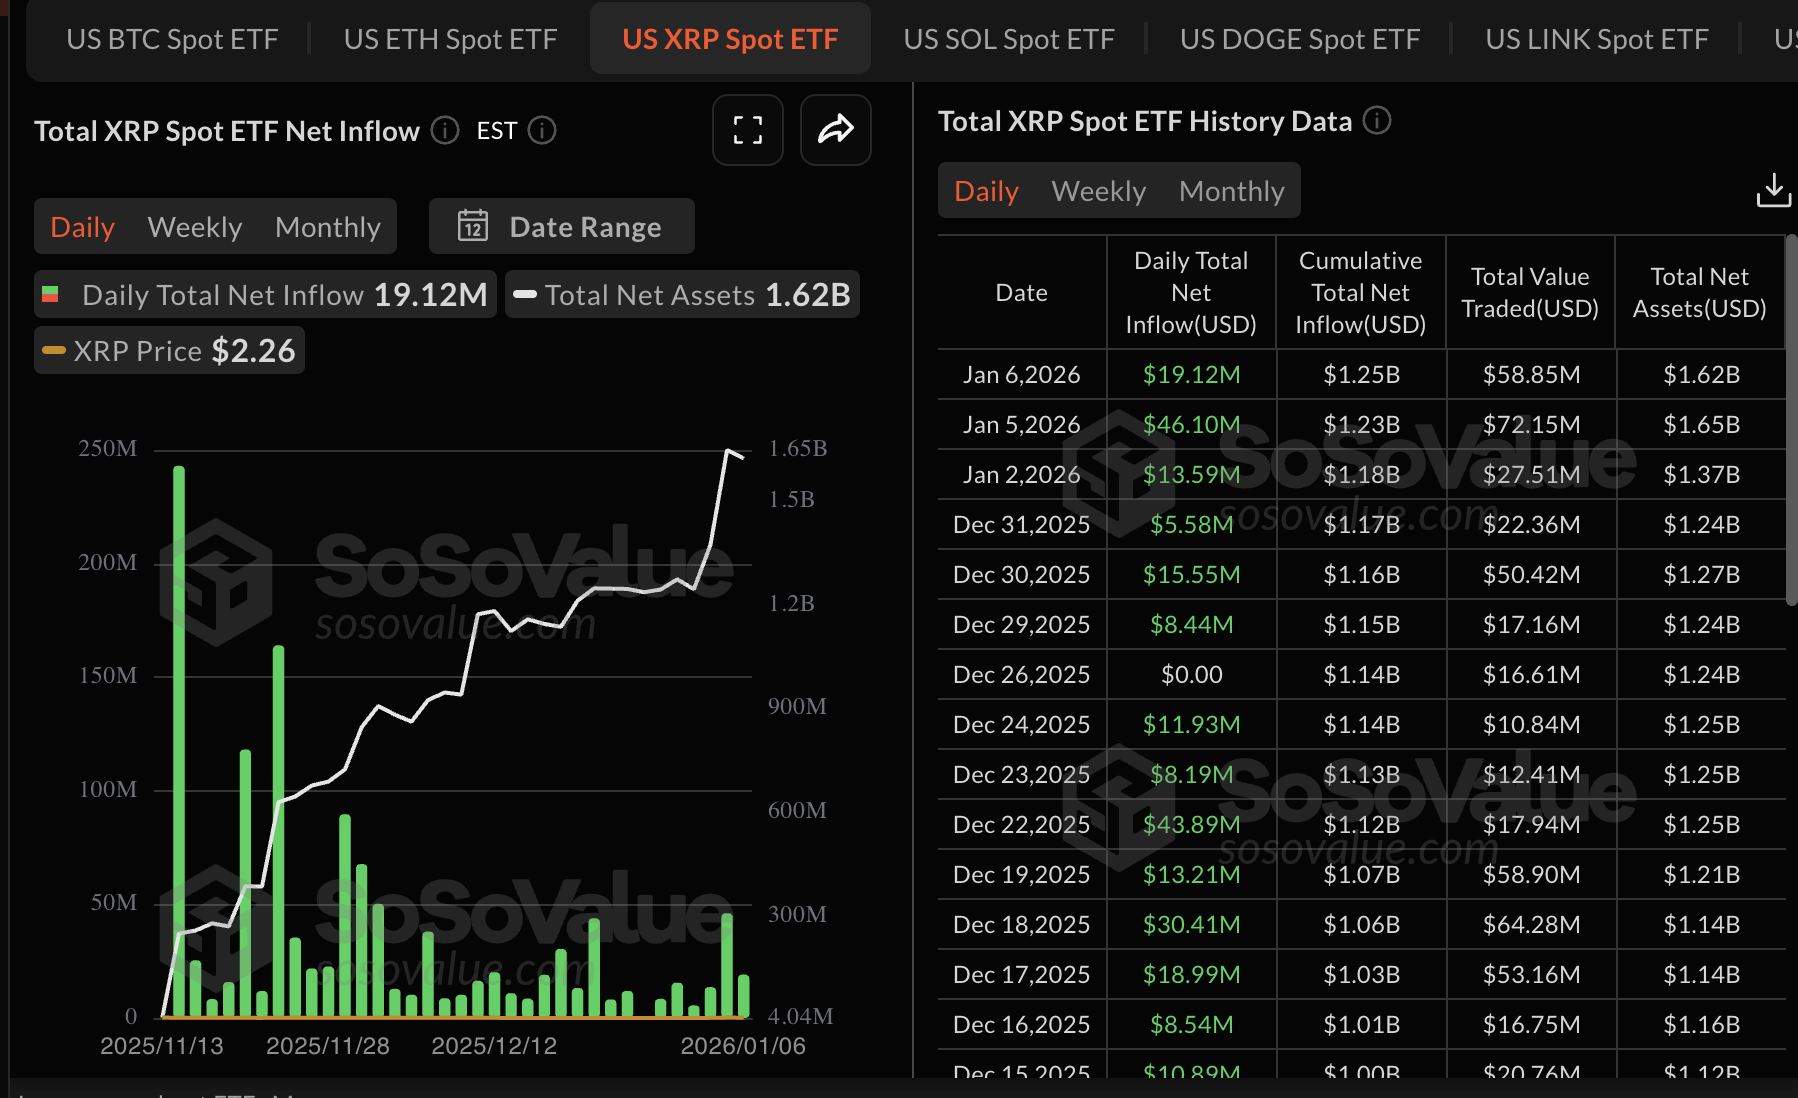
- Institutional interest continues to shape XRP’s bullish outlook, with ETFs recording $19 million in inflows on Tuesday.
Ripple (XRP) is trading downward but holding support at $2.22 at the time of writing on Wednesday, as fear spreads across the cryptocurrency market, reversing gains made from the start of the year. Profit-taking appears to be center stage, as confidence in XRP’s ability to sustain the uptrend falters.
A break above a multi-month descending trendline could set XRP toward the $3.00 target. However, a close below a short-term support level at $2.22 could test demand at $2.00, potentially leaving XRP vulnerable to an extended slump.
XRP SOPR metric resets amid profit-taking
The Spent Output Profit Ratio (SOPR) on-chain metric, computed by dividing realized value (price sold) and the value of XRP at creation (price paid), is resetting. Glassnode data shows the metric at 1.05 as of Tuesday, down from 1.08 the previous day.
As the SOPR declines, it indicates that investors are selling and realizing profit, and in the process adding to the headwinds. Further decline below the mean line at 1.00 would mean XRP is oversold, creating fresh opportunities for investors to lean into risk.
XRP ETFs, on the other hand, saw inflows of approximately $19 million on Tuesday, a significant drop from the $46 million recorded on Monday.
Despite the decline in volume, interest in US-listed XRP ETFs has steadied since their debut in November, boosting cumulative inflows to $1.25 billion and related net assets to $1.62 billion.
Technical outlook: XRP holds key support
XRP is trading down but holding onto a short-term support provided by the 100-day Exponential Moving Average (EMA) at $2.22 at the time of writing on Wednesday. The correction follows an early-year rally that signalled a bullish shift, but it encountered resistance around the 200-day EMA at $2.34 and a descending trendline on the daily chart.
The Relative Strength Index (RSI) has fallen to 64 on the same chart from a brief ascent into overbought territory, indicating fading bullish momentum. A further decline toward the midline could keep the trend bearish and increase the odds of XRP sliding below the 100-day EMA at $2.22.
Closing below this moving average will likely trigger an extended correction that could test the 50-day EMA at $2.07.
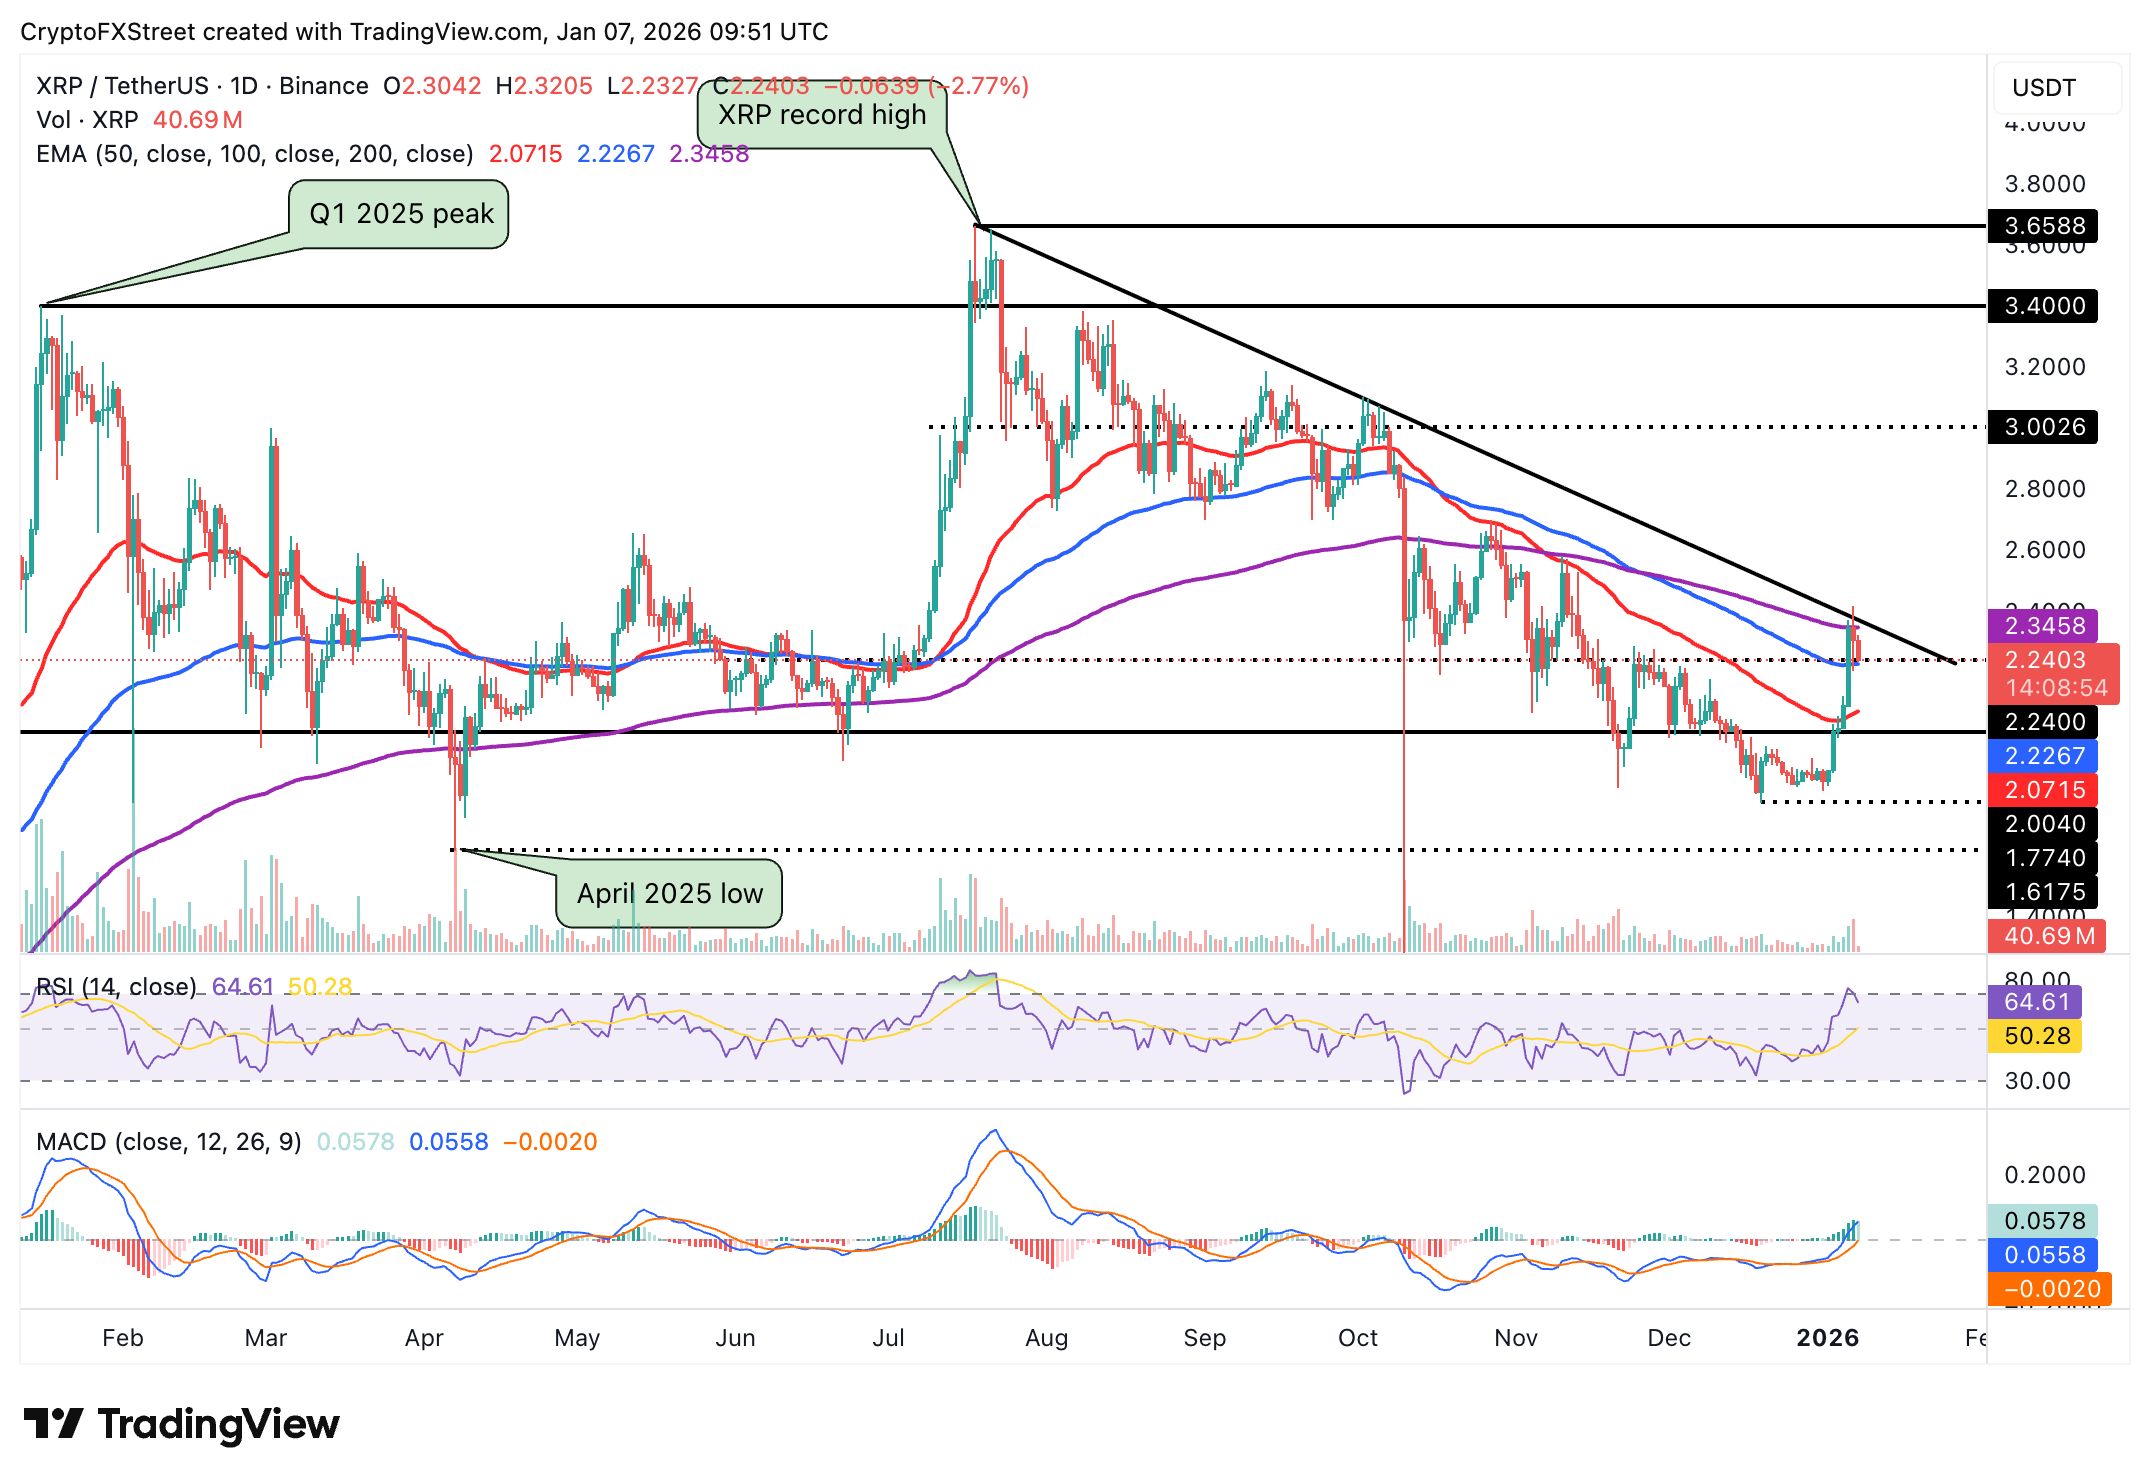
Still, traders may lean on the Moving Average Convergence Divergence (MACD) indicator, which continues to show positive divergence on the same chart, as a buy signal amid optimism for a larger breakout above the descending trendline.
Cryptocurrency metrics FAQs
The developer or creator of each cryptocurrency decides on the total number of tokens that can be minted or issued. Only a certain number of these assets can be minted by mining, staking or other mechanisms. This is defined by the algorithm of the underlying blockchain technology. On the other hand, circulating supply can also be decreased via actions such as burning tokens, or mistakenly sending assets to addresses of other incompatible blockchains.
Market capitalization is the result of multiplying the circulating supply of a certain asset by the asset’s current market value.
Trading volume refers to the total number of tokens for a specific asset that has been transacted or exchanged between buyers and sellers within set trading hours, for example, 24 hours. It is used to gauge market sentiment, this metric combines all volumes on centralized exchanges and decentralized exchanges. Increasing trading volume often denotes the demand for a certain asset as more people are buying and selling the cryptocurrency.
Funding rates are a concept designed to encourage traders to take positions and ensure perpetual contract prices match spot markets. It defines a mechanism by exchanges to ensure that future prices and index prices periodic payments regularly converge. When the funding rate is positive, the price of the perpetual contract is higher than the mark price. This means traders who are bullish and have opened long positions pay traders who are in short positions. On the other hand, a negative funding rate means perpetual prices are below the mark price, and hence traders with short positions pay traders who have opened long positions.
Recommended Articles


