

Tron Price Forecast: TRX on verge of breakout as Wirex partnership and metrics signal bullish move
- Tron price nears key resistance zone on Wednesday, with a firm close above suggesting a bullish move ahead.
- Wirex announced a strategic collaboration with TRON DAO to deliver a native on-chain payment layer, highlighting the growing network adoption.
- On-chain and derivatives data indicate positive sentiment, with the TRX stablecoin market capitalization rising steadily alongside long bets.
Tron (TRX) price trades above $0.29 on Wednesday, nearing a key resistance zone. A decisive close above this zone signals a rally ahead. The bullish narrative strengthened on Tuesday, as optimism around the strategic partnership with Wirex, along with positive on-chain and derivatives data, suggests a potential rally for TRX.
Growing adoption of the Tron network
Wirex, a global digital payments platform with stablecoin infrastructure, announced on Tuesday a strategic collaboration with TRON DAO. This partnership aims to deliver a payment layer that enables instant, autonomous, and global on-chain value transfer natively on Tron’s network.
This development is broadly bullish for TRON’s native token, TRX, over the long term, as it enhances network adoption, improves liquidity and expands the token’s utility across payment ecosystems.
In the short term, traders responded modestly, with TRX trading slightly higher the day after the announcement, at around $0.29.

Tron’s bullish on-chain and derivatives metrics
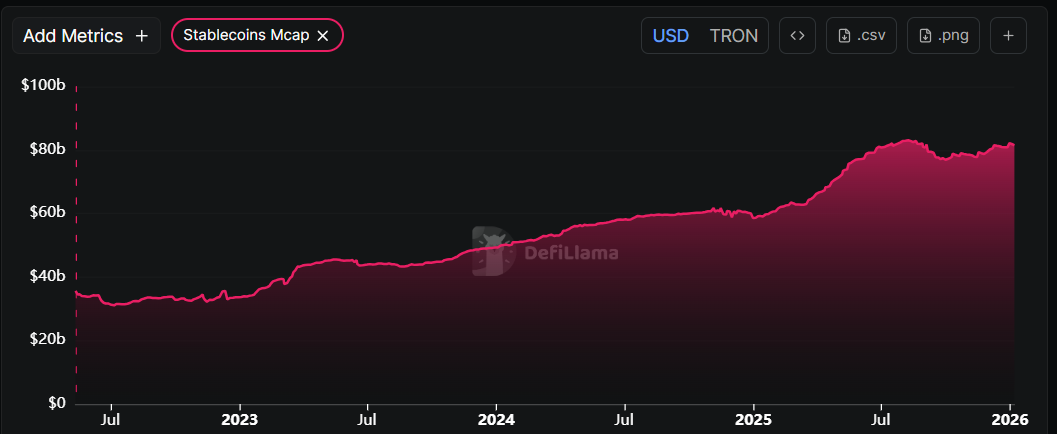
DefiLama data shows that TRX’s stablecoin total supply has risen since the end of December and currently stands at $81.79 billion, nearing the record high of $83 billion in early August. Such stablecoin activity and value increase on the Tron project indicate a bullish outlook, as they boost network usage and can attract more users to the ecosystem.
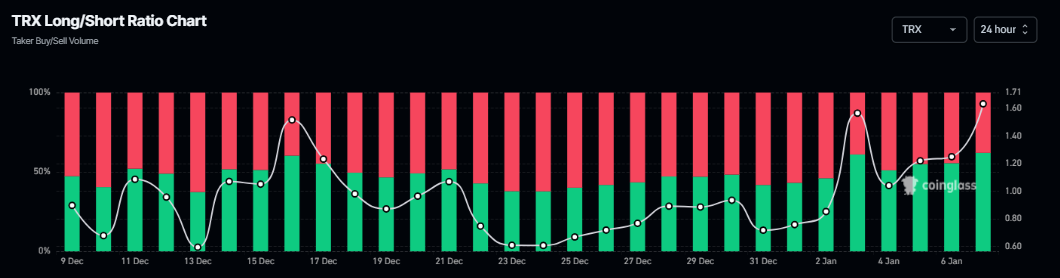
Apart from the rising stablecoin activity and market capitalization, Tron’s derivative data also suggests a potential price rally. Coinglass’s long-to-short ratio for TRX reads 1.60 on Wednesday, the highest level over a month. The ratio above one suggests that more traders are betting on TRX’s price to rally.
Tron Price Forecast: TRX could rally if it closes above $0.29
Tron price broke above the 50-day Exponential Moving Average (EMA) at $0.28 on Thursday and rose over 3% through Saturday, retesting the daily resistance at $0.29. TRX failed to close above this resistance zone and declined slightly over the next two days. As of writing on Wednesday, TRX is trading at $0.29, reattempting to break above the daily resistance zone.
If TRX closes above the daily resistance at $0.29, it could extend the rally toward the October 22 high of $0.32.
The Relative Strength Index (RSI) on the daily chart reads 64, above the neutral level of 50, indicating bullish momentum is gaining traction. In addition, the Moving Average Convergence Divergence (MACD) indicator shows a bullish crossover and rising green histogram bars above the neutral level, further supporting the bullish outlook.
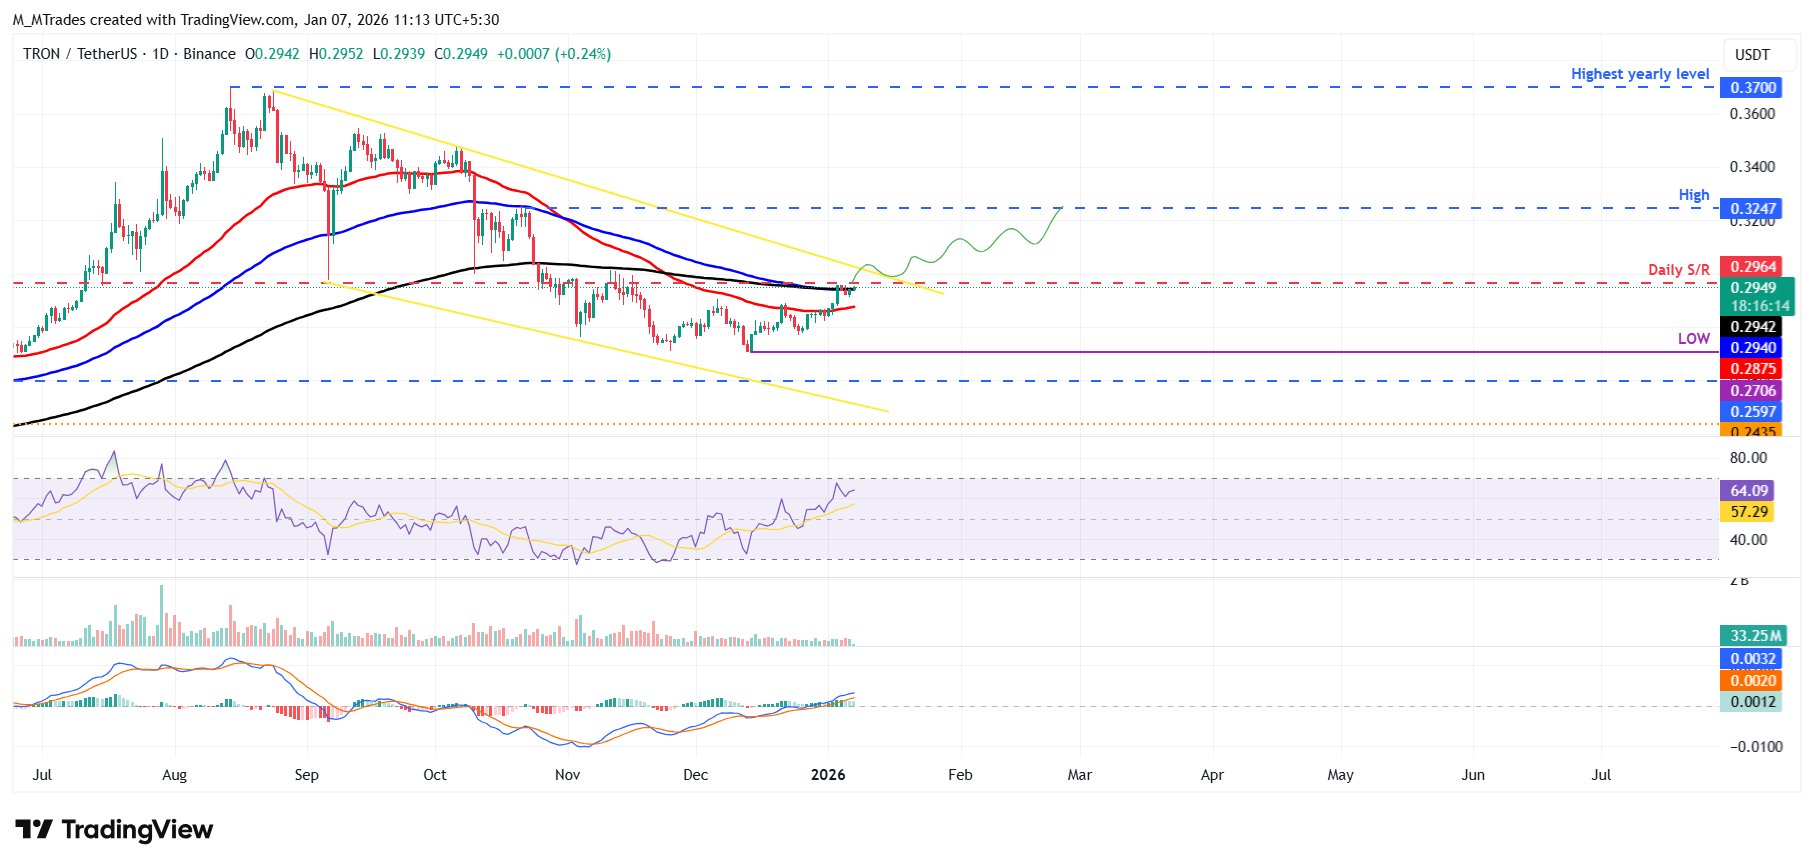
However, if TRX faces a correction, it could extend the decline toward the 50-day EMA at $0.28.
Recommended Articles


