

Cardano Price Forecast: ADA holds steady as bulls intensify push for breakout
- Cardano rises above the 50-day EMA resistance amid a risk-on mood across the crypto market.
- The MACD upholds positive divergence, increasing the potential for a 20% breakout to $0.505.
- The ADA derivatives market shows strength, but a slight dip in futures Open Interest could threaten the uptrend.
Cardano (ADA) is trading at $0.424 at the time of writing on Tuesday, reflecting positive sentiment in the broader cryptocurrency market.
Despite geopolitical tensions in South America over the weekend capture of Venezuelan President Nicolas Maduro by the United States (US), the crypto market has maintained a notable calm.
ADA showcases a short-term bullish outlook, with several technical indicators aligning in support. However, investors should be cautious, as the futures market is experiencing a slight dip that could hinder the anticipated breakout.
Cardano edges higher, but headwinds still cap rally
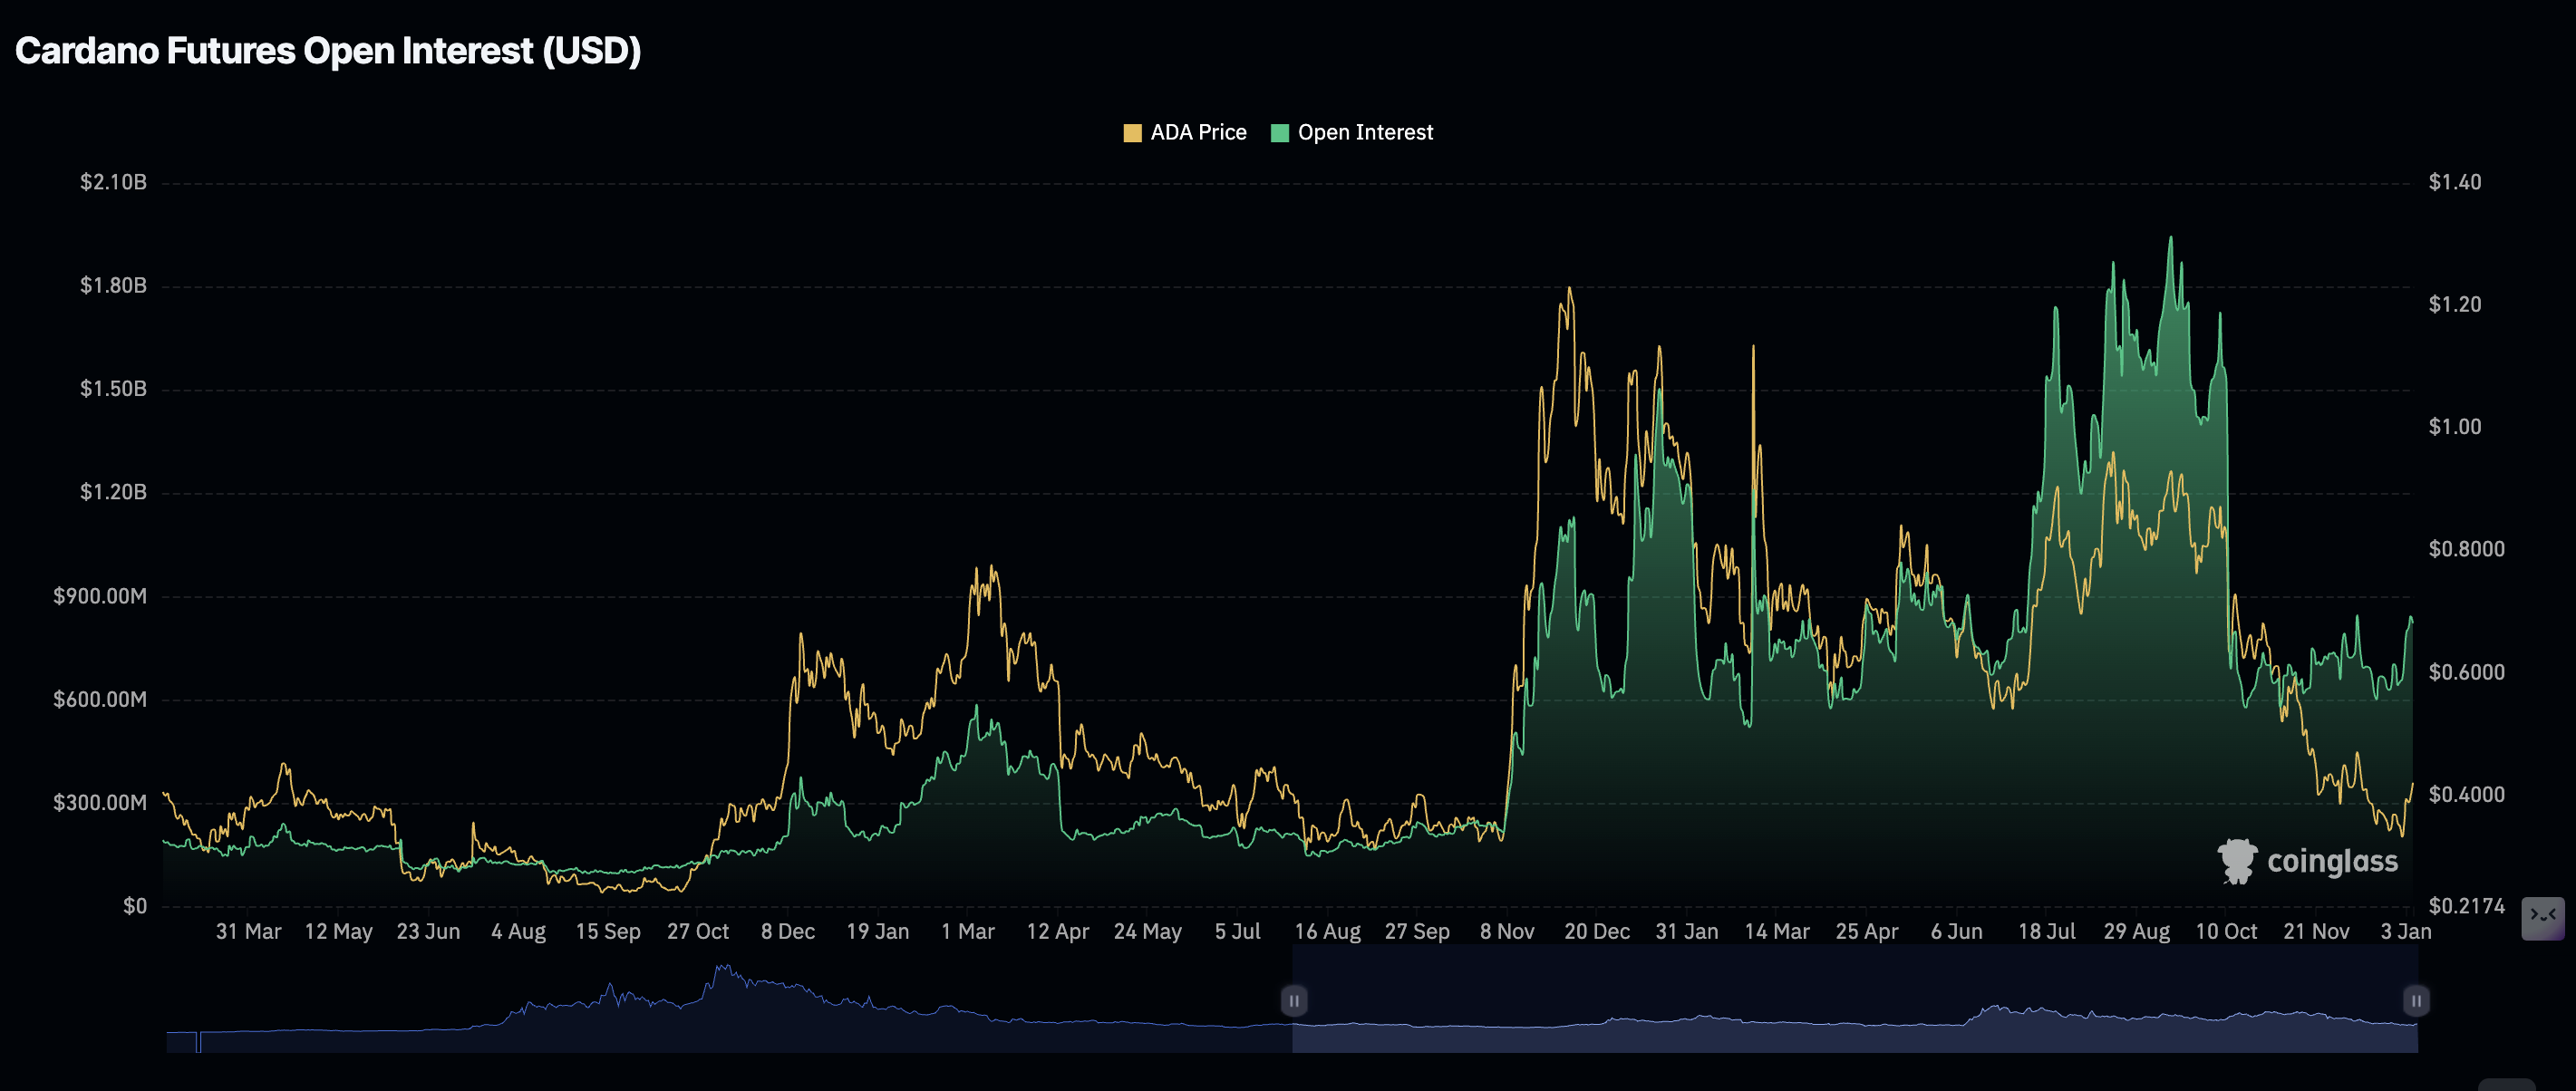
Cardano is rising for the third consecutive day, supported by several technical indicators. However, fundamental metrics such as futures Open Interest (OI) send a subtle signal, warning investors to tread with caution.
After rising to approximately $844 million on Monday from $662 million on last Thursday, the OI representing the notional value of outstanding futures contracts has declined to $824 million on Tuesday, hinting at potential profit-taking or a cautious retail market.
A steadily rising OI indicates that traders are confident Cardano has the potential to sustain a short-term recovery. This confidence encourages retail investors to lean into risk, which contributes to buying pressure.
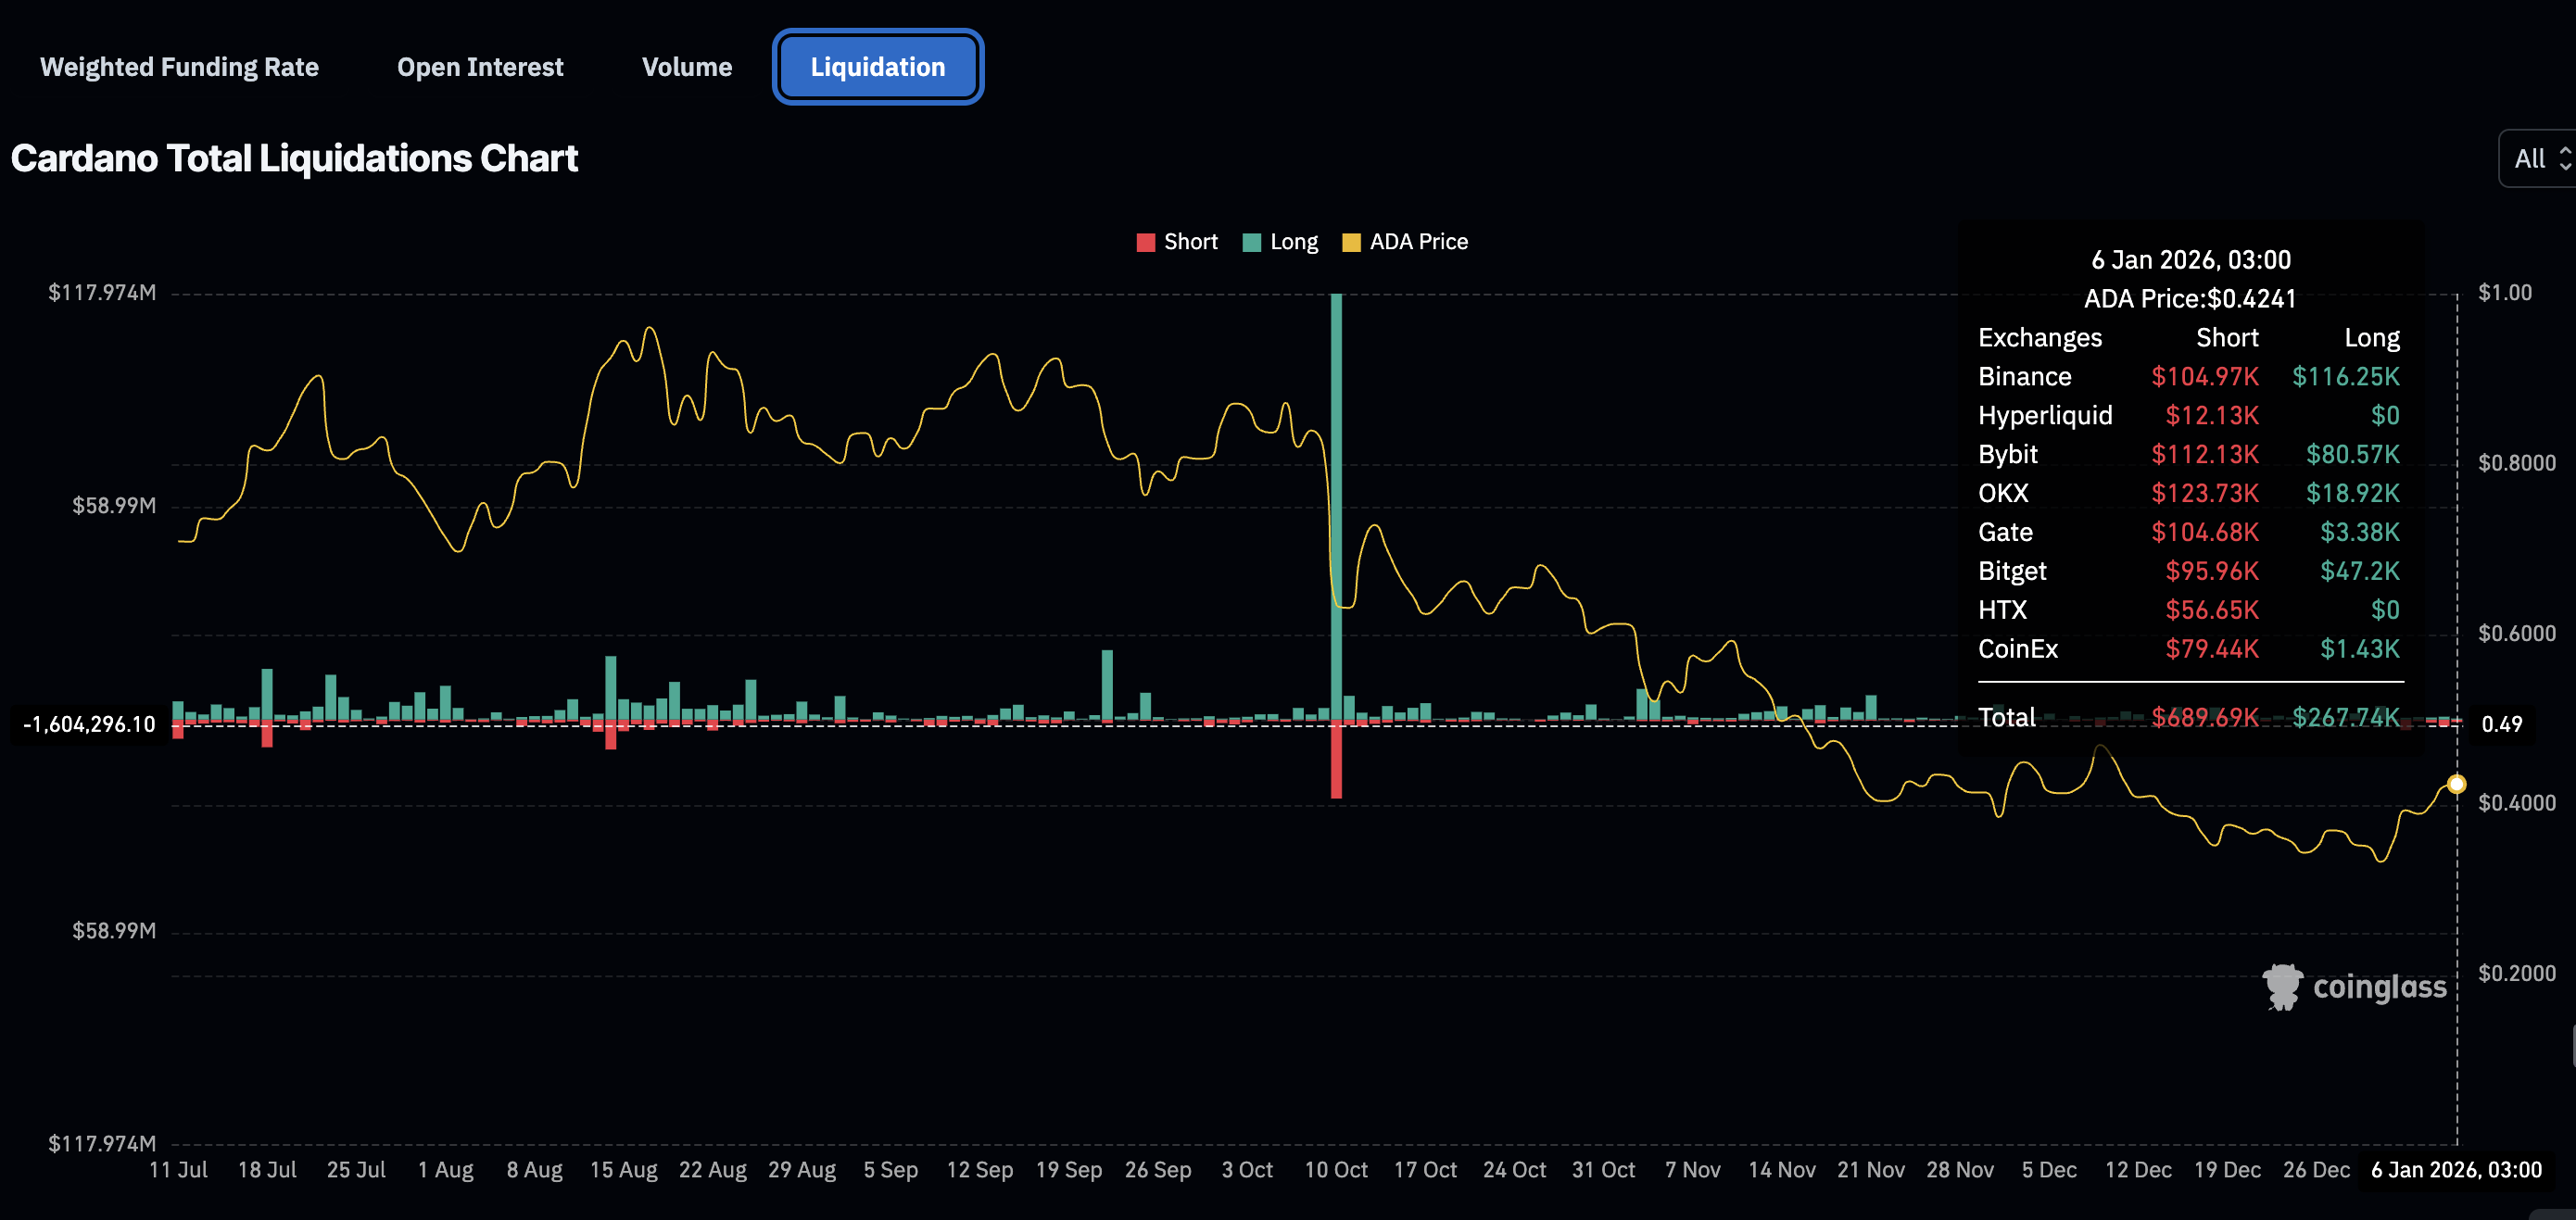
Meanwhile, liquidations at the time of writing on Tuesday averaged $690,000 in short positions and approximately $268,000 in longs. As the ADA price rises, it forces traders to unwind their short positions, which contributes to a tailwind that steadies the uptrend.
Technical outlook: ADA consolidates amid lingering breakout
Cardano is trading above the 50-day Exponential Moving Average (EMA) at $0.423 on Tuesday. The token’s short-term outlook remains bullish, supported by the Moving Average Convergence Divergence (MACD) indicator, which has maintained a positive divergence above the signal line since December 28. The green histogram bars expanding above the mean line encourage traders to increase their risk exposure.
A close above the 50-day EMA would defend Cardano’s bullish thesis for an approximately 20% rise to test the 100-day EMA resistance at $0.505. Above this level, the 200-day EMA caps the upside at $0.593.
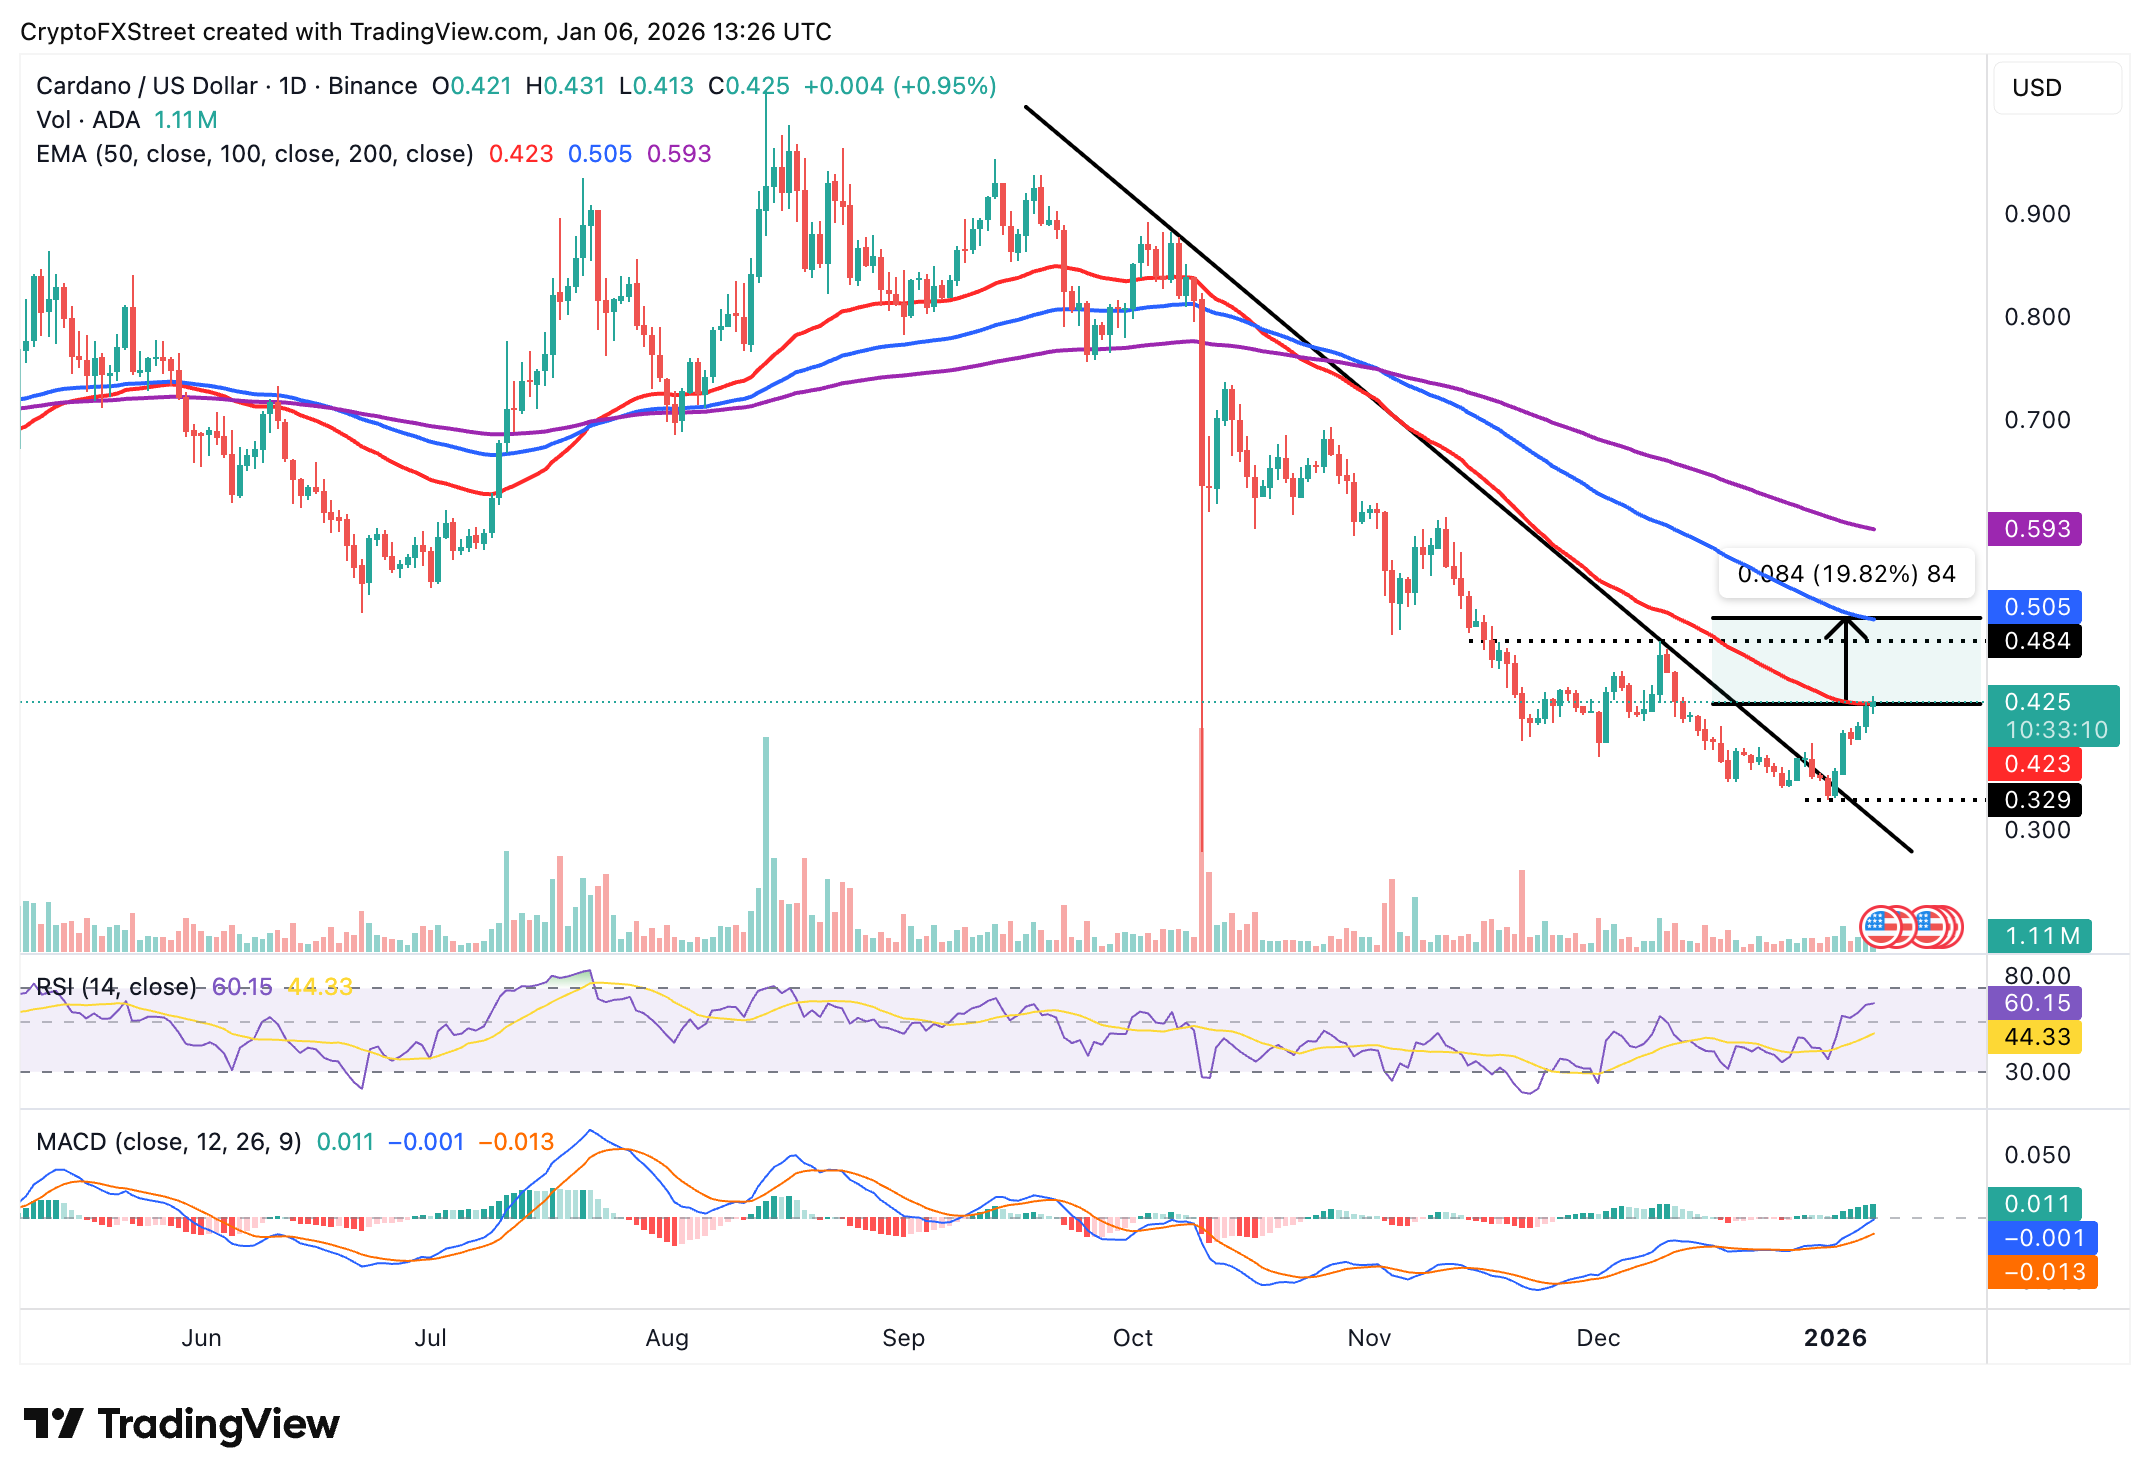
Still, the Relative Strength Index (RSI) at 59 on the daily chart has stalled, indicating that buying pressure could be shrinking. A decline in the RSI below the midline would jeopardize ADA’s potential breakout and could trigger a correction below the $4.00 level.
Open Interest, funding rate FAQs
Higher Open Interest is associated with higher liquidity and new capital inflow to the market. This is considered the equivalent of increase in efficiency and the ongoing trend continues. When Open Interest decreases, it is considered a sign of liquidation in the market, investors are leaving and the overall demand for an asset is on a decline, fueling a bearish sentiment among investors.
Funding fees bridge the difference between spot prices and prices of futures contracts of an asset by increasing liquidation risks faced by traders. A consistently high and positive funding rate implies there is a bullish sentiment among market participants and there is an expectation of a price hike. A consistently negative funding rate for an asset implies a bearish sentiment, indicating that traders expect the cryptocurrency’s price to fall and a bearish trend reversal is likely to occur.
Recommended Articles


