

Pi Coin Price Triangle Breakout Is Backed by Multi-Sided Momentum
Pi Coin is demonstrating a notable shift in momentum after remaining constrained within a key technical pattern for several days.
The altcoin is showing early signs of strength, but its ability to break out will depend heavily on market conditions and sustained investor support. With volatility building, Pi Coin is approaching a decisive moment.
Pi Coin Has Support
The Chaikin Money Flow offers an encouraging signal for Pi Coin. CMF has climbed to 0.16, indicating consistent inflows as investors continue to fund the altcoin’s rise. This indicator measures capital movement, and a rising trend reflects growing confidence among traders expecting a near-term price increase.
While the 0.20 level is historically viewed as a critical reversal threshold, Pi Coin has not reached that point yet. Until it does, the asset maintains strong backing from investors, giving it room to extend its upward momentum. Sustained inflows will be essential for any successful breakout.
Want more token insights like this? Sign up for Editor Harsh Notariya’s Daily Crypto Newsletter here.
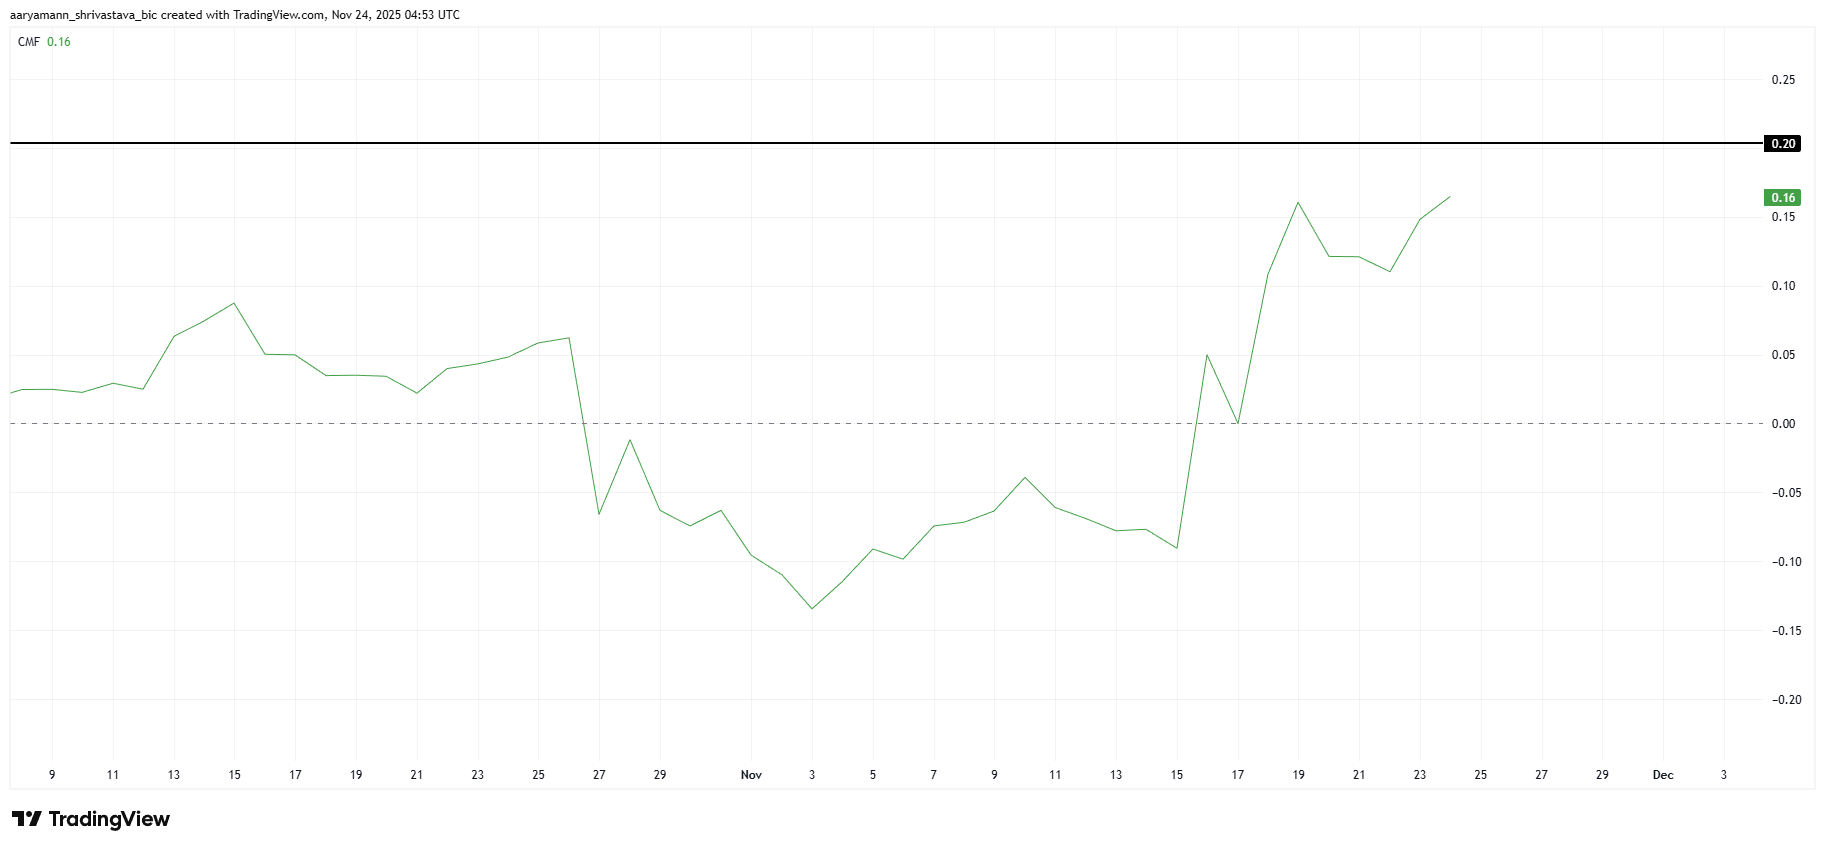 Pi Coin CMF. Source: TradingView
Macro momentum indicators reinforce Pi Coin’s strengthening position. The squeeze momentum indicator is currently showing a tightening squeeze as green bars rise, signaling growing bullish momentum. This pattern often precedes a sharp price move once the squeeze is released.
If the bullish momentum remains intact during the release, Pi Coin may experience a volatility surge that supports a substantial price rise. This setup indicates that broader market forces are aligning in favor of PI, strengthening the case for an imminent breakout.
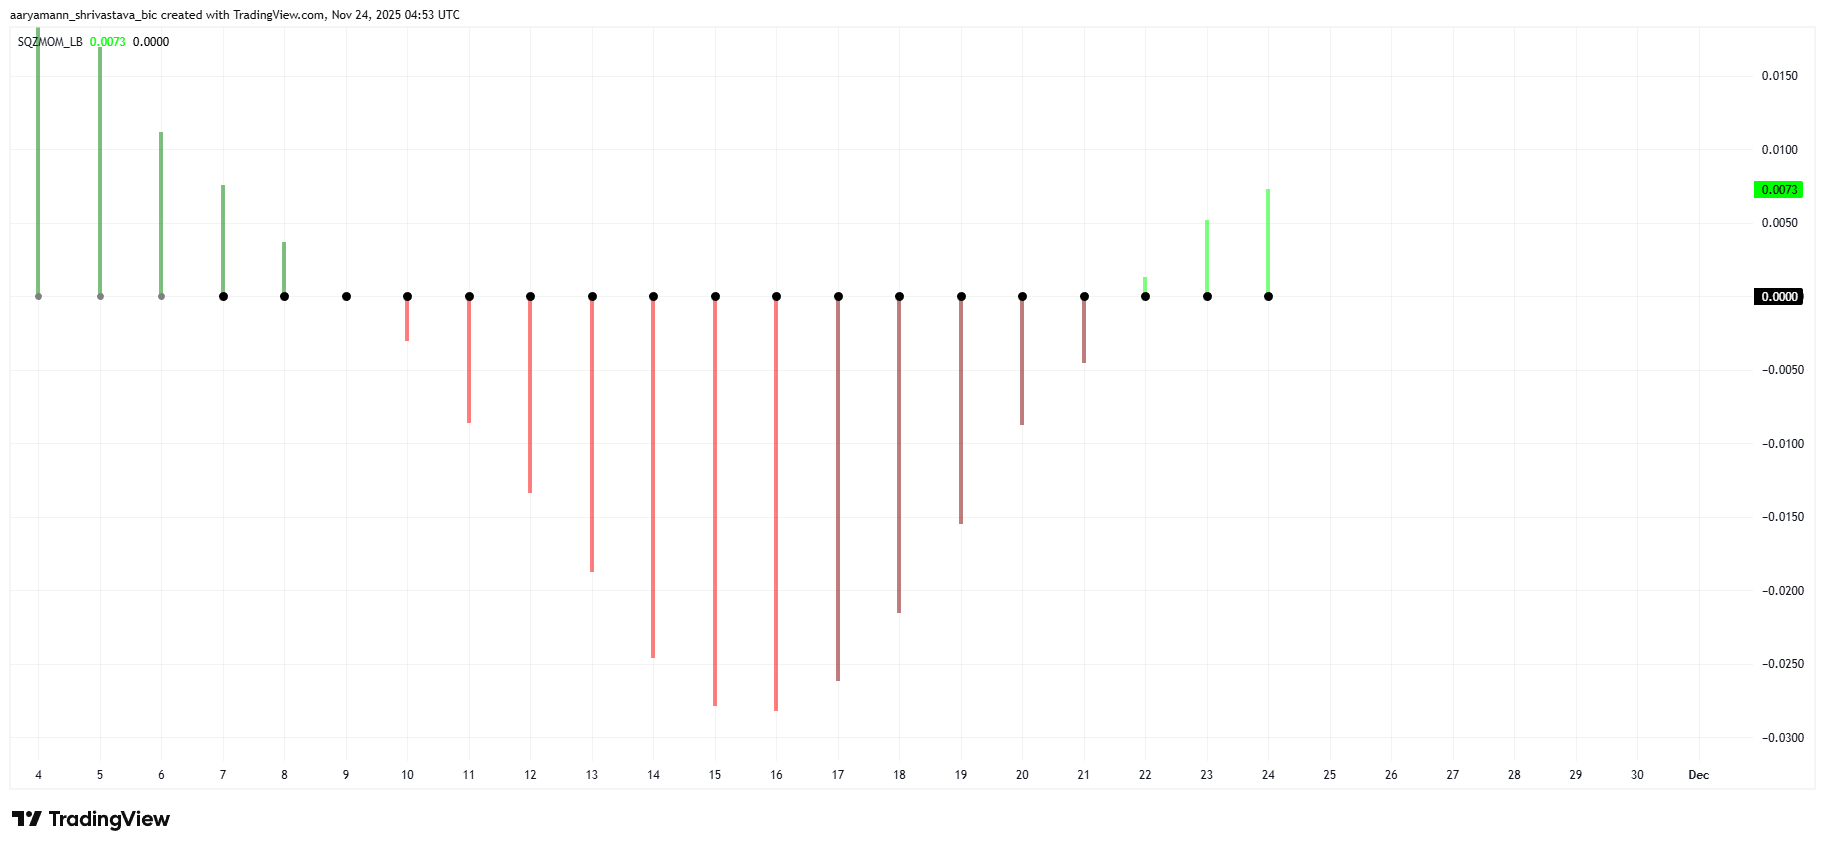 Pi Coin Squeeze Momentum Indicator. Source: TradingView
PI Price Can Break Out
Pi Coin trades at $0.241 while moving within a symmetrical triangle pattern, a formation known for producing sharp breakouts. The technical structure suggests that PI is approaching the end of its consolidation phase and is likely to break through the pattern soon.
Given the strong inflows and building momentum, a successful breakout could push Pi Coin above the $0.250 level. From there, the price may extend toward $0.260 or even $0.272 if bullish conditions persist. These targets align with the current upward pressure reflected in momentum indicators.
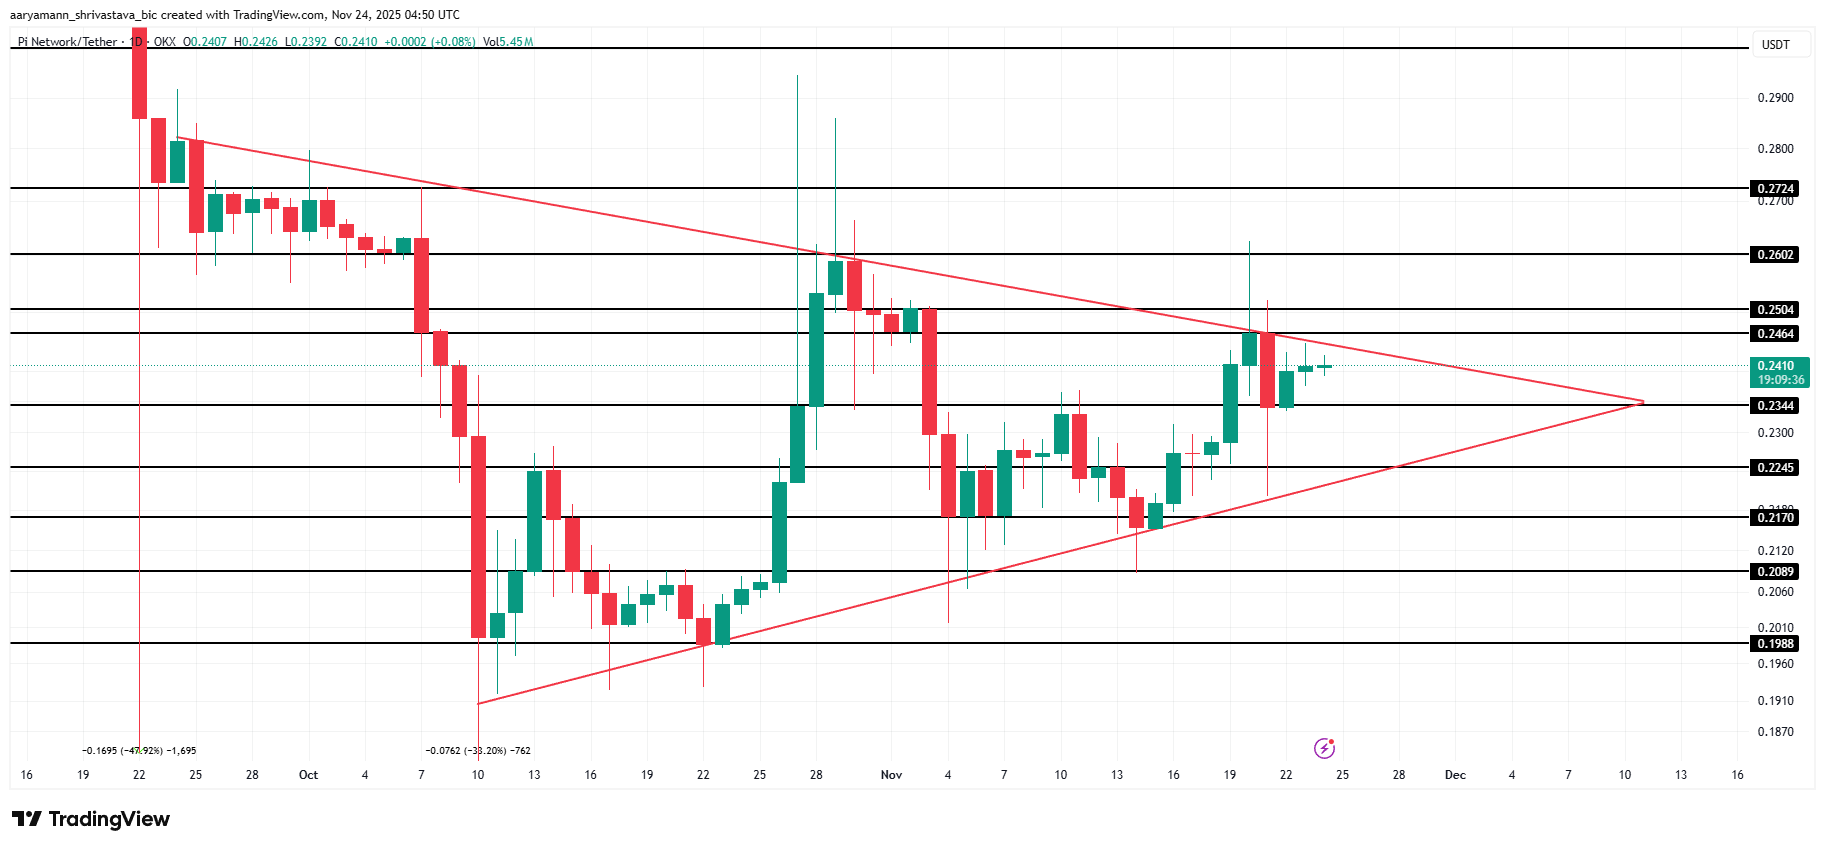 Pi Coin Price Analysis. Source: TradingView
However, investors should remain cautious. If either inflows weaken or bullish momentum softens, Pi Coin may shift into sideways movement. A breakdown from the symmetrical triangle could send the price falling to $0.224 or even $0.217. Such a move would invalidate the bullish thesis and signal a reversal in sentiment.
Recommended Articles


