

XRP Supply In Profit Falls to 58.5% – Lowest Since 2024 Despite Higher Price
XRP is facing one of its most challenging moments in recent months as selling pressure accelerates and the broader crypto market slips into a risk-off environment. Bitcoin’s collapse below key psychological levels has dragged altcoins with it, and XRP has not been spared. Analysts are increasingly warning that the market may be entering a bear phase, pointing to tightening liquidity conditions, rising global economic uncertainty, and a sharp decline in investor appetite for risk assets.
What makes XRP’s situation more fragile is the growing number of holders sitting on unrealized losses. On-chain data reveals that many late buyers — particularly those who entered after the ETF announcement and during the previous rally — are now underwater as the price continues to slide. This top-heavy market structure is creating pressure on holders, amplifying sell-side momentum as fear spreads.
The macro backdrop is adding fuel to the fire. With global markets adjusting to rate volatility, geopolitical tensions, and tightening dollar liquidity, capital is flowing out of speculative assets. XRP’s price is now caught at a crossroads: either it stabilizes at key support zones and absorbs the panic selling, or a deeper correction unfolds.
XRP Supply in Profit Signals Structural Fragility
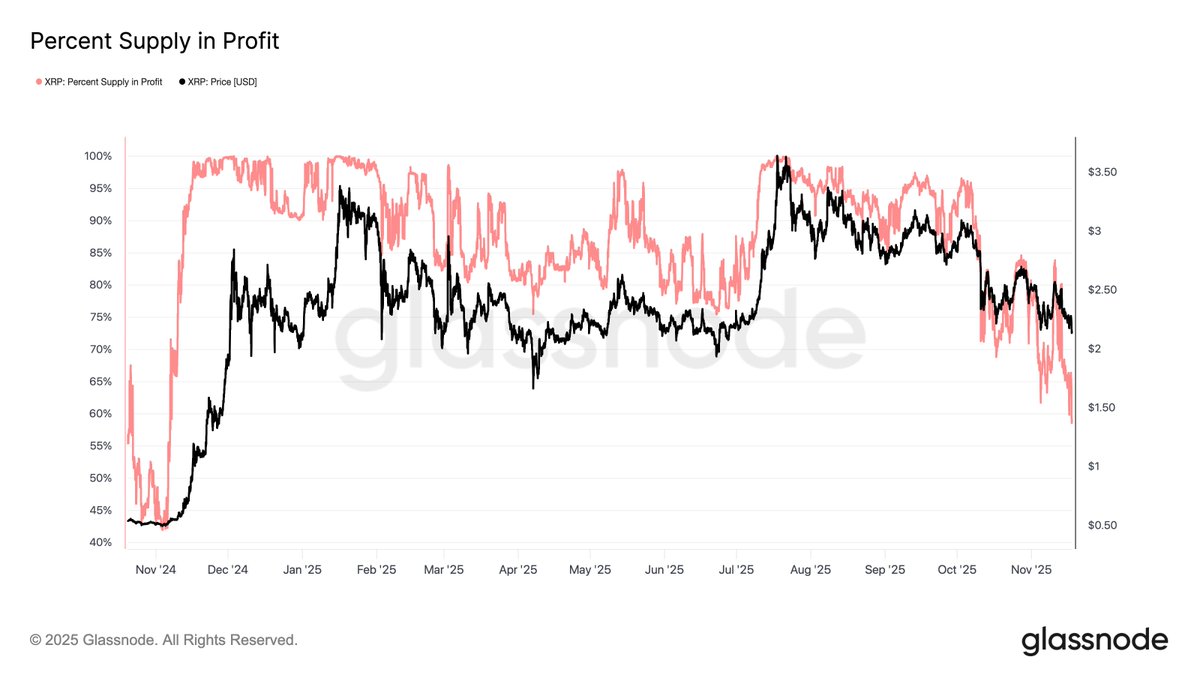
According to new data from Glassnode, XRP’s market structure is weakening significantly as the latest sell-off unfolds. The share of XRP supply currently in profit has fallen to 58.5%, marking its lowest reading since November 2024, when XRP traded at just $0.53. Despite today’s far higher price — around $2.15, nearly four times last year’s level — an alarming 41.5% of the circulating supply remains at a loss. That represents roughly 26.5 billion XRP sitting underwater.
This divergence highlights a critical issue: the market has become top-heavy, dominated by investors who entered late into the rally and bought at elevated price levels. These holders are now feeling acute pressure as prices retrace. Making the XRP supply distribution more fragile and increasing the probability of panic-driven selling. Historically, such setups often lead to accelerated downside movement unless strong demand steps in.
The fact that so much supply is in the red even at current elevated prices suggests that speculative flows, rather than long-term conviction, fueled the previous surge. As these late buyers face losses, sell pressure can intensify, feeding into a vicious cycle of liquidation.
XRP Price Analysis: Testing Critical Support Levels
XRP continues to struggle as selling pressure intensifies, with the chart showing a clear downtrend forming since early October. The price is now trading around $2.18, hovering just above a key horizontal support zone that has been tested multiple times throughout the year. Each bounce from this region has grown weaker, suggesting diminishing buyer strength and rising vulnerability to a deeper breakdown.

The moving averages reinforce this weakening structure. XRP is trading below the 50-day, 100-day, and 200-day MAs, with all three beginning to curl downward. A classic sign of trend deterioration. The failed attempt to reclaim the 50-day MA in early November marked a significant shift, as sellers quickly regained control and pushed the price lower. Volume spikes during downswings further confirm that distribution is ongoing.
Additionally, the lower highs forming since the September peak signal that bulls are losing momentum. Each rally attempt is being sold into faster, and the wick rejections near the $2.50–$2.60 region highlight strong overhead resistance. If XRP loses the current support band, the next liquidity pocket sits near $1.70–$1.80, where buyers previously defended aggressively.
Featured image from ChatGPT, chart from TradingView.com
Recommended Articles


