

Death Cross Confirmed: Is Bitcoin Bottoming or About to Crash?
The Bitcoin (BTC) price action triggered a Death Cross on Sunday, November 16, after its 50-day moving average dipped below the 200-day moving average.
Historically considered a bearish technical signal, the event has sparked fresh debate among traders and analysts. The key question: does this mark a local bottom, or is a further drop looming?
What Is a Death Cross and Why It Matters Now for Bitcoin Price
In technical analysis, a Death Cross occurs when short-term price momentum falls below long-term trends, signaling potential downward pressure. As of this writing, Bitcoin trades around $93,646, after slipping below the $94,000 threshold for the first time since May 5.
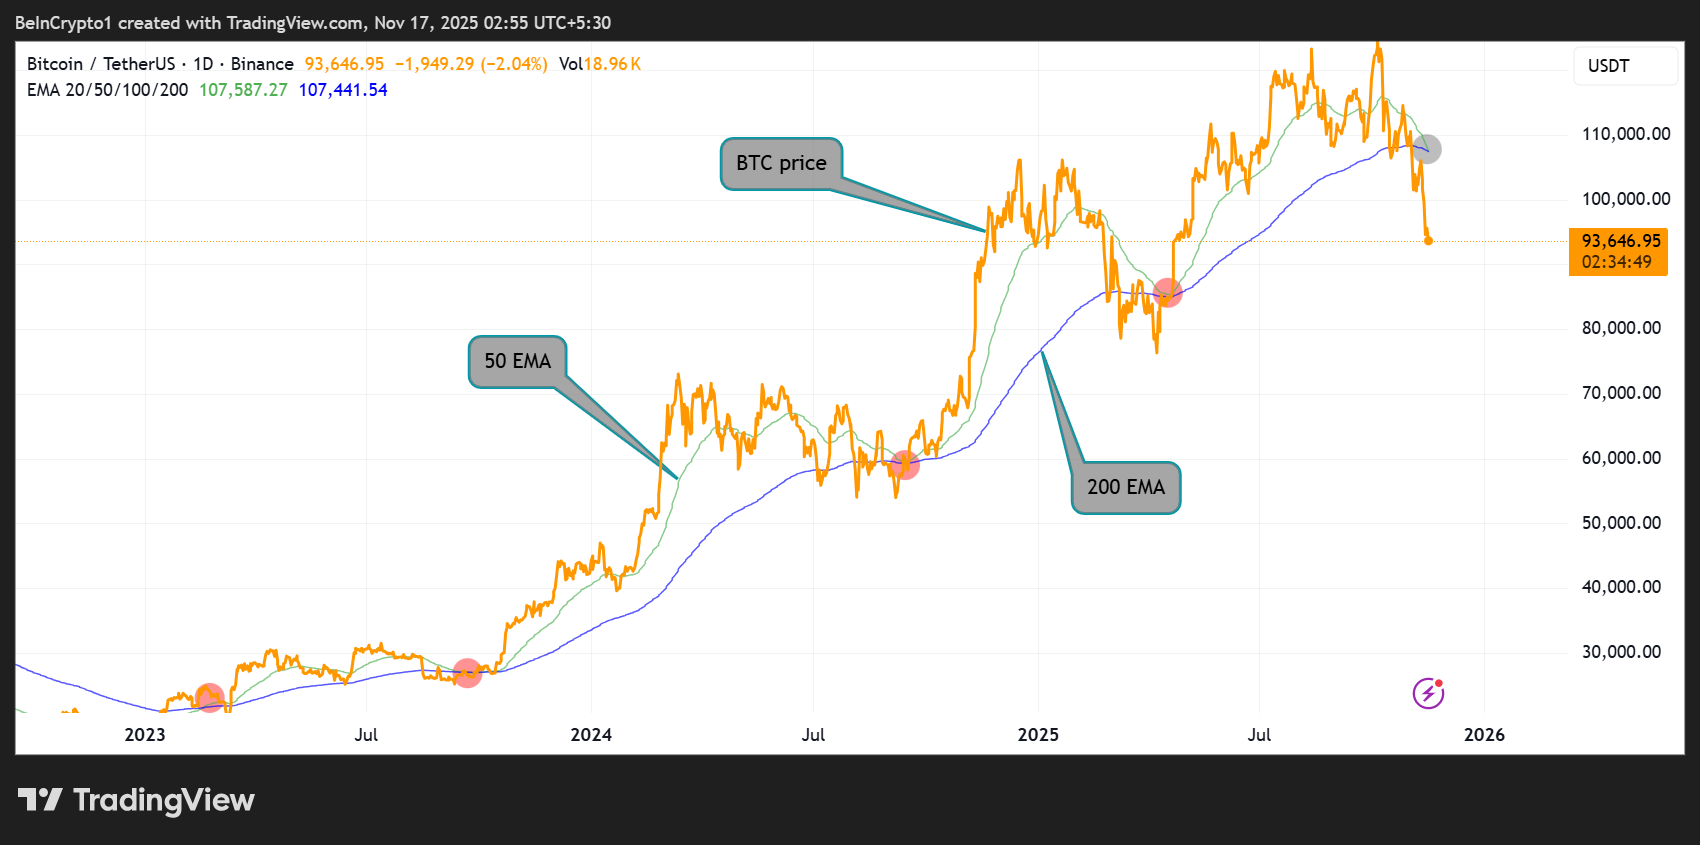 Bitcoin (BTC) Price Performance. Source: TradingView
Market sentiment is extremely bearish, with the Fear & Greed Index plunging to 10, indicating extreme fear. Meanwhile, whale selling and spot ETF outflows have accelerated recent downward moves.
Amidst these negative sentiments and fear of further downside, analysts say that a Death Cross does not automatically predict crashes.
Historical data from 2014 to 2025 shows mixed short-term outcomes but strong medium- to long-term rebounds in many cycles.
Historical Performance: Short-Term Losses, Medium-Term Gains
Data shared by Mario Nawfal and on-chain analysts indicates:
- 1–3 weeks post-cross: Returns are nearly 50/50 between gains and losses; median returns slightly positive (~0.25–2.35%).
- 2–3 months post-cross: Average gains jump to 15–26%, suggesting a potential recovery if historical patterns hold.
- 12 months later: Outcomes vary widely; some cycles delivered 85%+ gains, others experienced severe drawdowns, depending on the macro context.
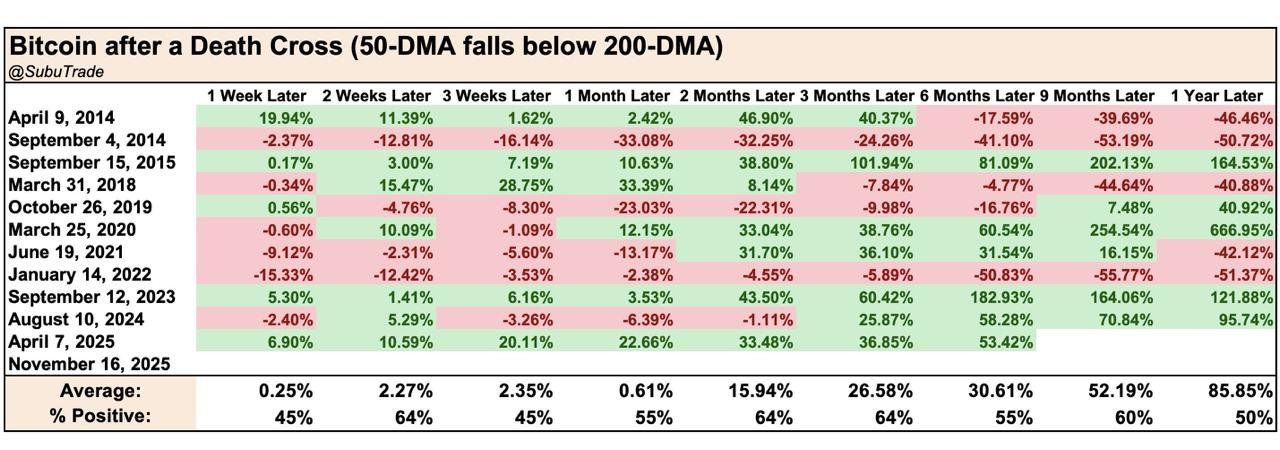 Bitcoin Price After Death Cross. Source: Mario Nawfal on X (Twitter)
Benjamin Cowen and Rekt Fencer argue that previous Death Crosses have often marked local lows, rather than market tops. The timing of the next bounce could be critical. If BTC does not rally within 7 days, analysts warn another leg down could precede a larger recovery.
What’s Next for Bitcoin Investors? Key Levels and Market Signals
Technical and macro indicators highlight crucial thresholds:
- Support range: $60,000–$70,000, a potential floor if selling pressure intensifies.
- Bullish confirmation: Reclaiming the 200-day moving average as support could signal renewed upward momentum.
Analyst Brett notes that the 50-week MA remains a more decisive long-term indicator than the Death Cross alone.
Historical cycles indicate that Death Crosses during bull markets often precede rallies toward new all-time highs. Conversely, those during bear markets are typically short-lived.
Nonetheless, investors should monitor short-term price action closely because historical data implies:
- A bounce within a week could signal the bull cycle remains intact.
- Failure to bounce may trigger another decline, creating a macro lower high before a larger rally.
Meanwhile, medium-term projections indicate a 15–27% recovery gain over the next 2–3 months if BTC follows median historical behavior.
The long-term upside remains plausible, but variability is high, highlighting the importance of combining technical, on-chain, and macro analysis for informed strategic decisions.
While the Death Cross signals caution, history shows that Bitcoin often rebounds after similar events. Traders should remain alert, watch key support levels, and be prepared for short-term volatility, even as potential medium- and long-term gains remain within reach.
Recommended Articles


