

One Level Break Could Send the Zcash Price Above $1,000
Zcash has had a strong month. It is up almost 21% in the past seven days and is one of the few coins holding steady while much of the market struggles. The broader trend also looks firm, with the Zcash price rally still riding its earlier breakout.
The real question now is whether this move can stretch toward $1,010 and beyond. The charts say it can — but only if one level finally gives way.
Buyers Are Active, But Momentum Still Needs A Stronger Push
The first signal comes from On-Balance Volume (OBV), an indicator that tracks buying and selling pressure by adding volume on green candles and subtracting it on red ones.
OBV has been pressing against a descending trend line since November 7, almost matching the ZEC price. Zcash also peaked on the same day and has been trying to reclaim that area since.
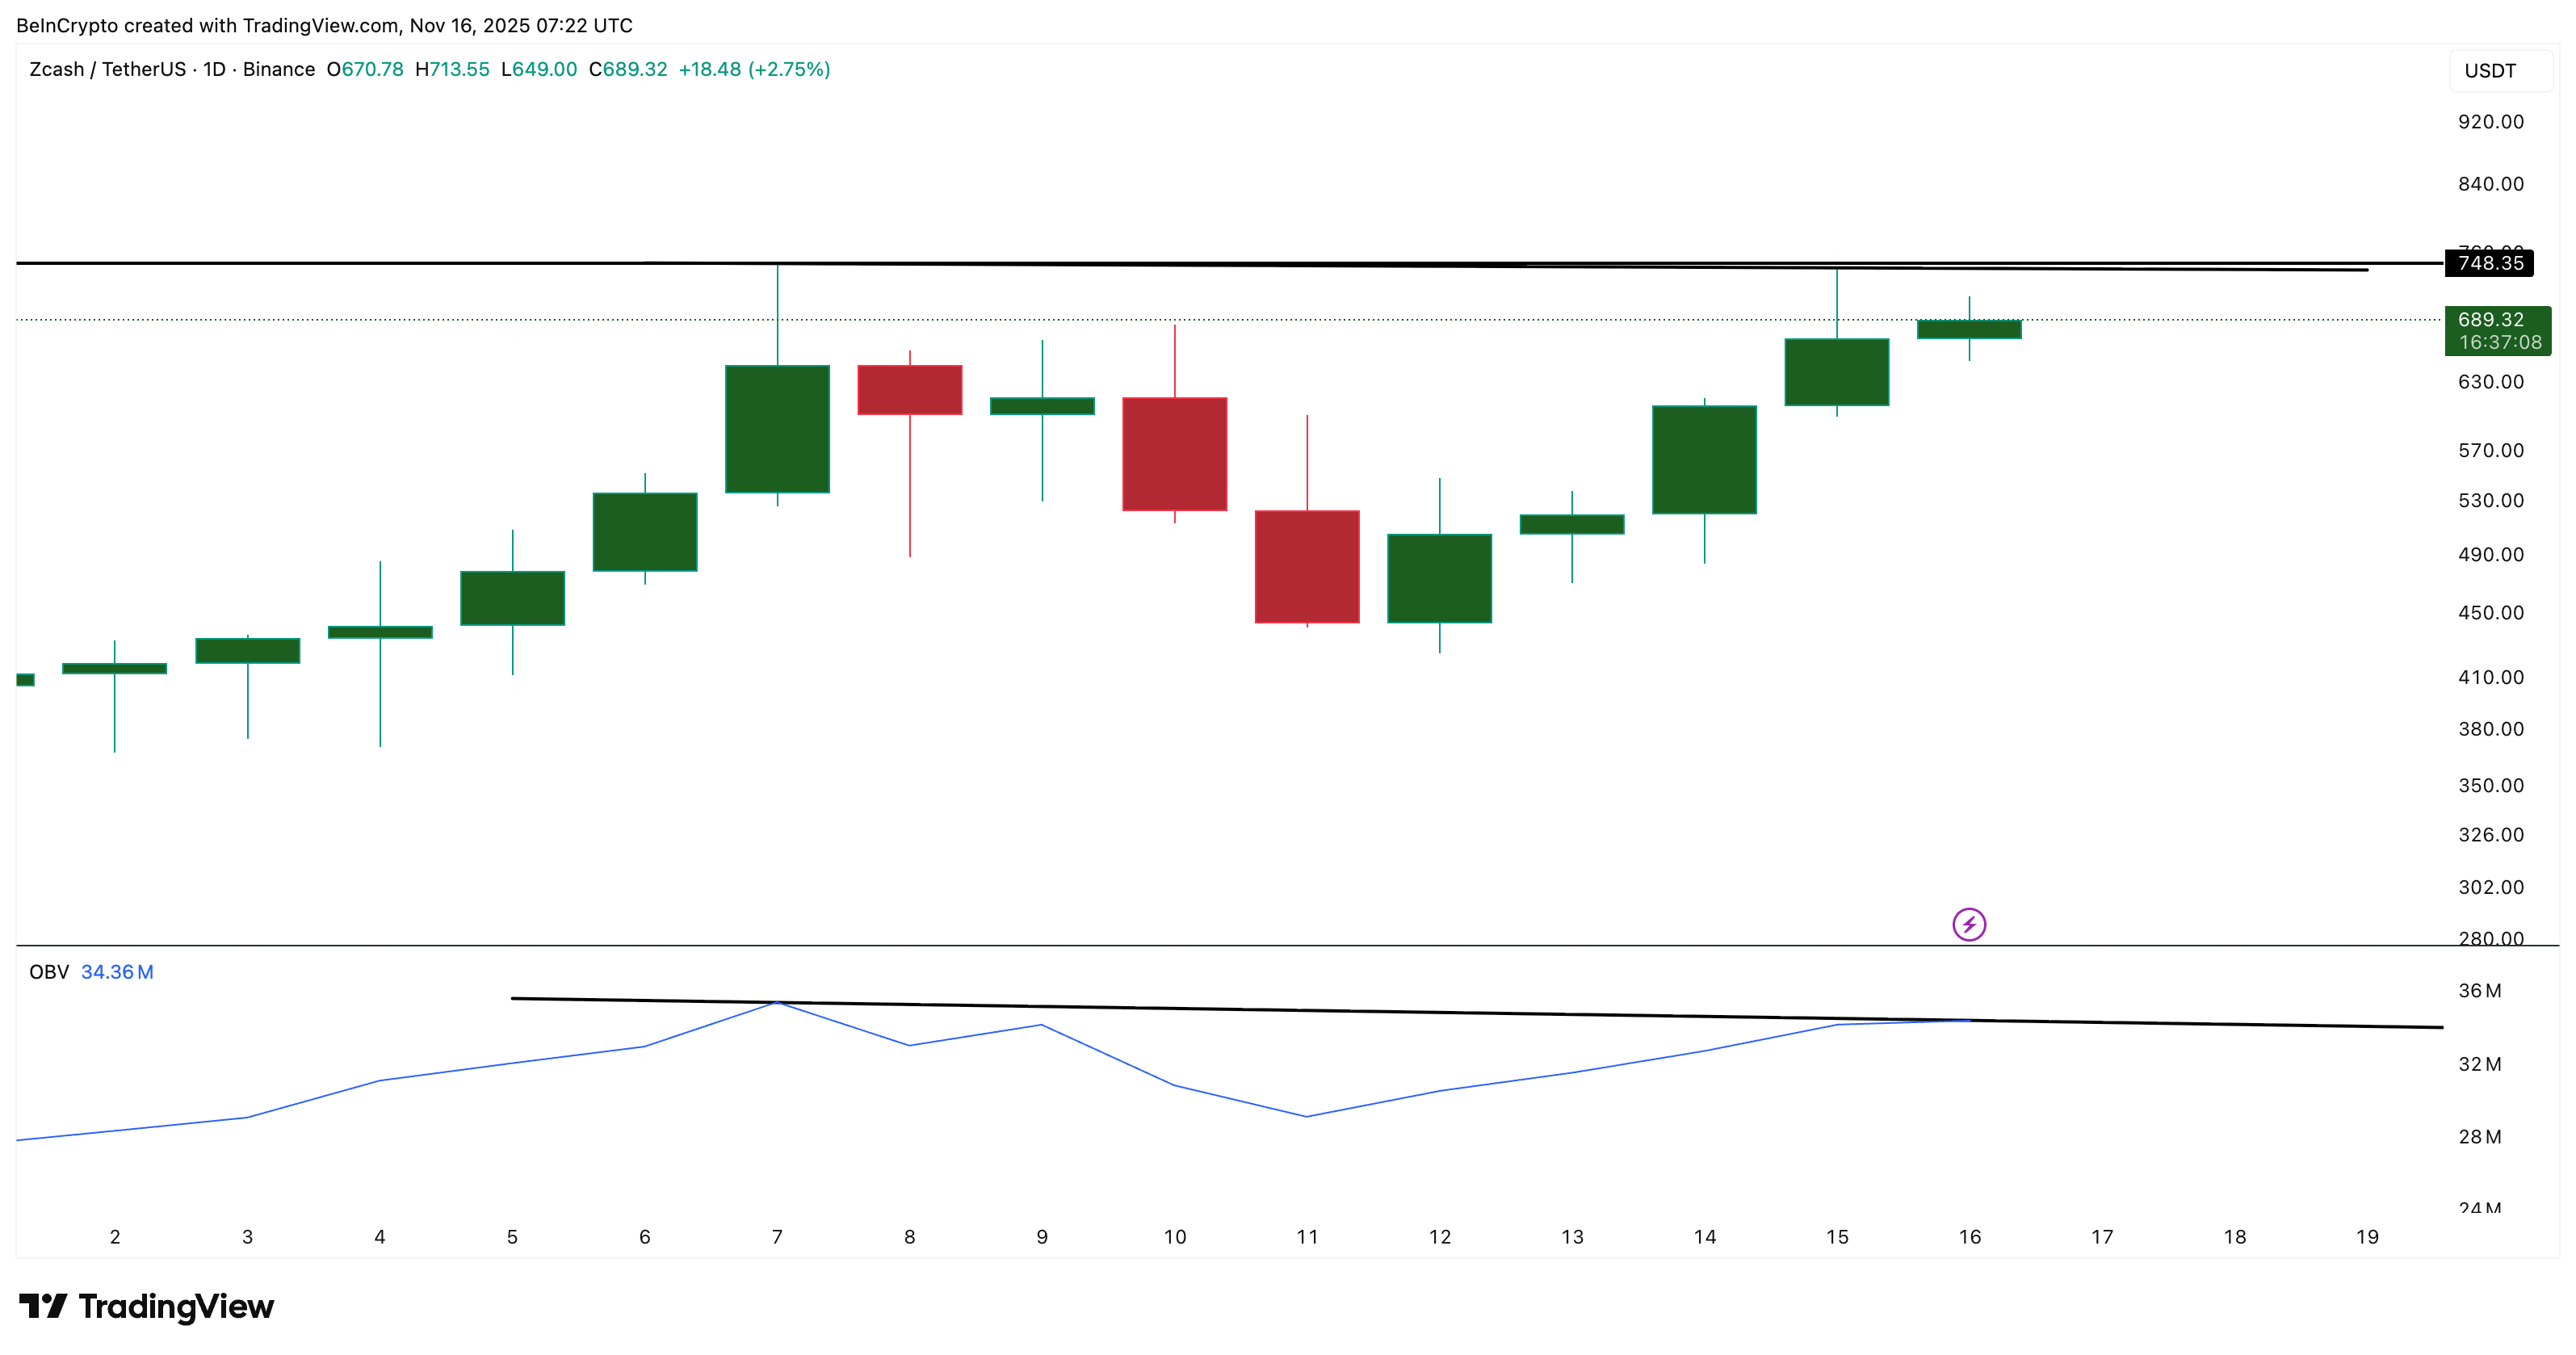 Volume Confirmation Needed: TradingView
Want more token insights like this? Sign up for Editor Harsh Notariya’s Daily Crypto Newsletter here.
This matters because both price and OBV are meeting resistance at the same spot. If the Zcash price rally clears $748 and the OBV breaks above its trendline together, the move gains real confirmation backed by volume.
The second indicator is the Chaikin Money Flow (CMF), which tracks whether big-wallet money is flowing in or out. CMF is forming its own symmetrical triangle.
Each time CMF touched the lower boundary, ZEC dipped briefly. Now, CMF has held support and is rising again.
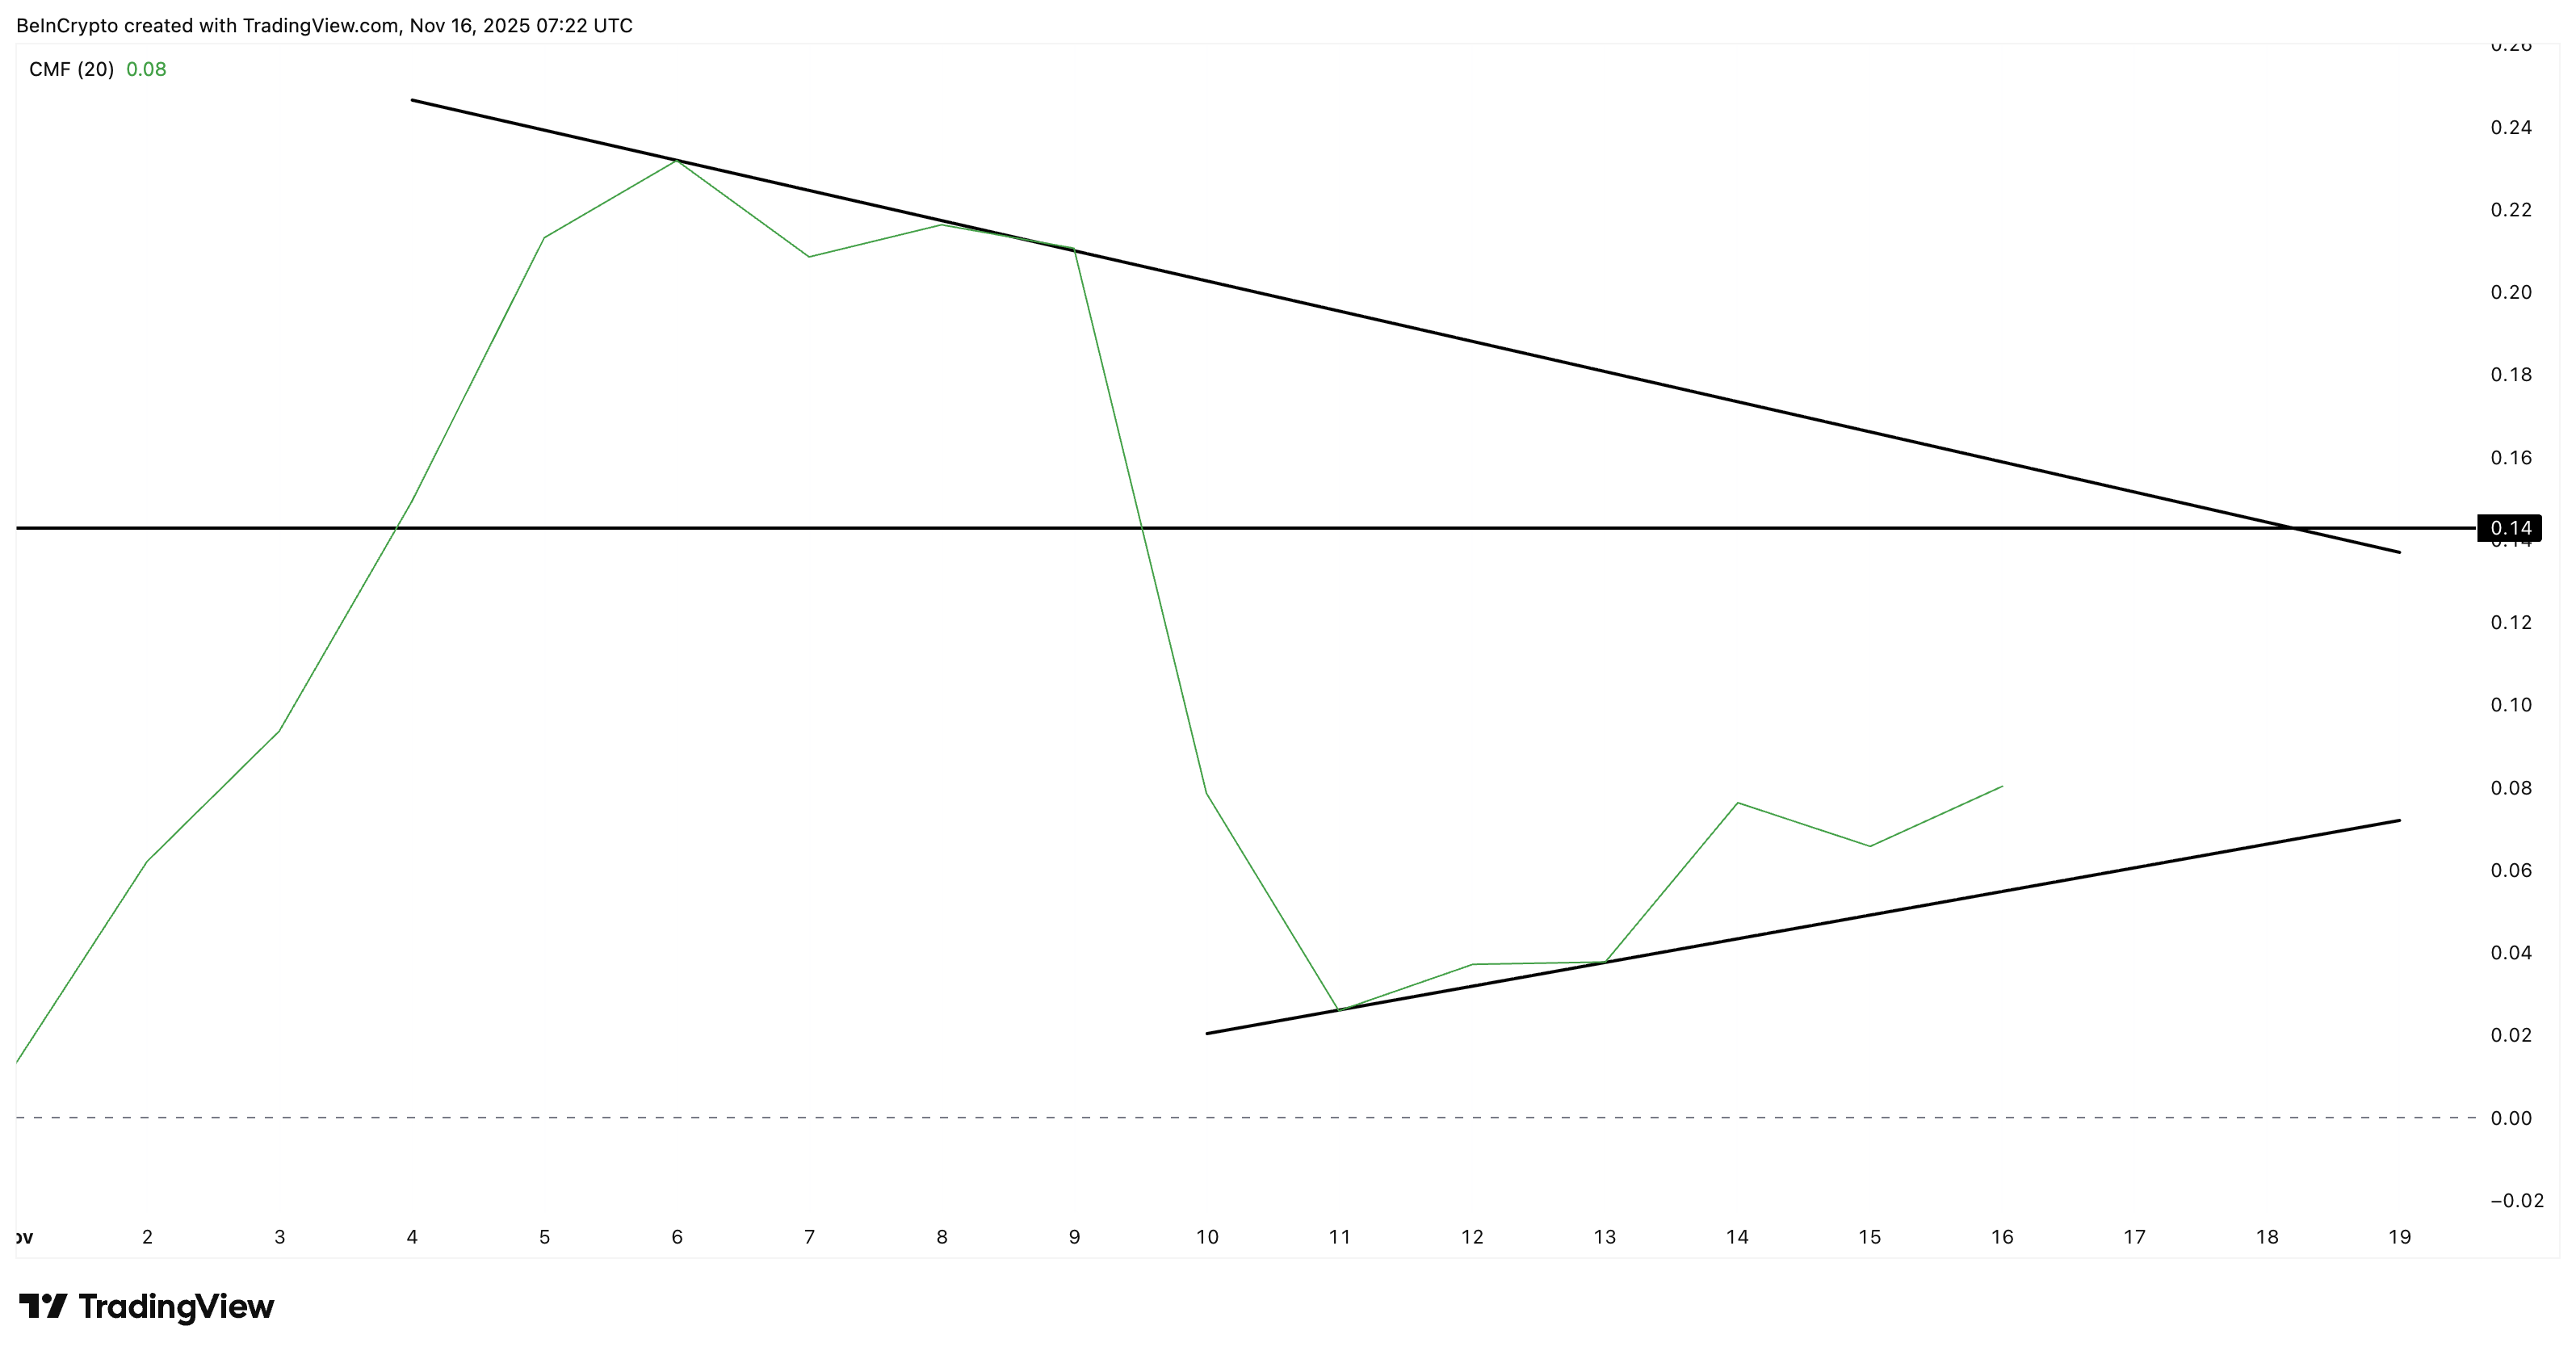 Zcash Needs CMF Confirmation: TradingView
A clean breakout above 0.14 on CMF would show strong inflows returning from larger holders — the same kind of flows that supported earlier sustained Zcash rallies.
If OBV breaks its trend line and CMF clears 0.14 at the same time, both indicators will finally align behind the next leg of the move.
Zcash Price Rally Needs A Break Above $748
The Zcash price chart gives the same message. ZEC broke out of a small flag pattern on November 14, and $688 is acting as a minor resistance. But the level that controls everything is $748.
A daily candle close above $748 puts the Zcash price train on a four-digit track. The first major stop sits at $1,010, followed by $1,332 if momentum accelerates. These levels align with key Fibonacci zones and fit with ZEC’s three-month trend, which is up more than 250%.
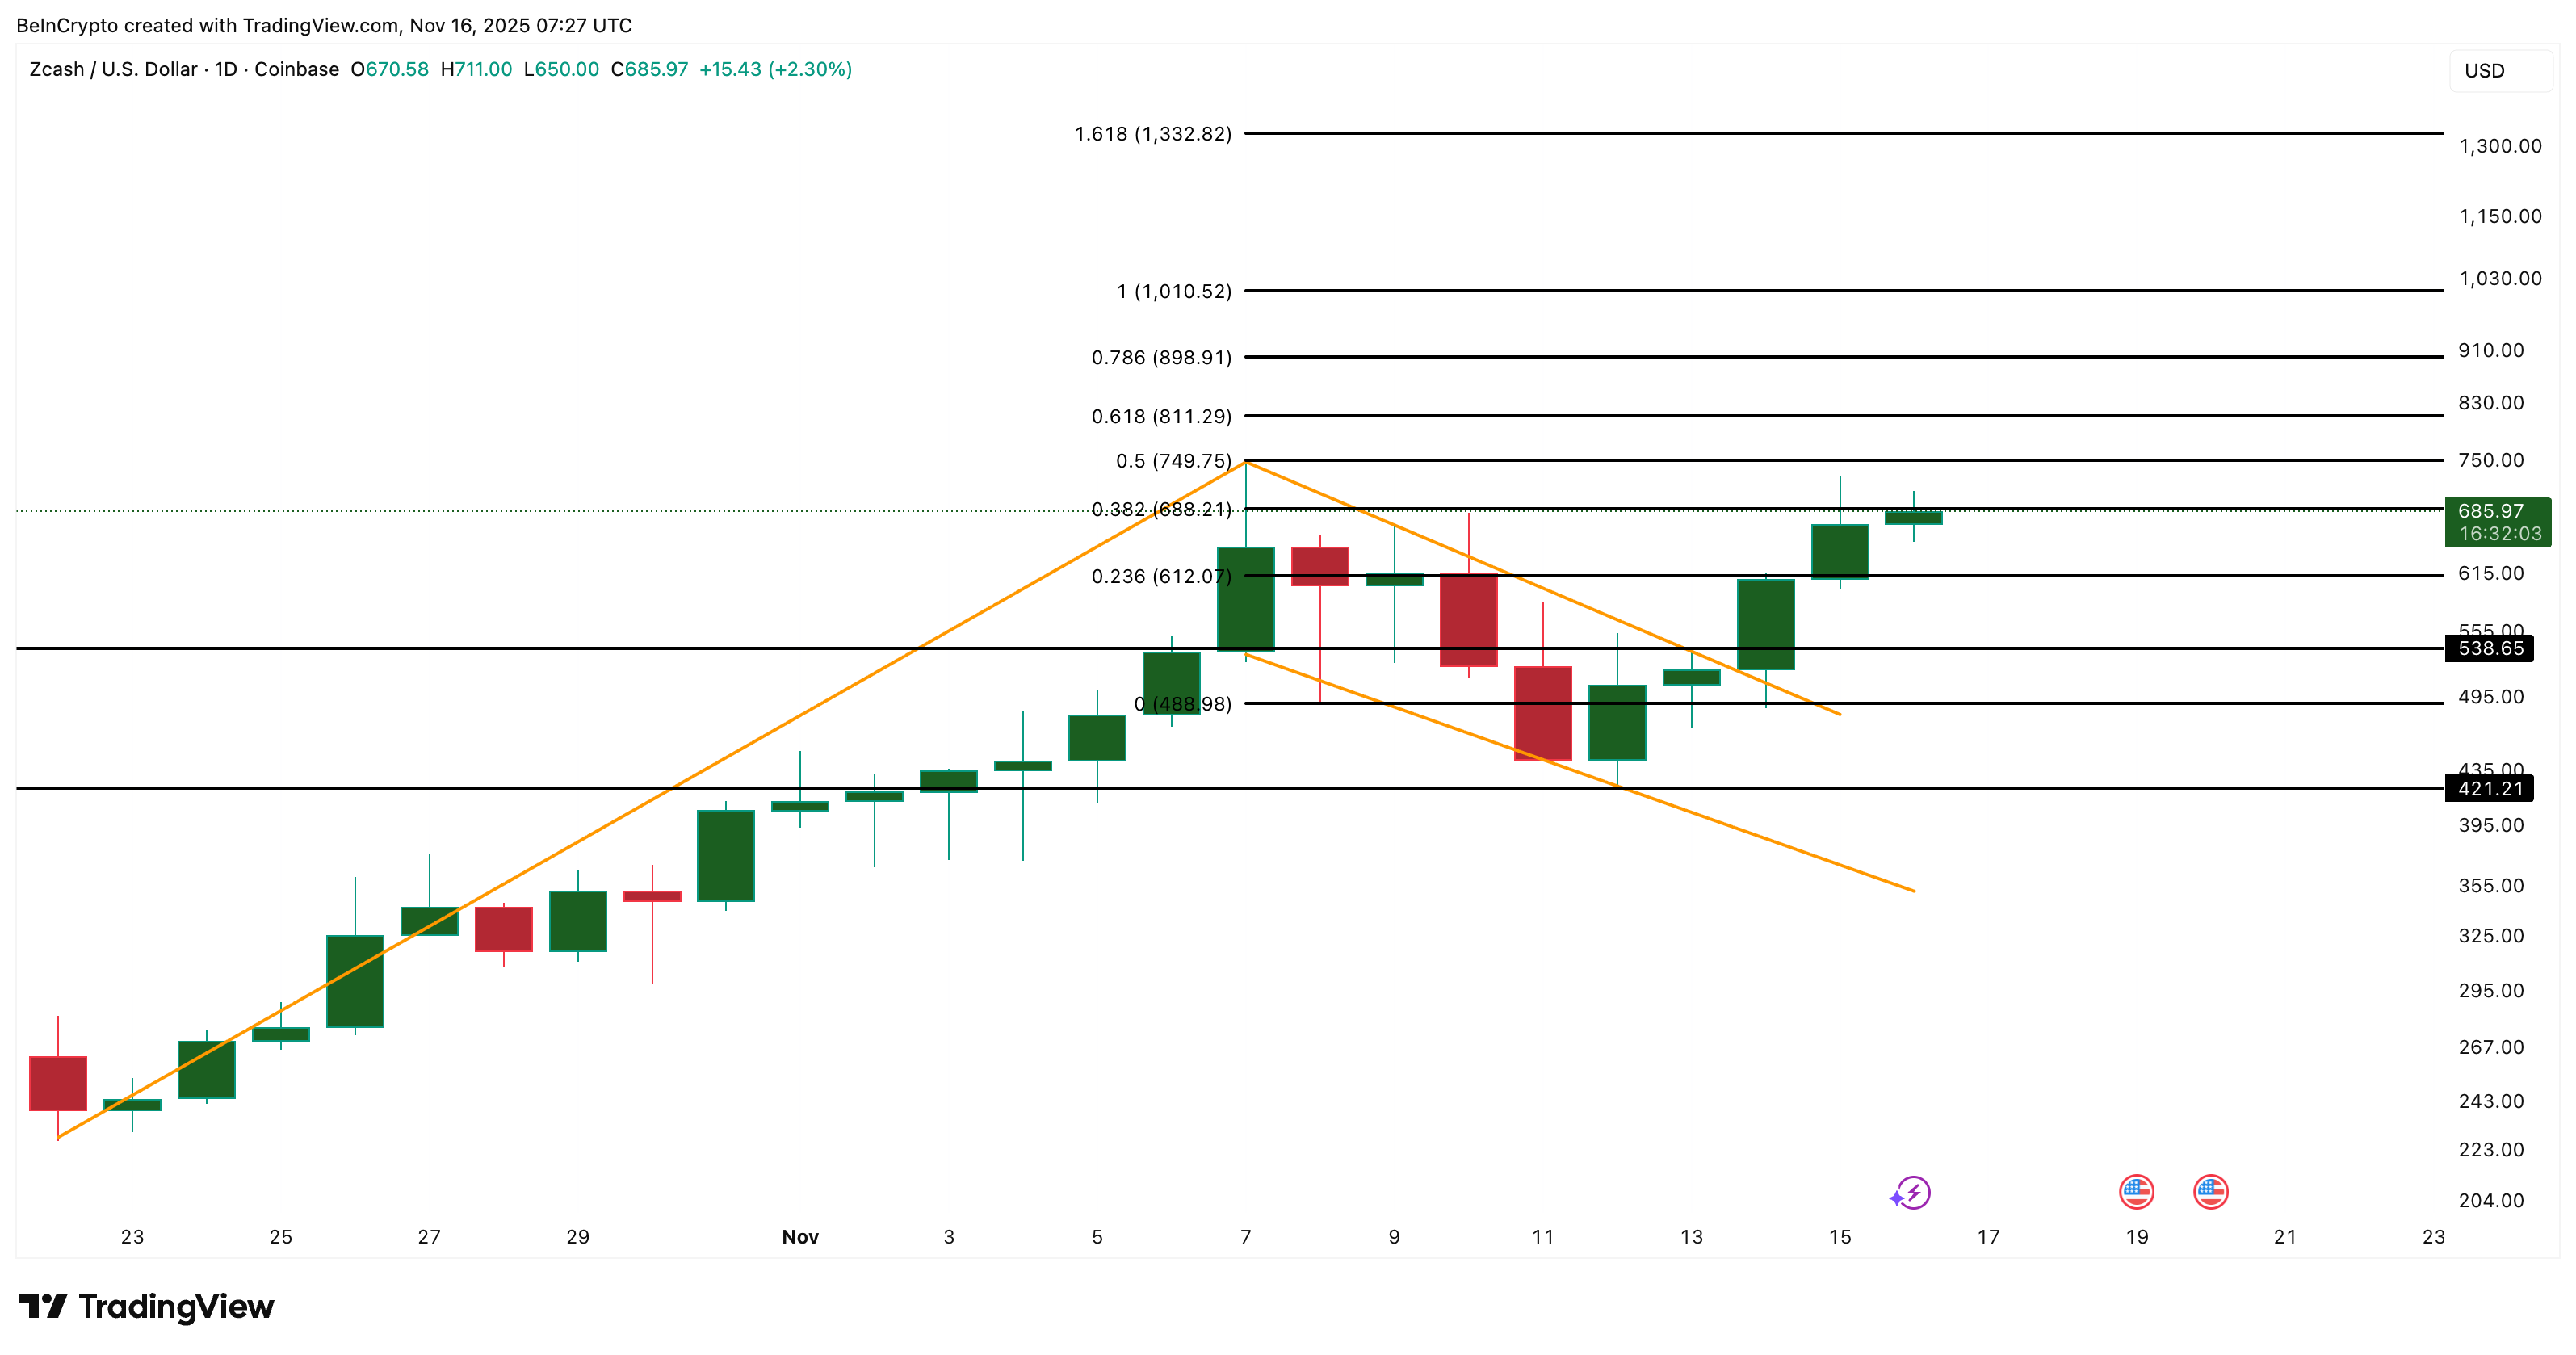 Zcash Price Analysis: TradingView
There is still a clear invalidation level. A drop below $488 weakens the entire structure and sets the stage for a slide toward $421. That would stall the rally and force the ZEC price to rebuild its setup.
For now, the Zcash price rally has real potential — but its next step depends on one thing: a decisive break above $748 backed by fresh volume. If ZEC clears that line, the path toward $1,010 becomes far more realistic.
Recommended Articles


